Should we worry about the late selloff yesterday? |
US equities saw a selloff in the last hour of trading which is not an unusual event. The fact that all three major indices moved in sync and closed pretty much with the same performance is a rarer event. |
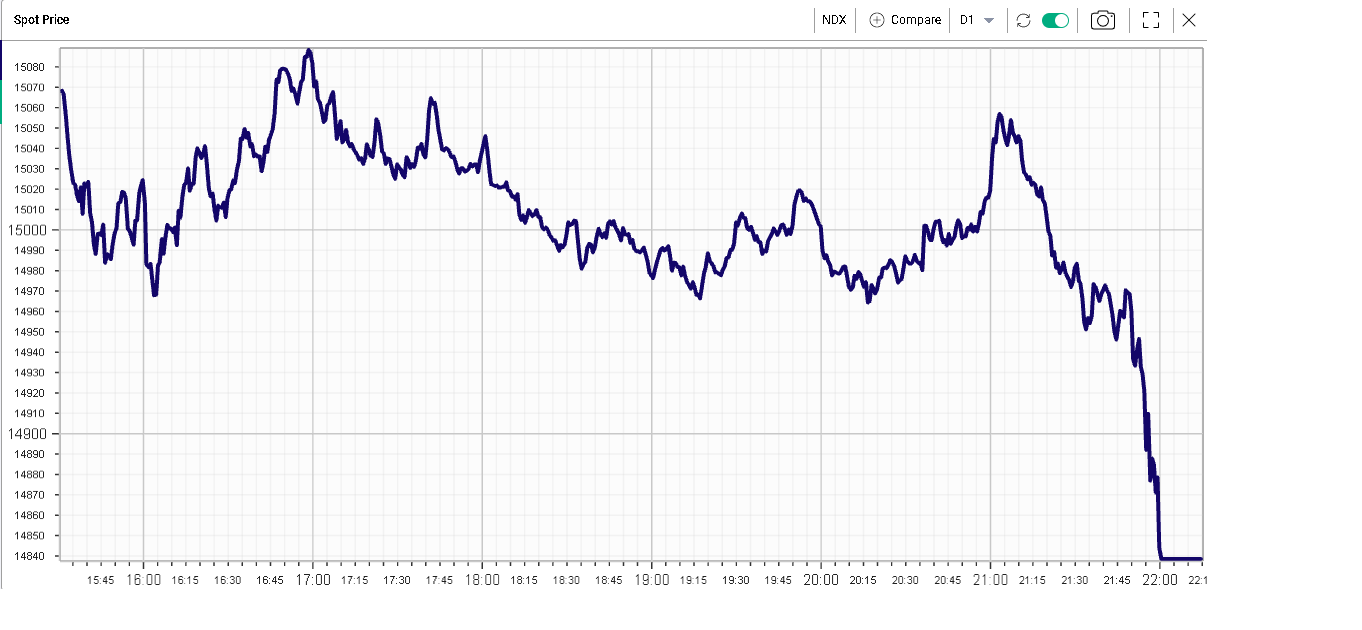
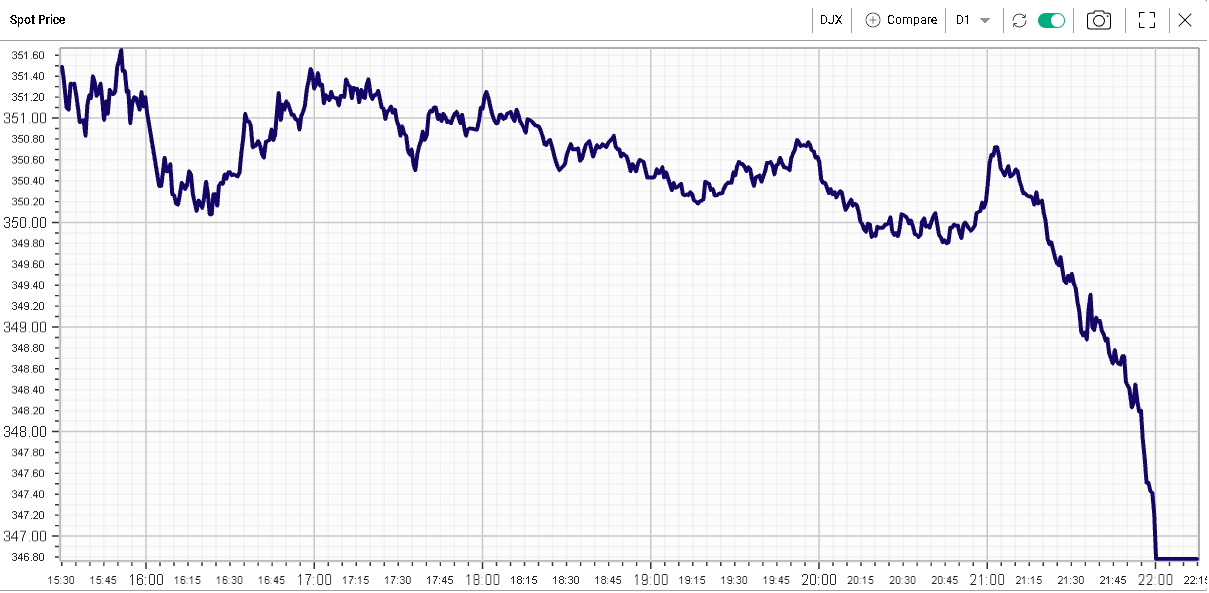
The SPX closed down 1.57%, the NDX -1.56% and the DJIA -1.55%. If any statisticians read this newsletter, we wonder what is the probability that such a sequence would occur. |
SPX intraday price action |
NDX intraday price action |
DJX intraday price action |
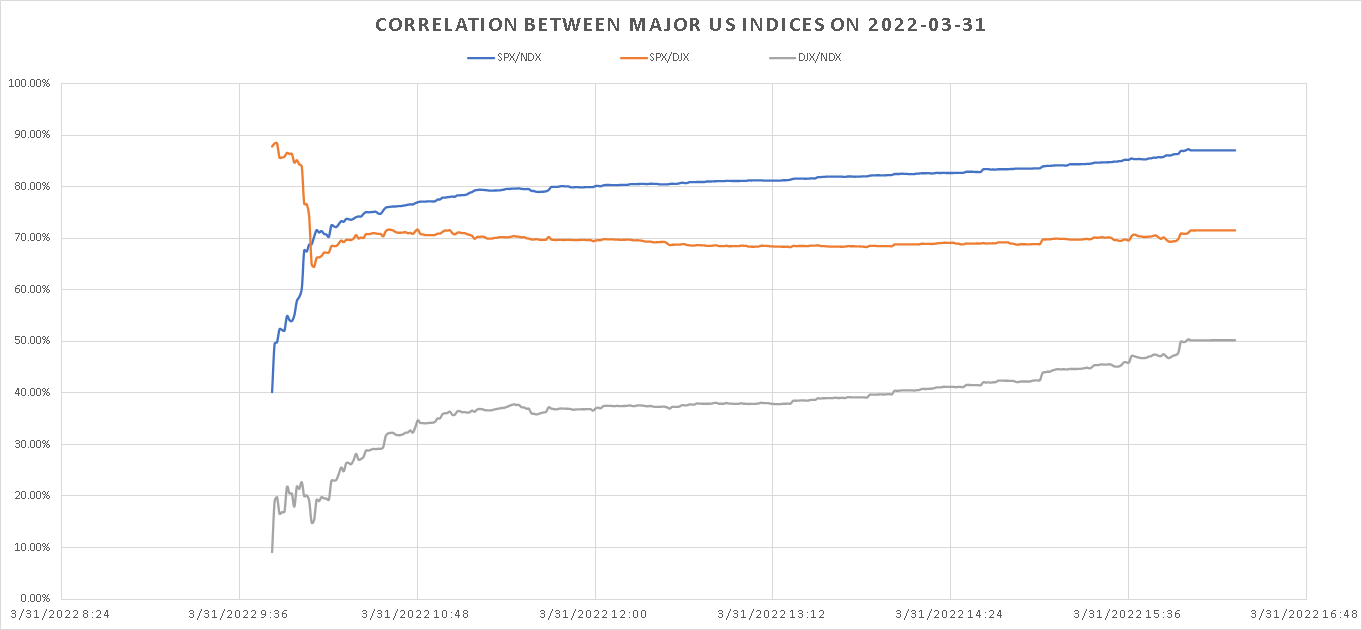
The below chart shows the rolling daily correlation between the major indices in the US. We can see that the SPX/NDX and the DJX/NDX correlation generally increased throughout the day while the SPX/DJX correlation was steady around 70%. SPX and NDX reached a correlation over the day close to 90%. |
|
What is maybe even more surprising than the correlation towards the close was the relatively low correlation levels observed during the first hours of trading. |
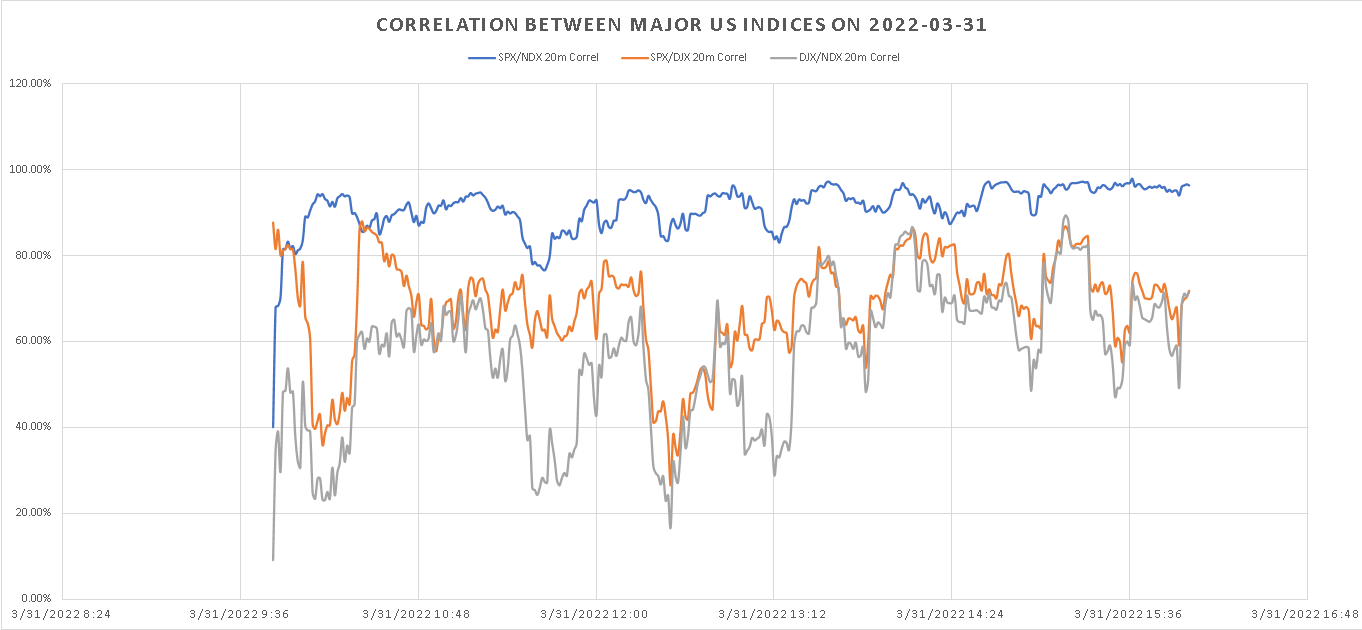
Looking at the rolling correlation between the DJX and other indices, we can see the periods where it suddenly started to move independently from the SPX and the NDX. Looking at the blue line shows how the SPX and NDX remained relatively well correlated throughout the day apart from the very beginning of the day. |
|
Depending on the indices, this could be a sign that the market is focusing more on specific themes that will support some sectors and stocks more than others. In order to assess that phenomenon, we can look at the sector ETFs to understand how far apart their performances were. |
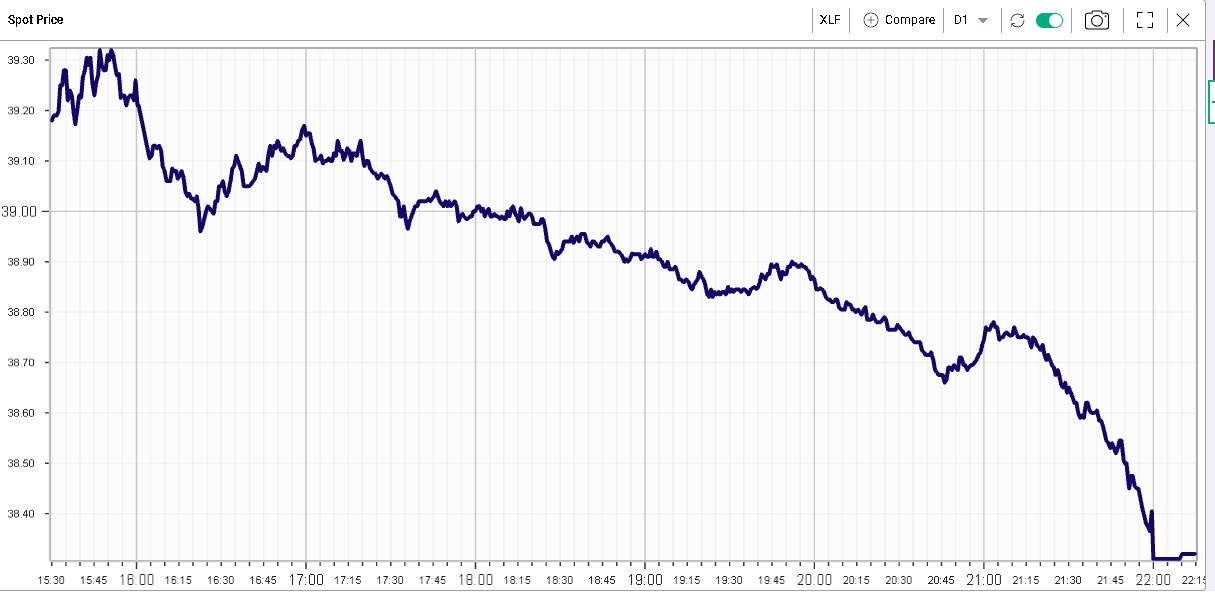
Financials were the worst performing sector yesterday closing down about 2.3% at the index level. In the space, the selling was continuous throughout the day and accelerated into the close in line with headline indices. |
|
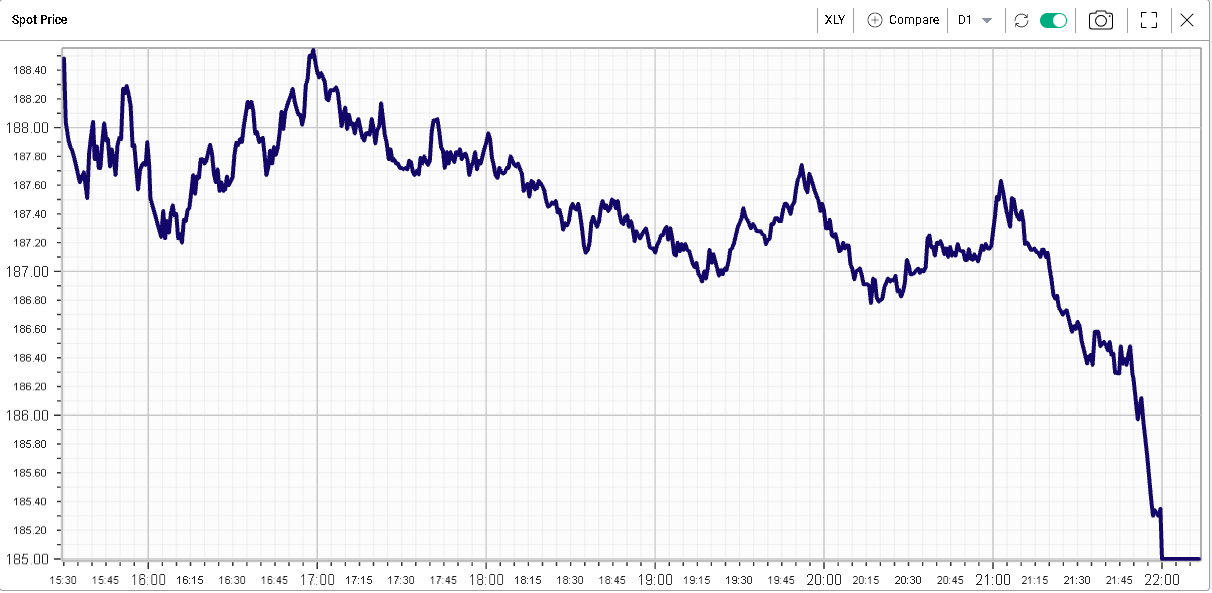
The XLY was also under pressure finishing about 2% lower but was one of the drivers of the late day selloff having generally resisted pretty well during the rest of the day. |
|
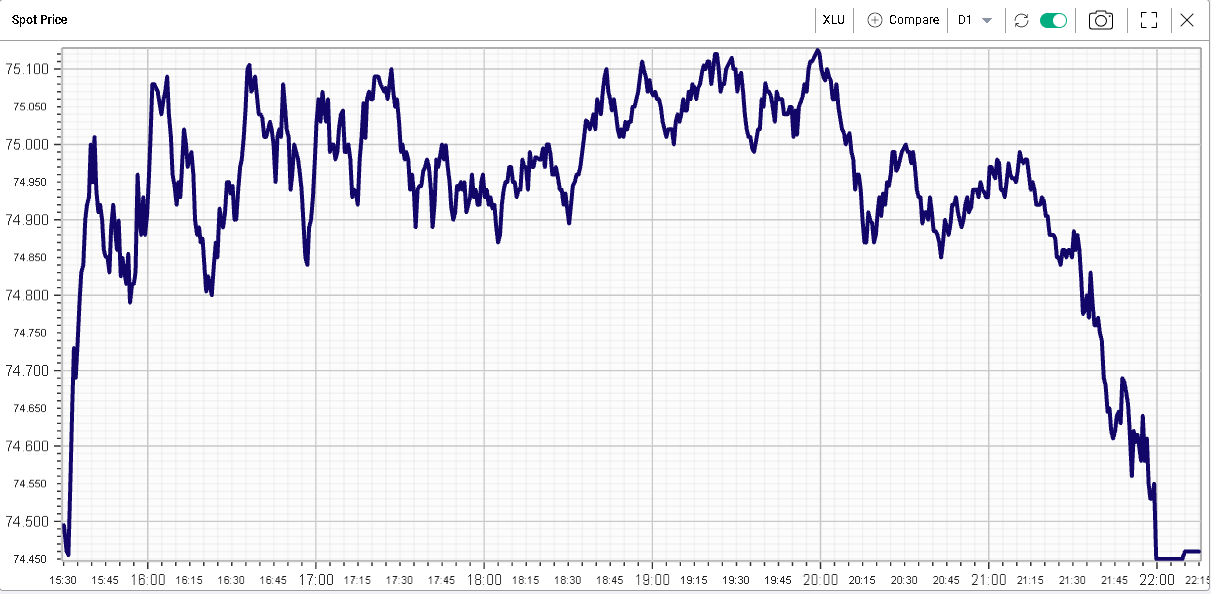
On the other end of the spectrum, utilities managed to rally early on gaining almost 1% at some point but gave of all their gains and more into the close to finish slightly lower -0.11%. |
|
A similar picture is visible for staples which rallied all day and got sold into the close. |
|
This analysis helps frame the idea that, whenever a macro event hits the market, all sectors are generally impacted to the same extent. This is a phenomenon that is repeated over and over and gives great trading opportunities to keen market observers. |
Although sectors were exhibiting very different performances until the final hour of trading, some trading activity correlated all sectors and indices together and pushed the entire space lower irrespective of their prior performance. The 5 sectors we looked at all finished at their lows of the day and the selloff was meaningful in a short period of time. |
This event could have been the end of the quarter, an important moment for investors looking to assess their overall exposures for the next quarter and getting ready for what may come. Given the highly correlated moves, it is possible that some investors decided to add hedges, possibly in the form of Futures on the major indices. This is a mere conjecture that we make based on the price action. The next few days will be important to watch in order to understand if those concerns were purely linked to quarter-end or if they have a deeper meaning. |
Disclaimer - This information is provided for general information and marketing purposes only. The content of the presentation does not constitute investment advice or a recommendation. IVolatility.com and its partners do not guarantee that this information is error free. The data shown in this presentation are not necessarily real time data. IVolatility.com and its partners will not be liable for any loss or damage, including without limitation, any loss of profit, which may arise directly or indirectly from the use or reliance on the information. When trading, you should consider whether you can afford to take the high risk of losing your money. You should not make decisions that are only based on the information provided in this video. Please be aware that information and research based on historical data or performance do not guarantee future performance or results. Past performance is not necessarily indicative of future results, and any person acting on this information does so entirely at their own risk. |