4 stocks to watch after the holidays |
A late day selloff in the market pushed US equities firmly into negative territory ahead of the long weekend with the NDX leading most likely on the back of interest rates moving higher again with the 10y back at 2.8% vs a level of around 2.68% on Thursday morning. |
Volatilities followed spots fairly closely with very little divergence visible and 30 days NDX IVX Is around 27%. |
|
All US indices finished in the red with the DJIA outperforming (-0.33%) and the SPX down around 1.2%. Implied volatilities gained about 1 point in the SPX/DJIA and about 2 points in the NDX. |
Looking at the Dow Jones Industrial Average gives only a very partial view of the reality. Underneath the surface, some very large divergence between stocks happened. This is generally a sign that investors and traders were expressing worries that were related to specific businesses rather than getting worried about a more macro shock. This is a phenomenon that we have highlighted in multiple newsletters previously and we continue to see the rotation at play. |
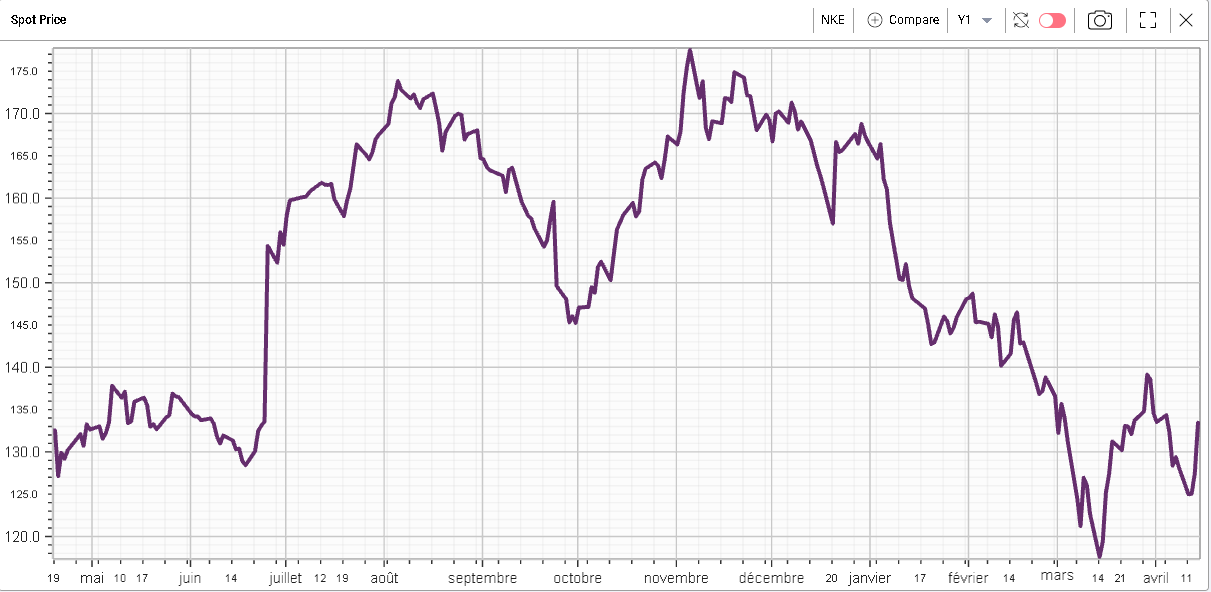
Amongst the outperformers, two companies really stood out. First NKE almost gained 5% on the day. Despite having an average net margin of around 10% over the past 5 years, NKE has significantly underperformed so far this year still down almost 20% year to date despite Thursday’s rebound. |
|
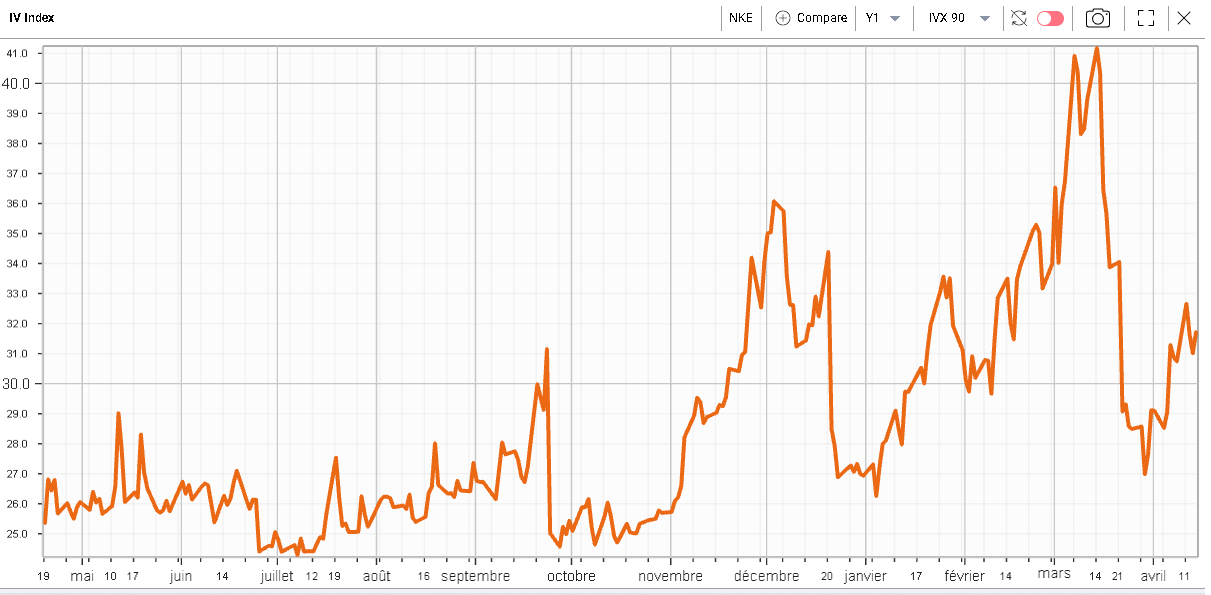
Meanwhile, the 90 days IVX shown below has remained under control over the past few weeks. |
|
This creates a backdrop that call buyers generally like, a stock that looks discounted and an implied volatility that does not seem too elevated compared to its own history. |
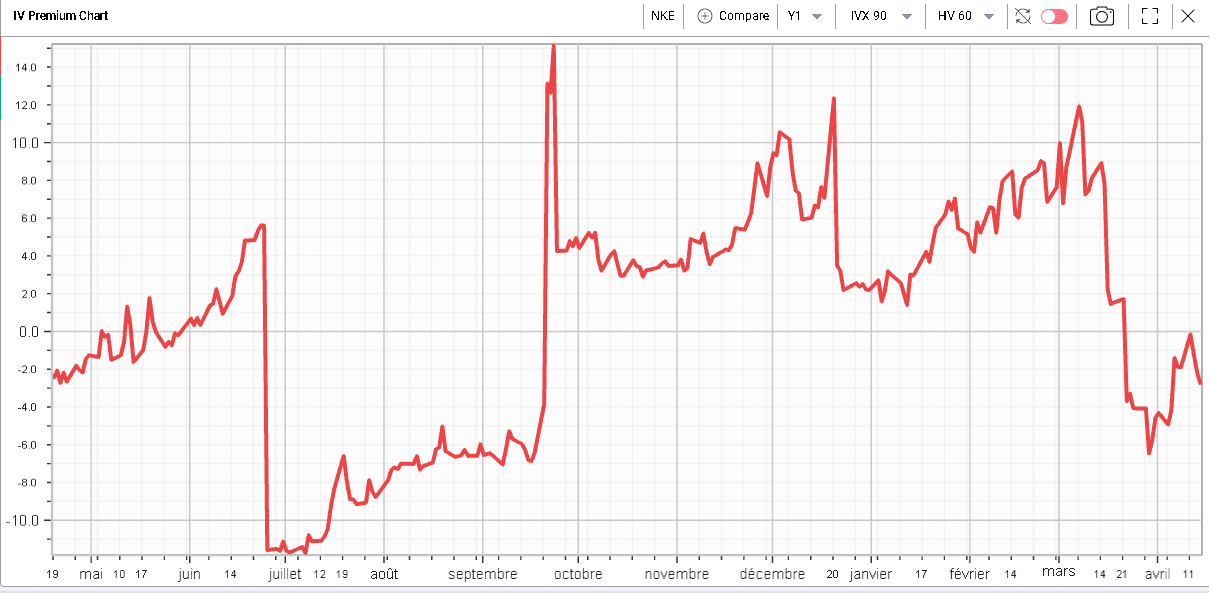
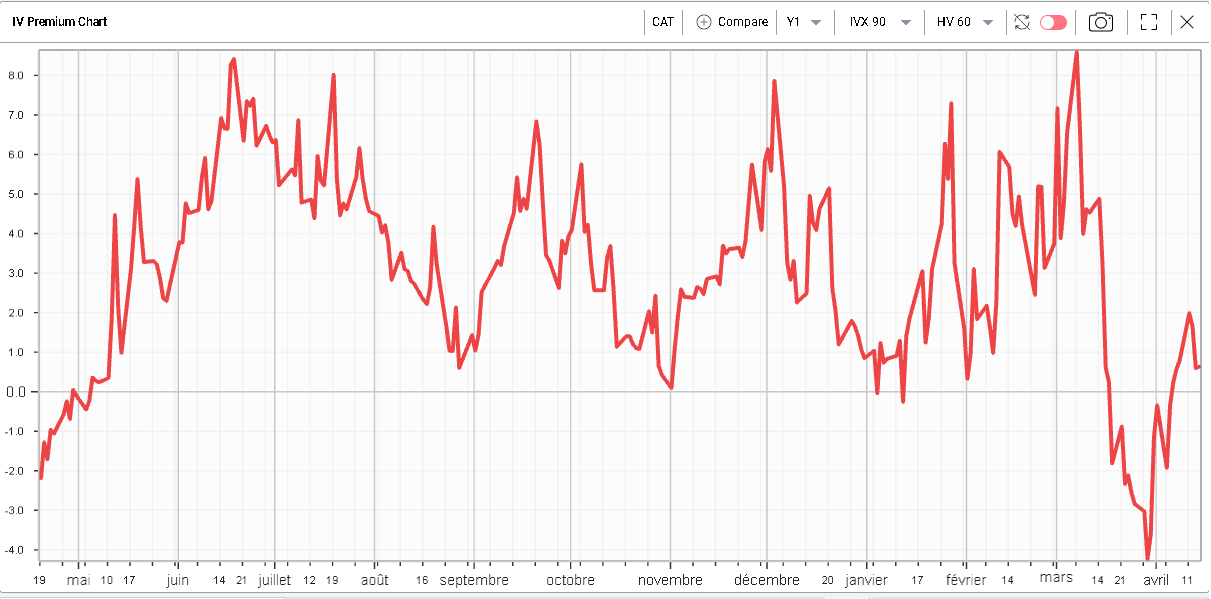
Looking at the IVX Premium defined as the difference between the IVX and the equivalent Historical Volatility (here we are using 90d IVX and 60d HV) we can see that 90d IVX is currently lower than historical volatility. |
|
This backdrop could explain why the call volume witnessed on Thursday was one of the largest over the past 12 months. |
|
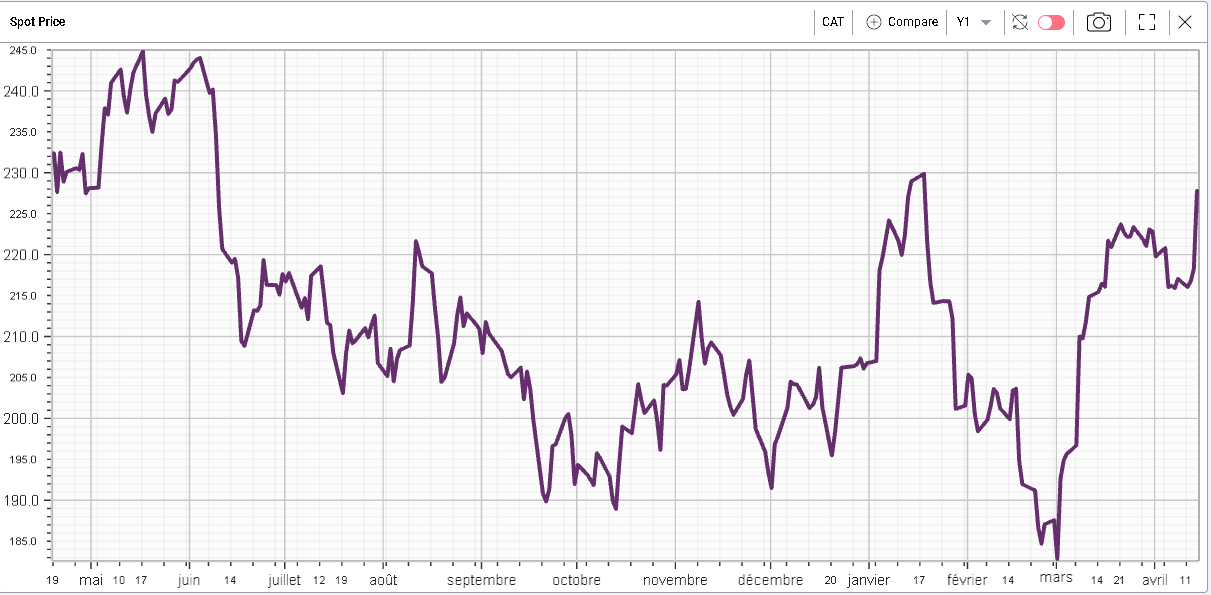
CAT was the other standout of the DJIA on Thursday up 4.4% on the day. CAT shows an average 9% net margin over the past 5 years but contrary to NKE, it is up around 10% so far this year. |
|
Looking at the 90d IVX, we find a similar picture to the broader market with a spike in volatility at the end of February and the beginning of March before retracing lower. |
|
This gives an 90d/60d IVX premium which is slightly positive but far off its highs. |
|
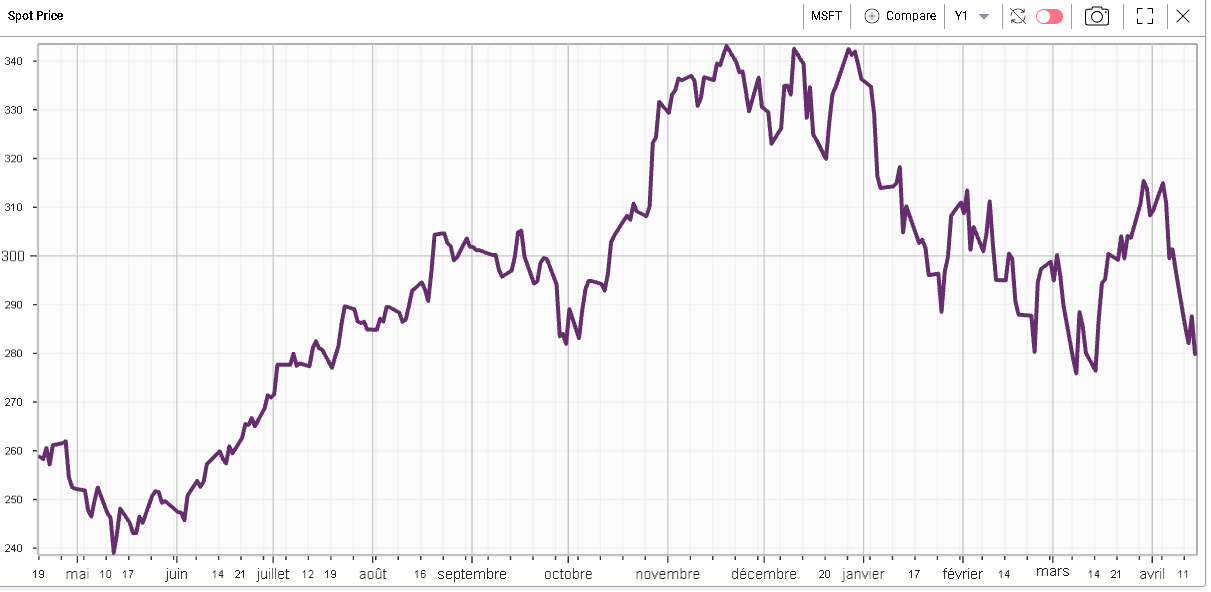
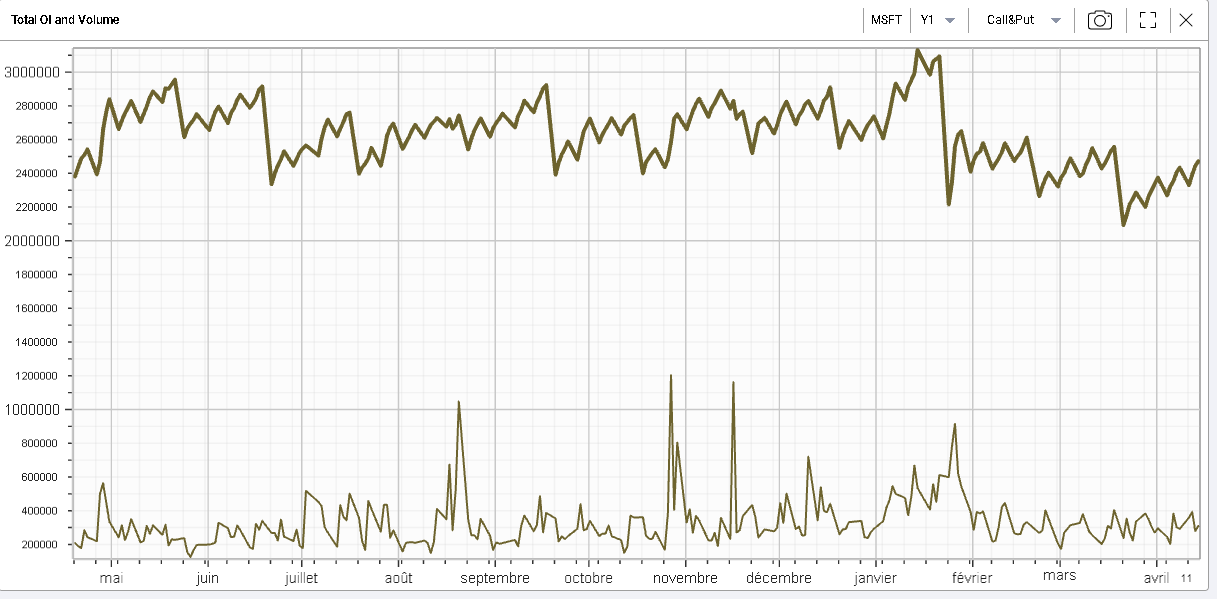
On the other hand of the spectrum, tech companies struggle with AAPL finishing 3% lower and MSFT finishing 2.7% lower. MSFT is now down around 17% for the year while AAPL is about 9% lower. |
Microsoft last 12m Spot Price |
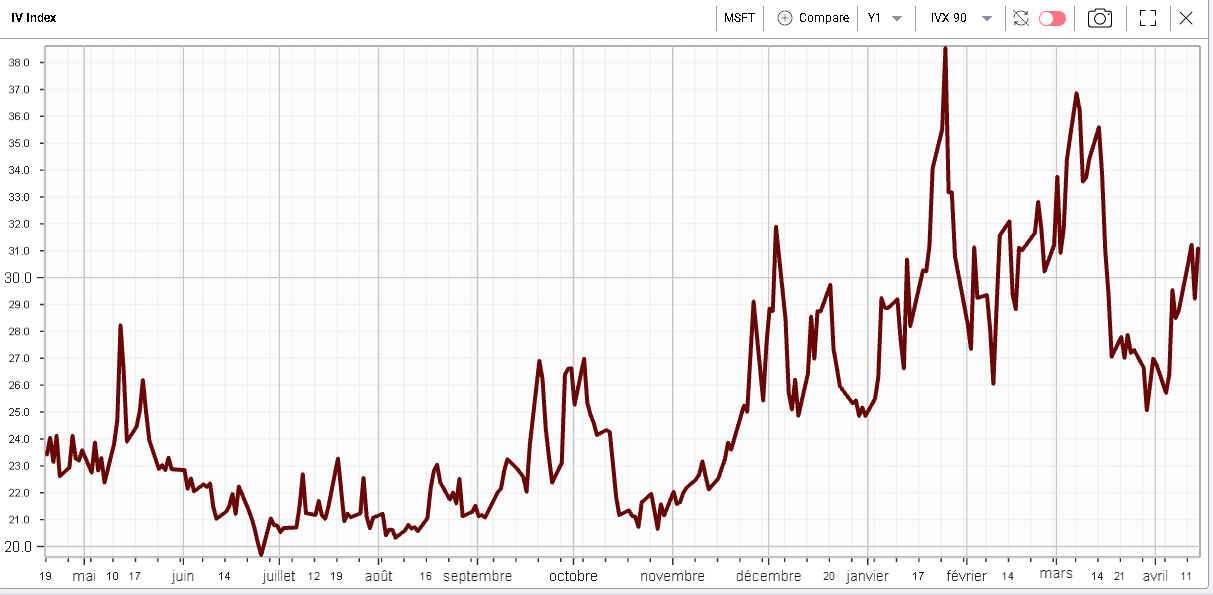
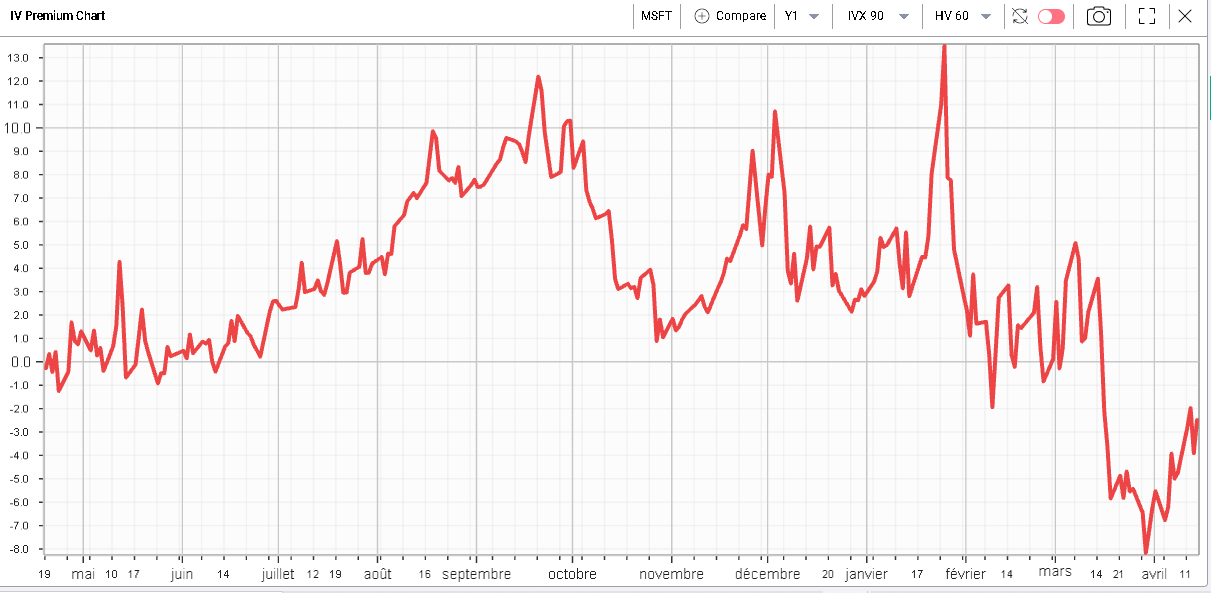
90d IVX in MSFT continues to trade higher but not fast enough to keep up with realized volatility. This is pushing the IVX Premium to remain negative. |
MSFT last 12m – 90d IVX |
MSFT last 12m – 90/60d IVX Premium |
It is quite interesting to note the lack of increased action in option space in the name on the back of the poor performance both on Thursday and in 2022 overall. The chart below shows how the cumulative open interest in MSFT has been drifting lower for the past 12 months in MSFT. |
|
Disclaimer - This information is provided for general information and marketing purposes only. The content of the presentation does not constitute investment advice or a recommendation. IVolatility.com and its partners do not guarantee that this information is error free. The data shown in this presentation are not necessarily real time data. IVolatility.com and its partners will not be liable for any loss or damage, including without limitation, any loss of profit, which may arise directly or indirectly from the use or reliance on the information. When trading, you should consider whether you can afford to take the high risk of losing your money. You should not make decisions that are only based on the information provided in this video. Please be aware that information and research based on historical data or performance do not guarantee future performance or results. Past performance is not necessarily indicative of future results, and any person acting on this information does so entirely at their own risk. |