Are European stocks now safer? |
Stocks sold off driven by Tech names which dropped the most while defensives continued to play their role. At the end of the day, the NDX was down 2.2%, the SPX 0.8% lower and the DJIA finished 0.15% higher on the day. |
At the sector level, Financials held their ground and did not participate in the drop which was led by Communications stock (SNAP -43%, FB -7.6%, GOOG -5%) and Discretionary (AMZN -3.2%, TSLA -7%). The tech space was the third driver of this selloff with AAPL -2% and V -2.4%. |
Most notable moves within the DJIA were: |
|
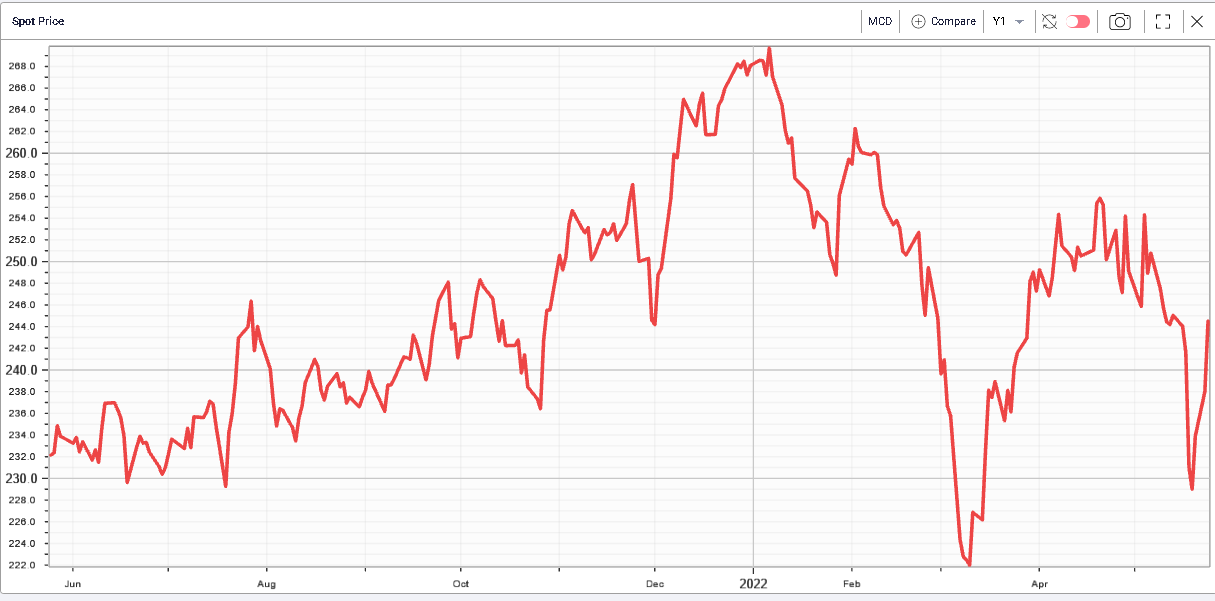
MCD 12 months spot price
|
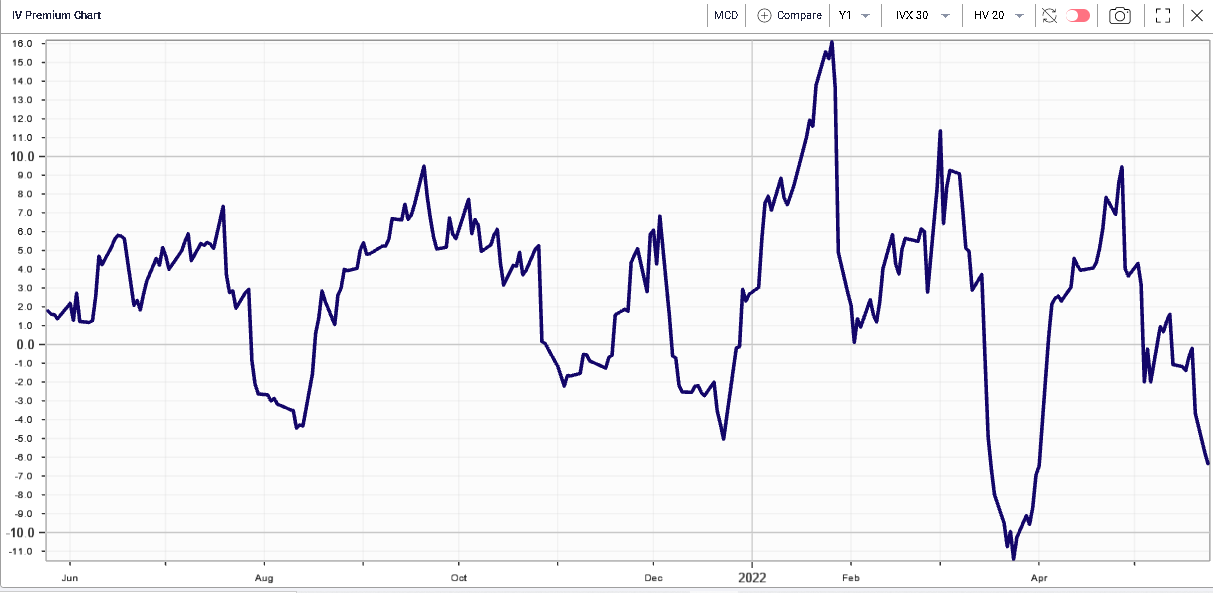
MCD 12 months history for 30d/20d IV Premium |
|
|
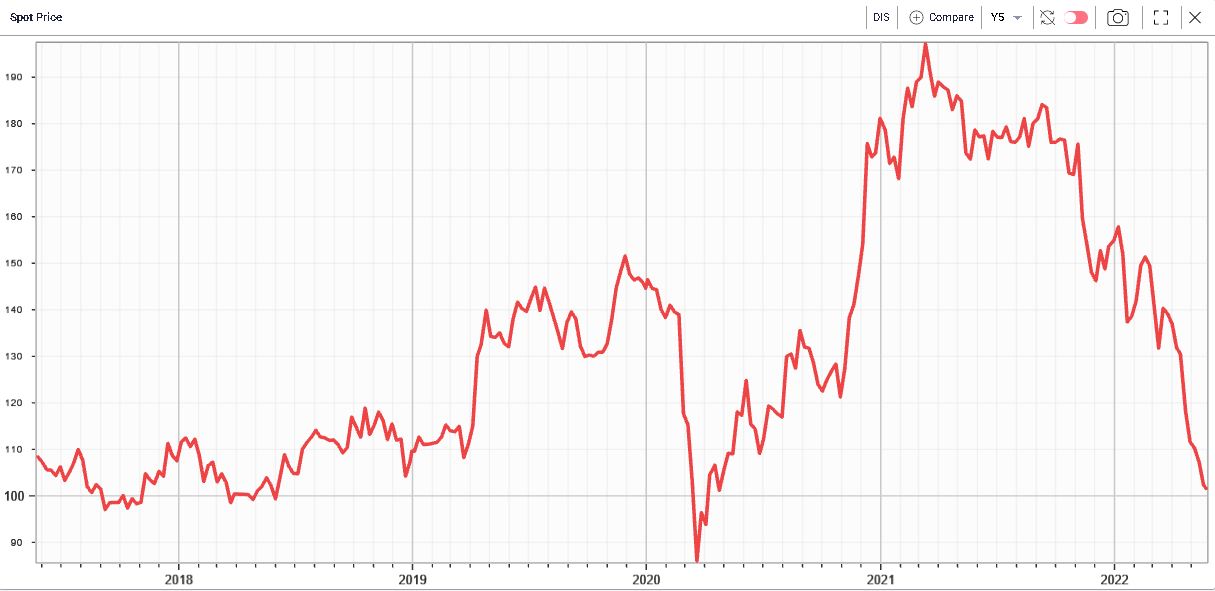
5-years spot price for DIS |
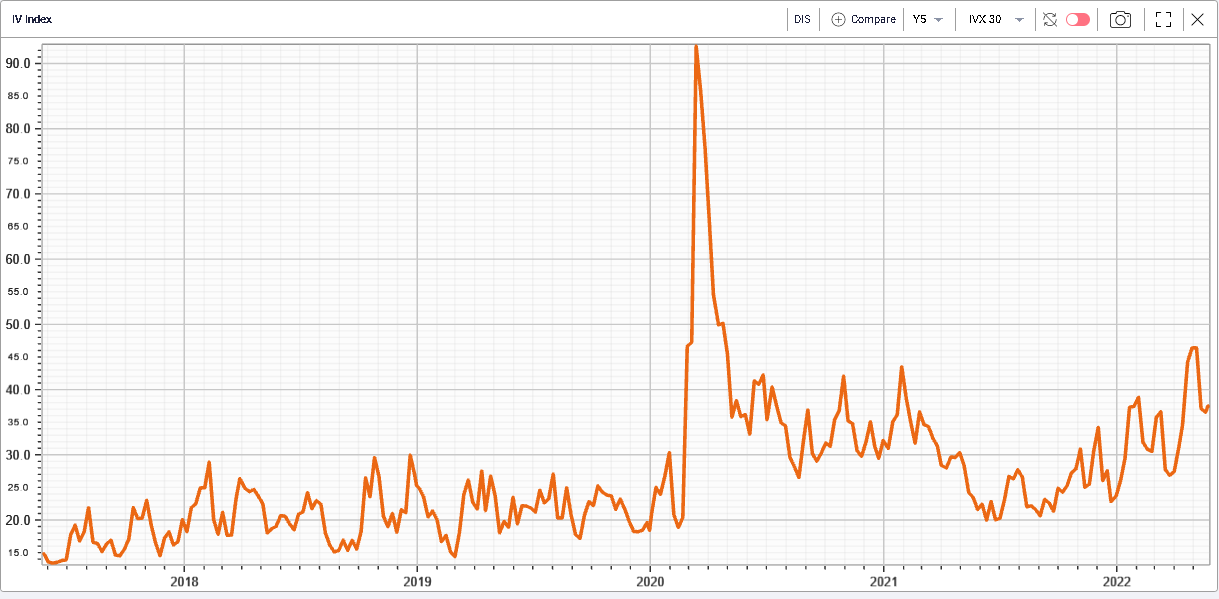
5 years of 30d IVX for DIS |
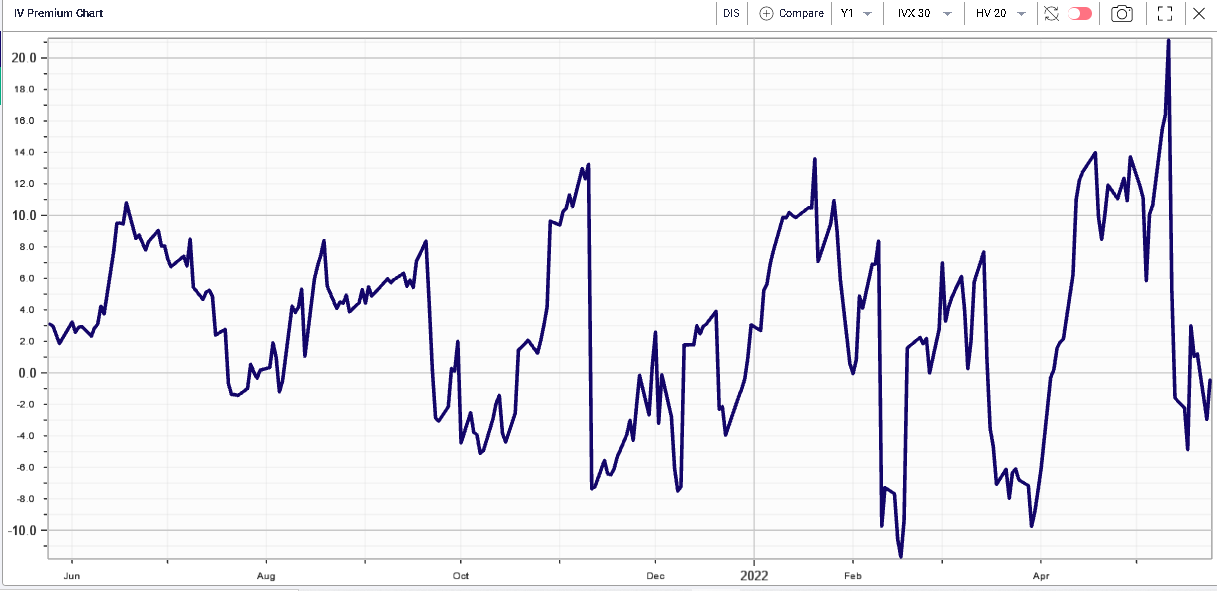
1 year of IV Premium 30d/20d for DIS |
|
|
Over in Europe, the resilience of the market has been the key theme since the geopolitical tensions increased. After a little lull when it seemed that ECB participants were not convinced about the inflation risks, it seems that they are now rallying behind the hawks and the overall rhetoric has turned more hawkish. This has taken the EUR/USD back towards 1.07 providing some respite to FX traders. |
European equities have outperformed their US counterparts significantly over the past month with the German DAX essentially unchanged while the SPX has shed more than 8%. On the year, the German DAX is now 12.8% lower while the SPX has lost almost 18%. |
The French CAC has trailed is German counterpart and is around 2.8% lower over the last month and 13% lower on the year. |
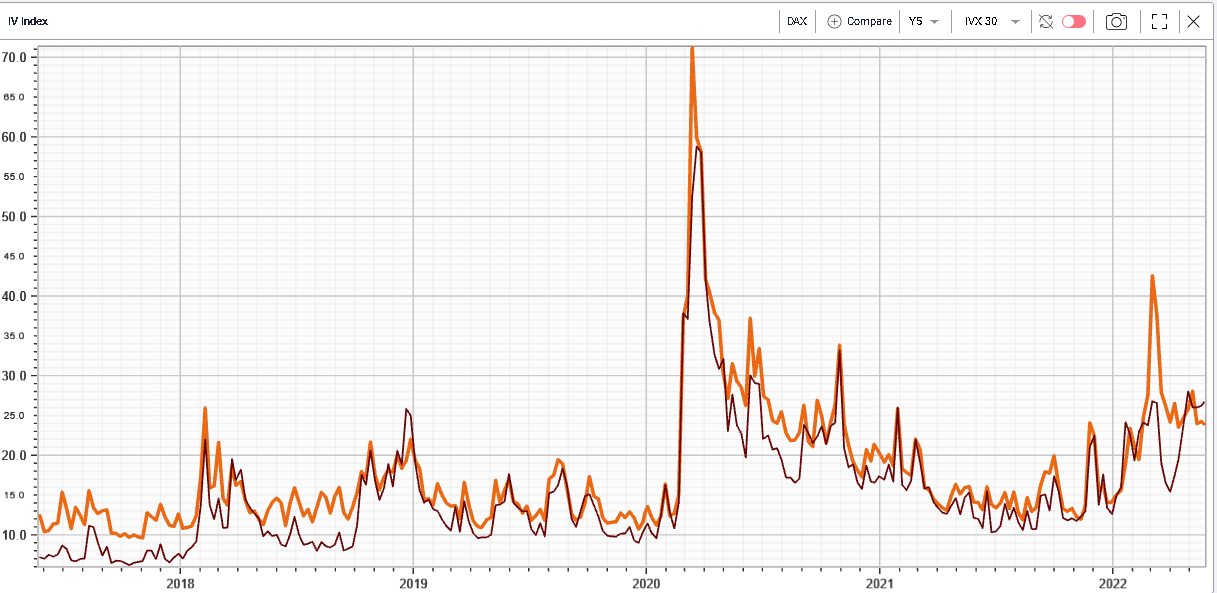
As a result of this difference, we have now seen implied volatilities between the SPX and the German DAX invert, a rare phenomenon as shown on the below chart displaying the 30d IVX for the DAX in orange and the SPX in red. |
|
In the vast majority of cases, DAX implied volatility trades at a premium to that of the SPX but the current market conditions make options traders willing to pay more for options on the SPX than on the DAX. |
This is also particularly interesting following the large disconnect at the end of February, beginning of March as Eastern Europe geopolitics tensions pushed European implied volatilities higher while US volatilities remained under control. |
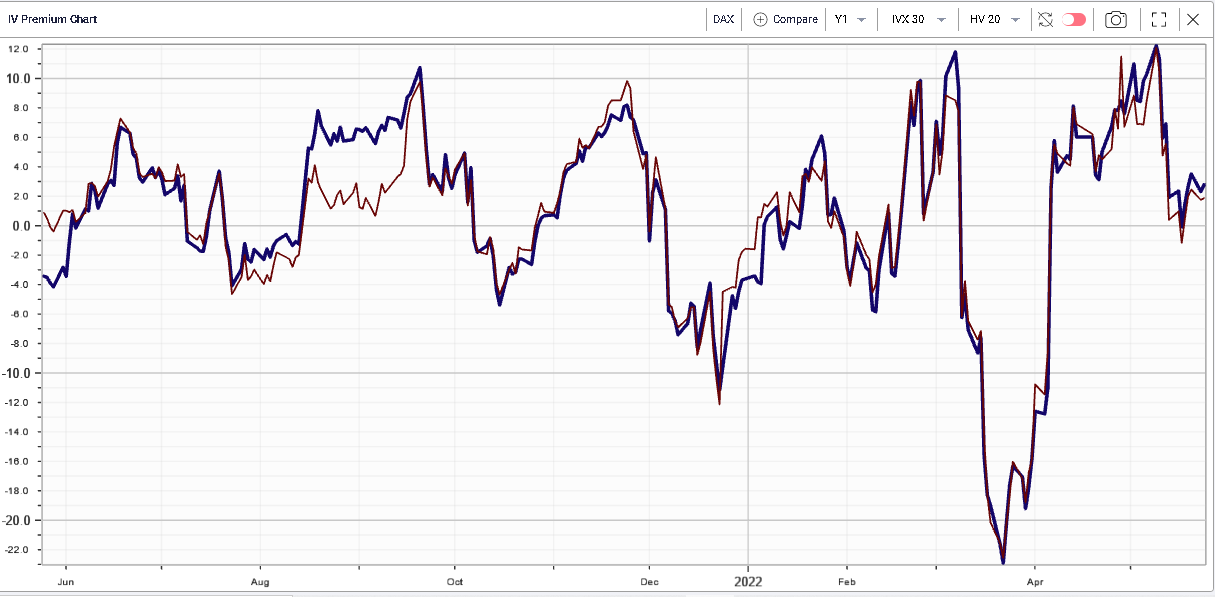
This does not necessarily mean that European implied volatilities now look cheap in absolute terms. Looking at one of our favorite measures, the 30d/20d IV Premium, we can see that DAX (blue below) implied volatility and CAC (red below) implied volatility both trade at a 3 points premium to their realized volatilities. |
|
Looking over the last 12 months, the current levels do not particularly stand out as being cheap or expensive, they seem average. |
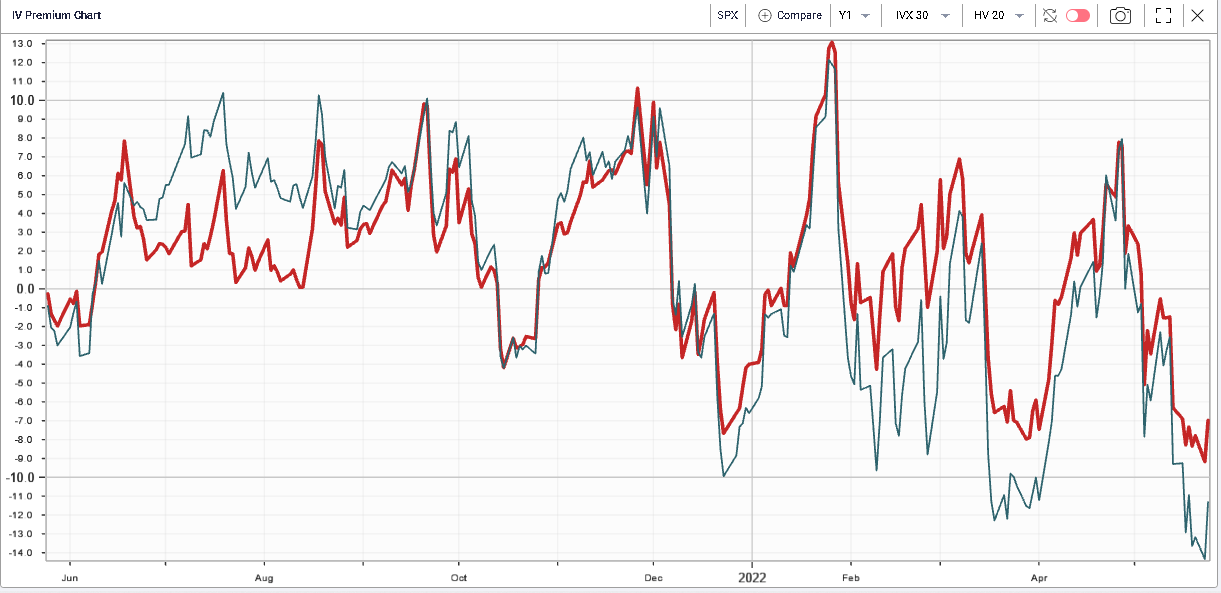
On the other hand, looking at the IV Premium for US indices we can see that they tend to look relatively low historically. We show below the 30d/20d IV Premium for the SPX in red and the NDX in blue. |
|
This creates a difficult situation for market makers where, on the one hand, they might be tempted to sell US implied volatilities against European volatilities as since the 2008-2009 crisis, Europe has mostly been perceived as riskier than the US while on the other hand, this spread screens relatively poorly when measured against realized. This also helps us understand that the current unwinding we are seeing is both US centric and unusually violent compared to what we have witnessed over the past decade. |
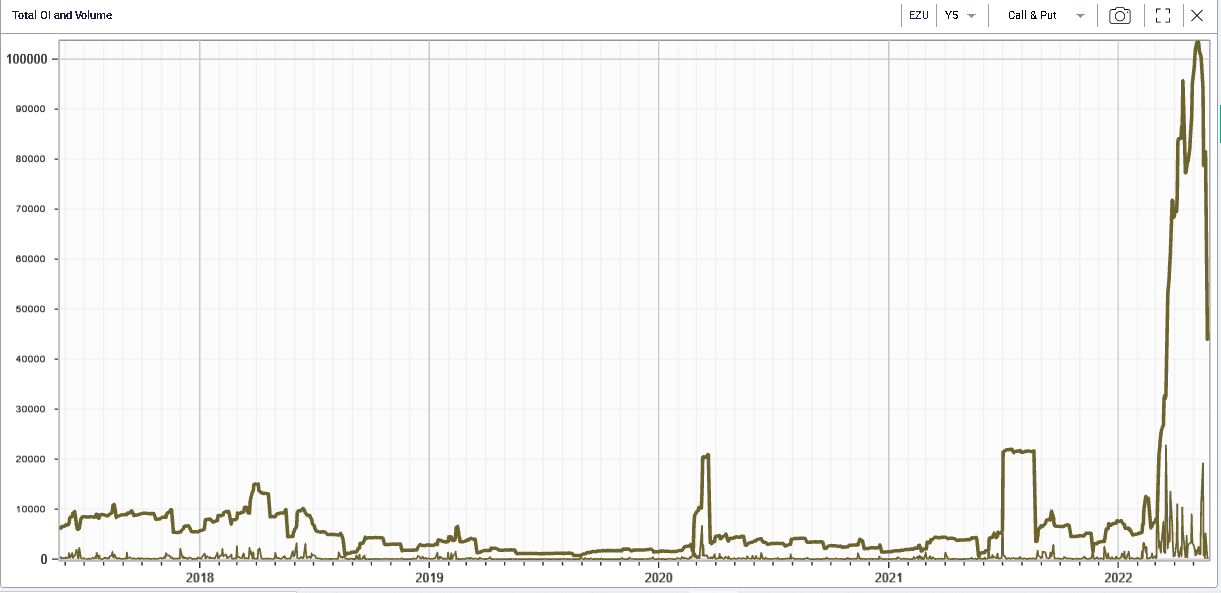
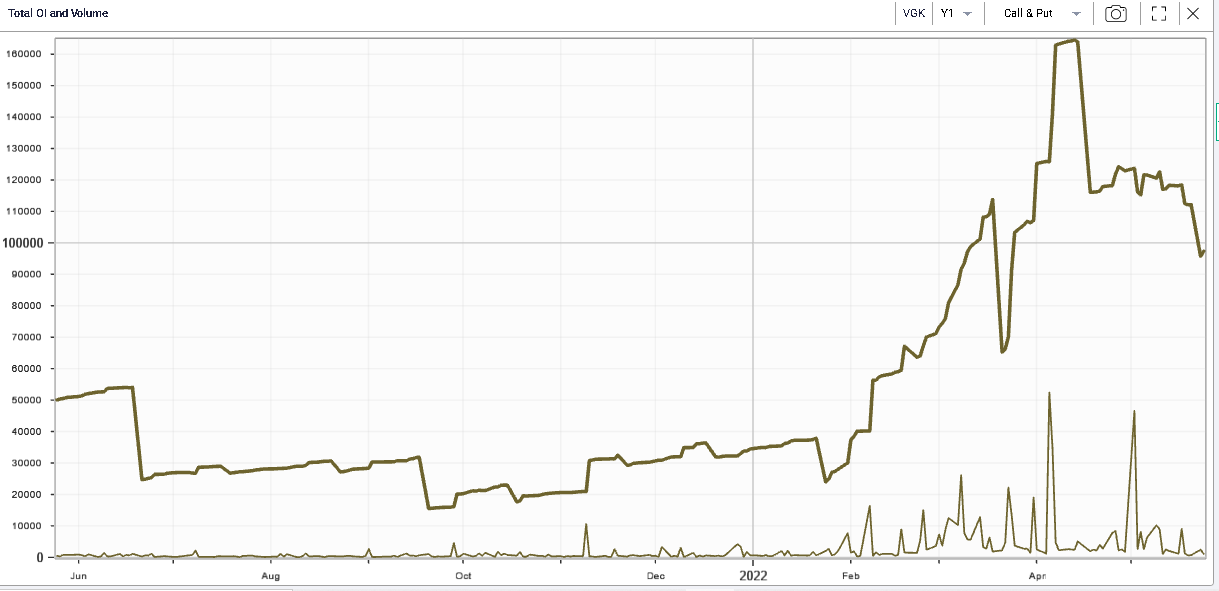
Interestingly, the focus on European equities seems to have increased if judged by looking at the open interest and volumes of calls and puts traded on the largest European ETFs in the US. Below we show the 12 months history for Put + Call OI and Volume for some of those names. We can see the pickup in activity throughout April and a drop going into Friday’s expiration. It will be interesting to see if other the next few weeks those positions are being rebuilt. |
|
|
Disclaimer - This information is provided for general information and marketing purposes only. The content of the presentation does not constitute investment advice or a recommendation. IVolatility.com and its partners do not guarantee that this information is error free. The data shown in this presentation are not necessarily real time data. IVolatility.com and its partners will not be liable for any loss or damage, including without limitation, any loss of profit, which may arise directly or indirectly from the use or reliance on the information. When trading, you should consider whether you can afford to take the high risk of losing your money. You should not make decisions that are only based on the information provided in this video. Please be aware that information and research based on historical data or performance do not guarantee future performance or results. Past performance is not necessarily indicative of future results, and any person acting on this information does so entirely at their own risk. |