Quickly locating volatility divergences
July 13, 2022
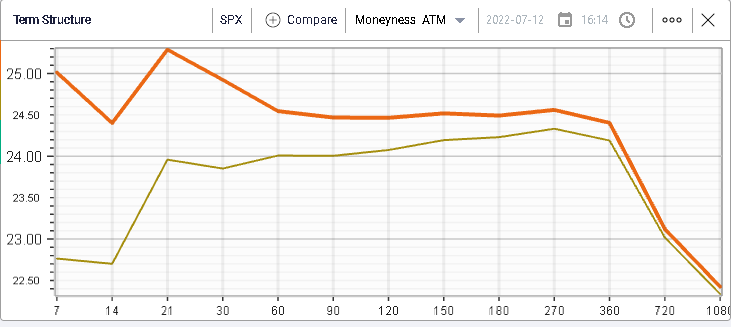
European indices managed to close in the green yesterday but a late selloff pushed US indices back in the red. The SPX and the NDX close around 1% lower while the DJIA finished around -0.6%. Unsurprisingly implied volatilities remarked higher as show on the below Term Structure chart for the SPX.
In today’s market update, we will look at the IV premium for the components of the DJIA. The below table is extracted from the Stock Monitor in IVolLive and shows the 30d IVX, our proprietary estimate of implied volatility over the next 30 calendar days, the 20d HV, a simple realized volatility measure and the ratio of the 30d IVX over the 20d HV.
The lower the ratio, the lower the implied volatility is relative to the most recent realized observation.
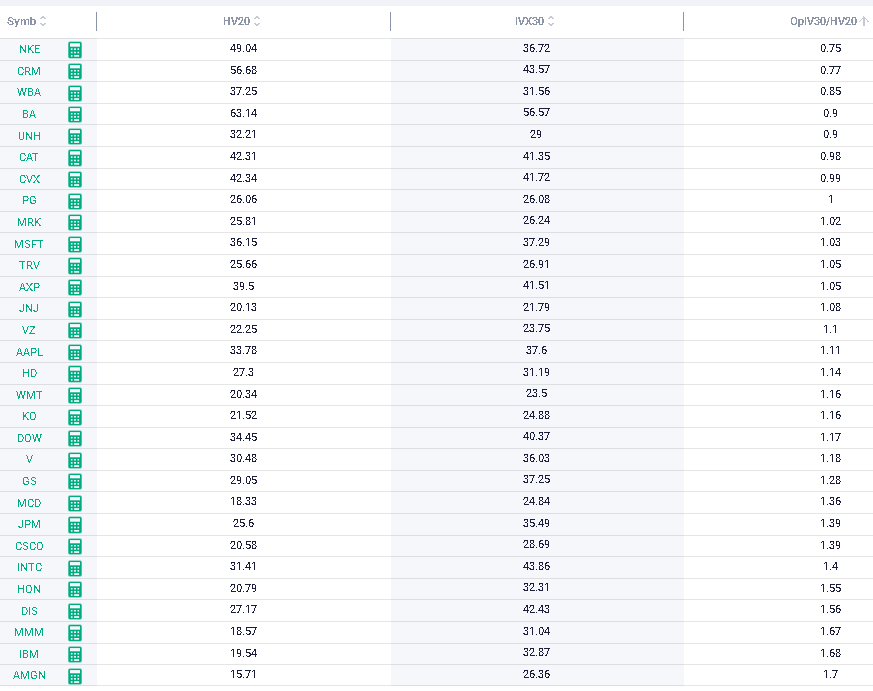
We can see that NKE seems to offer to largest relative discount of all the components of the DJIA. Using the Charts service, we are able to retrieve the historical series for the IVX 30 – HV20 spread over long time periods. We display below 5 years of information for NKE.
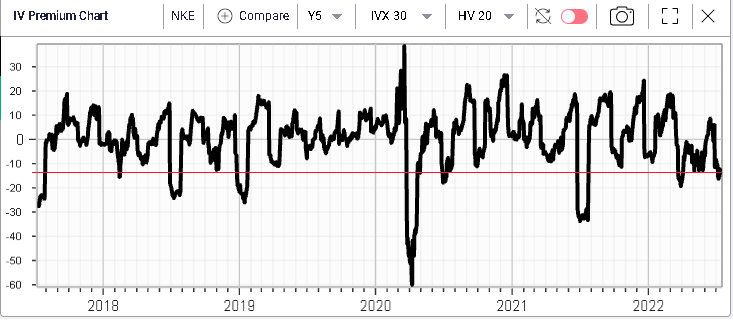
The above chart is highly cyclical almost sinusoidal with the length of waves varying through time. The red line is simply a horizontal line drawn over the chart to approximate the position of the latest observed value against history.
In this particular example, even accounting for the regularity in the waves observed it does look like the current position is relatively low.
Furthermore, when compared with the other components of the DJIA, we can see that NKE screens as the stock having the lowest 30d IVX relative to its 20d HV.
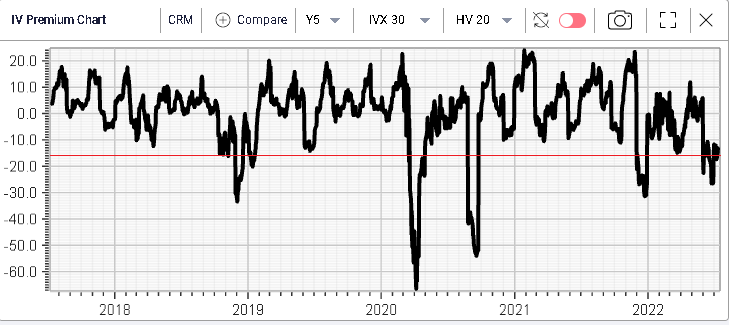
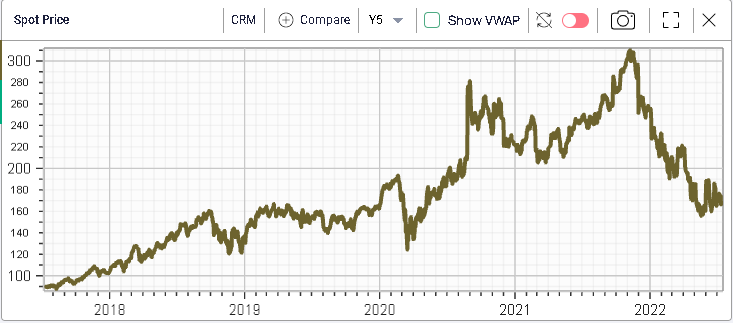
The same observation can be made on CRM for instance.
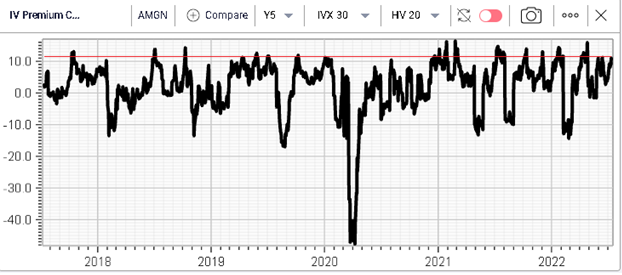
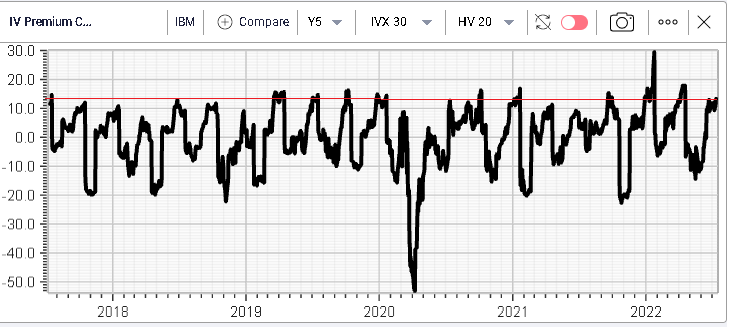
On the other hand of the spectrum, names like AMGN or IBM see a 30d IVX that looks elevated relative to the 20d HV observed in the stock.
Yesterday, 3 stocks really stood out in the market. First on the upside BA gained 7.4% against a market that finished slightly lower. According to press reports, the company reported that deliveries reached their highest level since March 2019. The stock has so far this year managed to hold its March 2020 lows but is still down 29% in 2022.
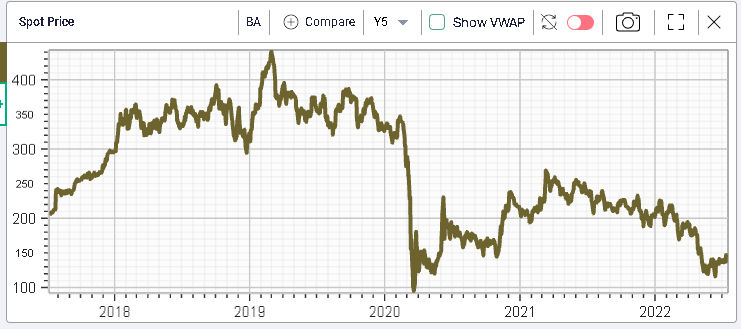
From a volatility perspective, implied volatility has been creeping higher but in a fairly slow and methodical manner.
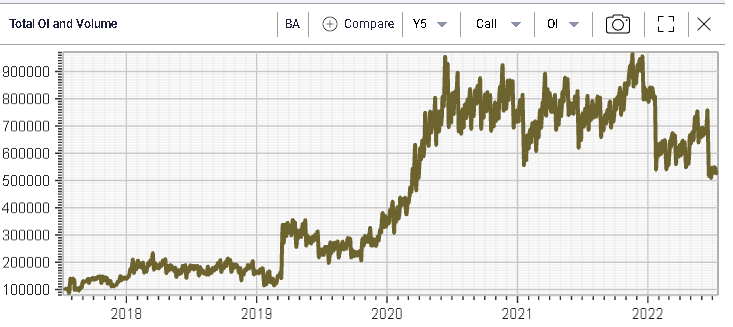
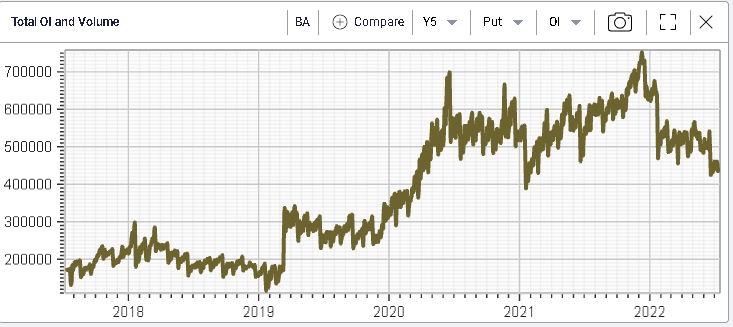
On the flow side, traders do not seem particularly focused on the name with Call open interest reaching its lowest level in 2 years and put open interest failing to gain any momentum as well.
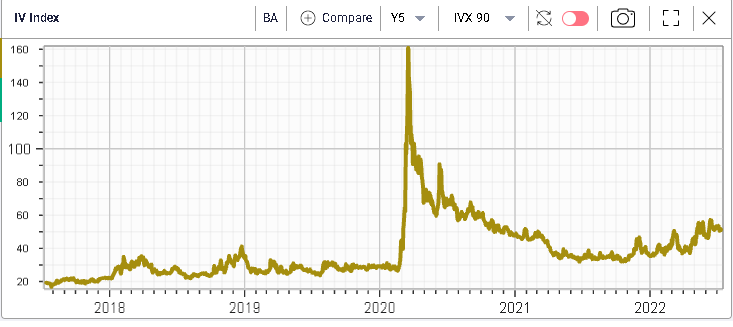
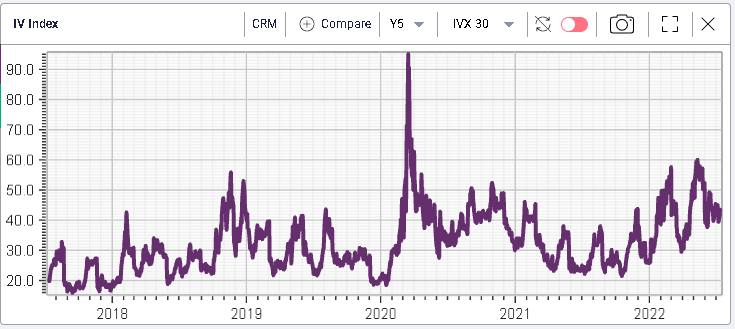
The second name worth mentioning was CRM which dropped 4.6% on the day and is now around 35% lower on the year. As for BA, the stock is trading around its 2020 levels and the implied volatility has remained fairly quiet for now.
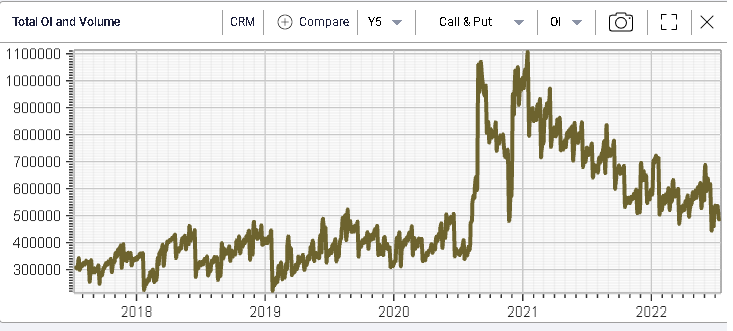
The combined Call and Put open interests in the name have been dropping throughout the year.
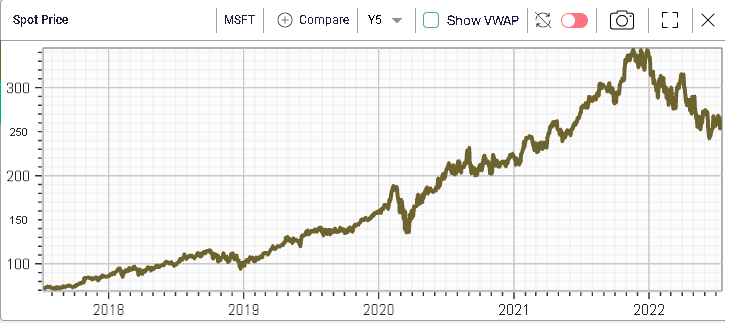
Finally, MSFT underperformed and settled around 4% lower. Media reports indicate that the company is reducing its workforce which may be hitting sentiment. MSFT is down around 25% on the year.