Sector rotation and BA IV moving higher
August 31, 2022
Headline indices continued to drift lower yesterday with SPX and NDX both lower by around 1.1% and the DJIA down around 1%. The reversal in Crude Oil prices yesterday was a key theme with USO losing around 4.1% over the session taking Energy Equities 3.4% lower on the day.
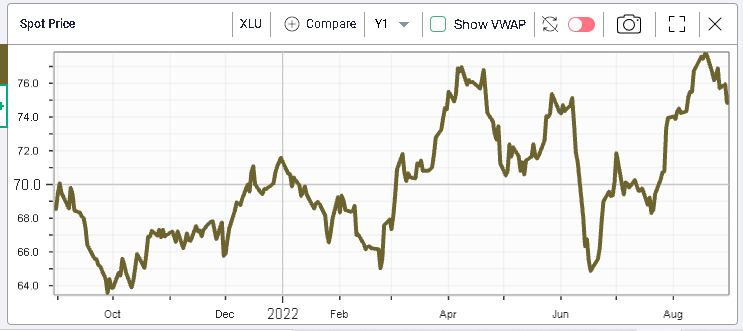
Interestingly, the safer segments of the market were the ones that struggled most over yesterday’s session. For instance, the Utilities space which is the second-best performing sector for the year with a gain of around 5.6% was amongst the biggest loser yesterday dropping around 1.5%.
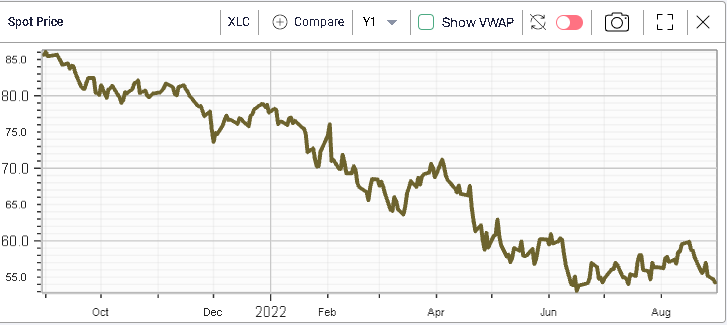
On the other hand, the Communications sector which is the worst performing segment for the year in the US (losing more than 30% at time of writing) settled lower by 0.9% yesterday.
Keeping track of possible sector rotations can be very useful to identify emerging themes early in the market.
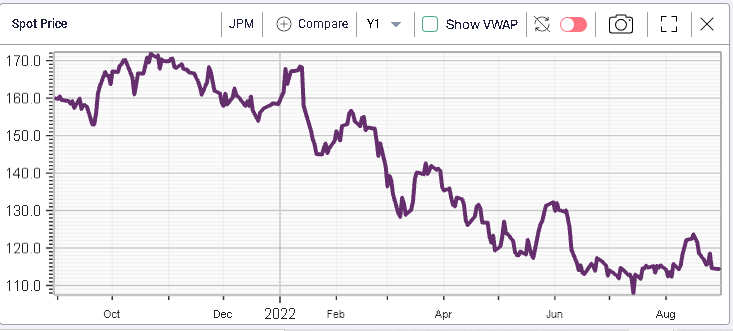
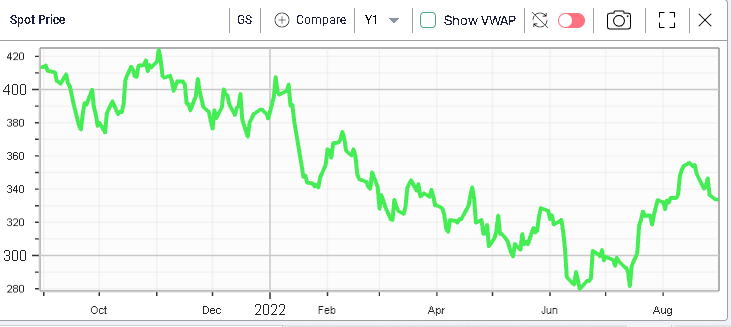
Banks also had a solid day yesterday despite displaying a fairly weak performance so far in 2022. For instance, JPM and GS were both unchanged over the session while the former has lost around 30% in 2022 and the latter dropped 15.6%.
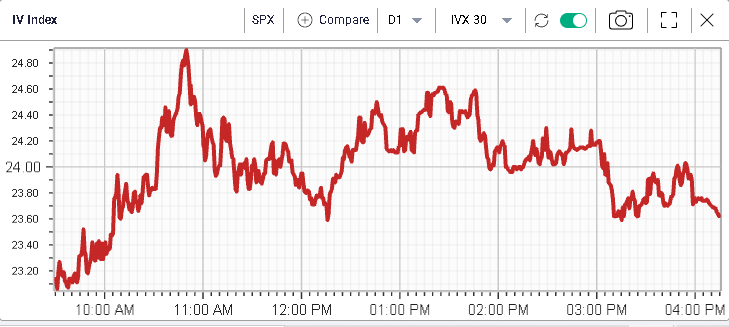
Implied volatilities seemed to lag spot over yesterday’s session both for the NDX and the SPX with 30d IVX gaining a mere 0.25% over the day.

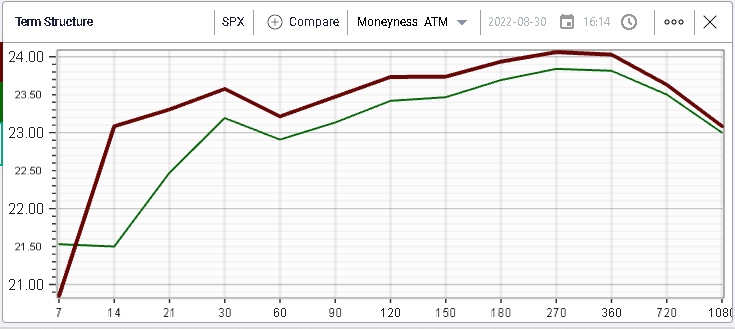
Looking at the term structure, we can see that the implied volatility by expiration moved slightly higher over the session with short 14 and 21 days options seeing the biggest remark.
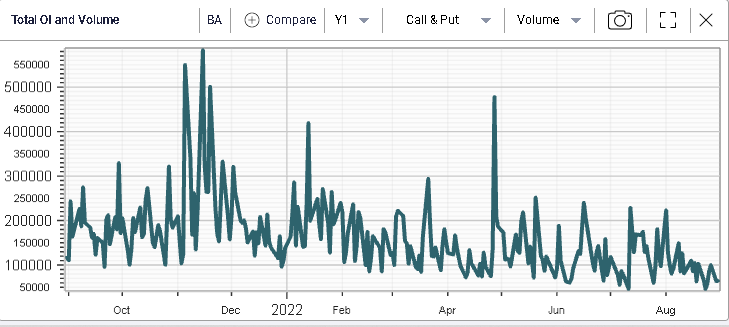
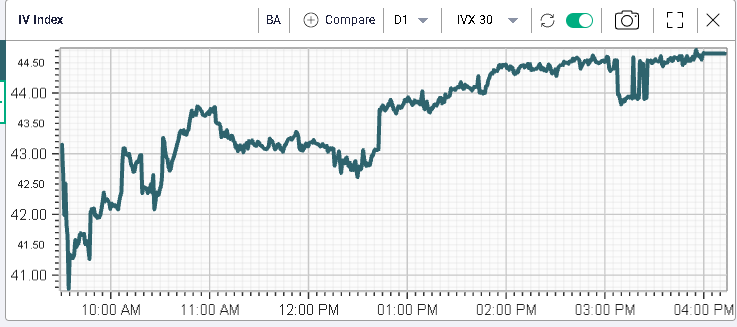
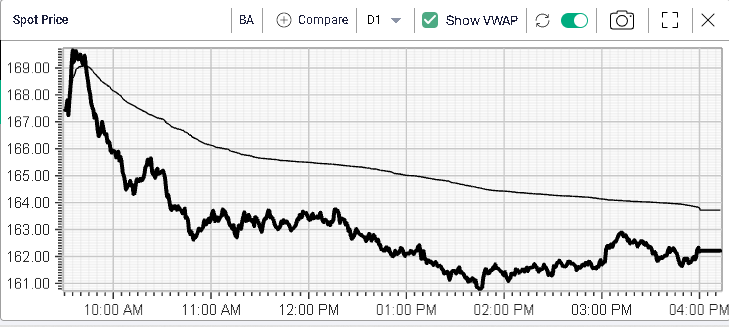
At the single stock level, implied volatility in BA moved higher by almost 3 points over the session.
The stock was under pressure over the session trading below VWAP throughout the day and finishing around 2% lower on the day.
Looking at volumes below, we can see that those were lower than usual across both calls and puts so the remark was not driven by flows.