Short dated IVs lag, long dated IVs outperform
September 5, 2022
Friday was another day where intraday activity was intense but the overall performance judged as the bell rang was disappointing from a volatility perspective. The SPX and the DJIA finished the day 1.07% while the NDX closed 1.44% lower.
Markets initially reacted positively to the unemployment figures in the US showing an increase of 315k jobs and a slight uptick in the unemployment rate. The narrative was simply that the FED’s attempt to cool the economy may not need to be as powerful as thought if the economy was already slowing down. An extra positive piece of news came around the European close when traders were told that the flow of gas from Russia was expected to resume on Saturday.
It was only later in the middle of the US session that Gazprom indicated that the flow of gas would be cut to Europe indefinitely. Traders quickly got worried that a shortfall of energy in the winter could have dramatic consequences for the European economy and increase the risk of a recession.
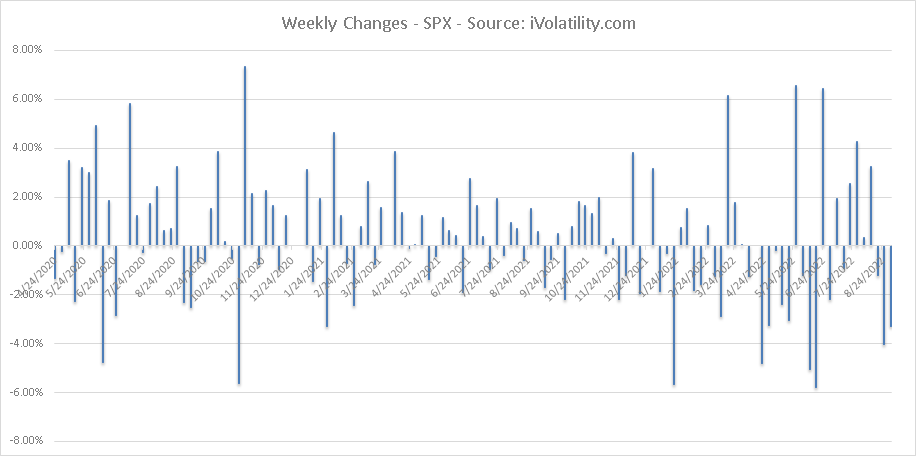
Those large intraday moves definitely favor day traders compared with those that hold for the day. Holding over longer periods of time seems to have done slightly better as shown on the below weekly change chart.
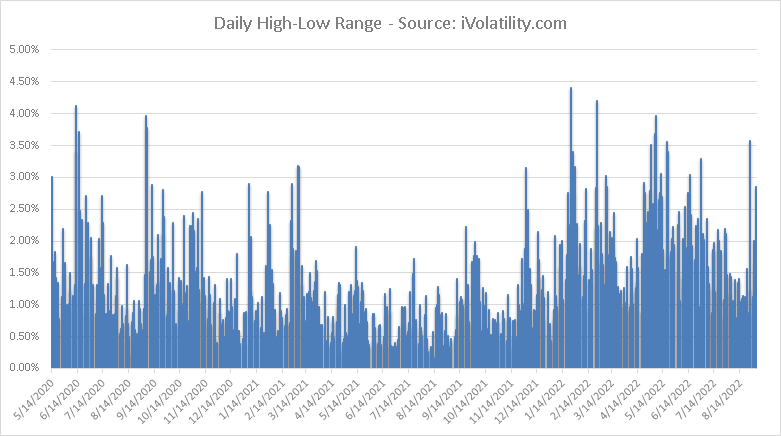
The below shows the daily High-Low range for the SPX, which has picked up meaningfully over the past few days.
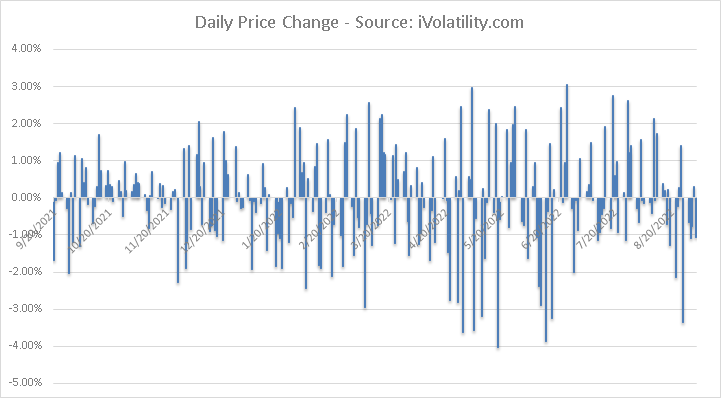
At the same time, daily price changes have remained fairly subdued (outside of Friday 26th selloff).
Looking at the daily chart of ES, this week saw the first close below the 50 days moving average since the middle of July’22.

Source: Tradingview.com
Looking at the hourly chart, the downtrend is visible with bouts of increase and localized volatility followed by periods of sideways trading.

Source: Tradingview.com
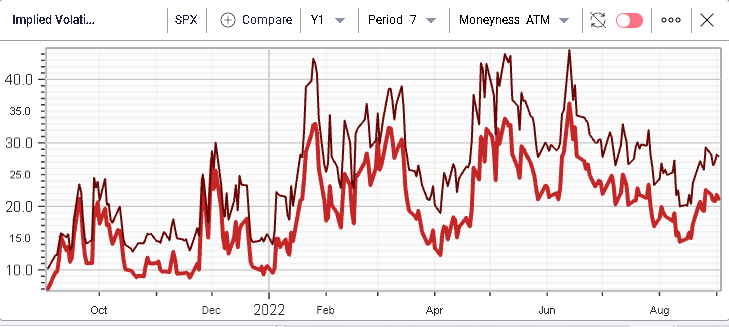
The term structure chart below shows that IV has gone higher very slowly during this selloff. Despite a more than 3% drop over the past week, 30d IVX has moved higher by less than 1 point.
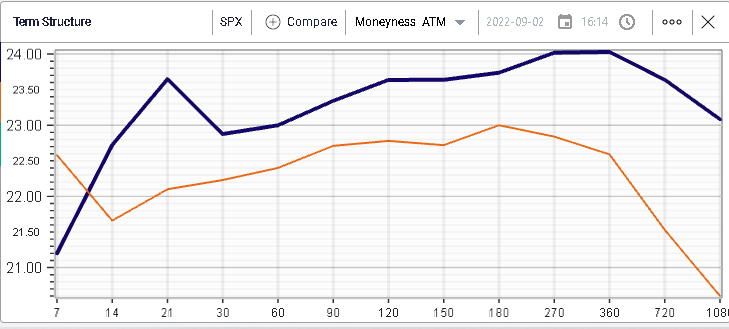
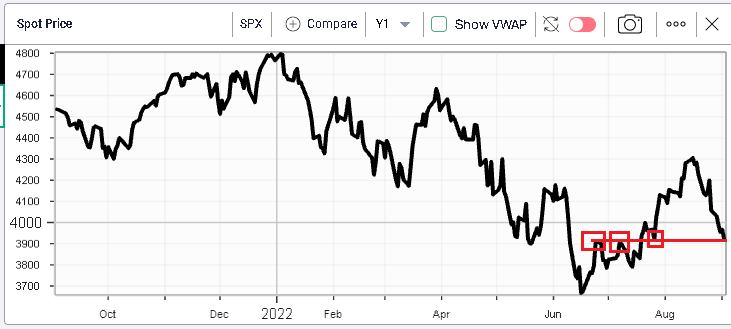
Looking at spot prices, we highlight below the last three times the market was around Friday’s closing price of 3925: 26th Jul’22 - 7th Jul’22 and the 24th Jun’22.
Looking at the term structure, we can see that for both the 24th Jun and the 7th July, 30 days the implied volatility was around 1 point higher. On the 26th Jul’’2, the implied volatility was around 1 point lower than where it closed on Friday.
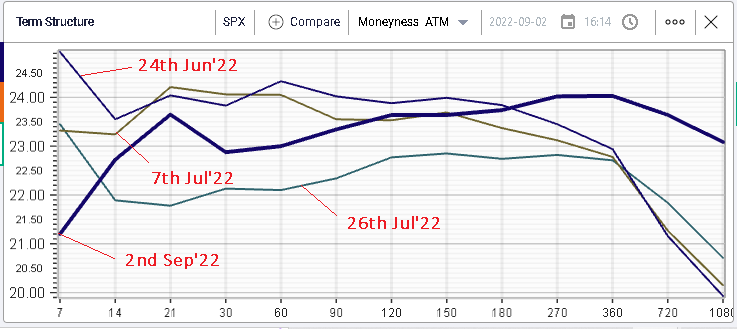
What may be more surprising is the very short dated options, in particular the 7 days options. Looking at the above, the 7-day IVX was around 21.25% on Friday. It was at 23.5% on the 7th Jul’22 and the 26th Jul’22 and at 25% on the 24th Jun’22.
The lag by very short-term implied volatilities is true both for the SPX and the NDX as shown in the below with the red line showing the 7-day implied volatility for the SPX and the brown one for the NDX.
The second interesting piece of information is the level of long-term implied volatility. Looking at 1-year implied volatility for example, we can see that it has increased significantly and was at 24% on Friday compared with levels around 1 point lower in prior occurrences.