Chinese stocks’ selloff shows no signs of abating.
October 17, 2022
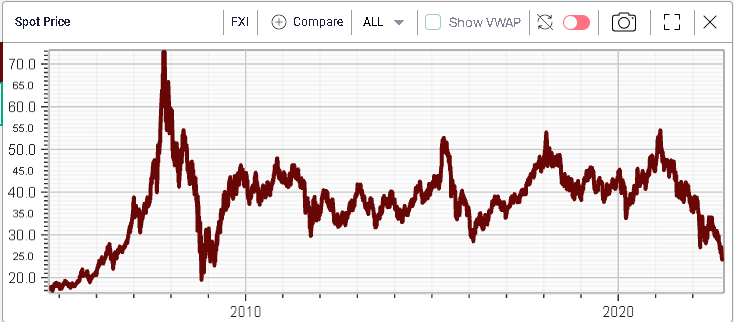
Major stock indices were under pressure last week with Chinese Equities seeing most of the pressure. The HSCEI lost almost 8% over the past 5 sessions and the FXI, an ETF tracking the FTSE China 50 has now lost around 34% in 2022.
The FXI is now trading at levels last seen during the global financial crisis. According to media reports, a lot of attention has been directed towards the Chinese tech sector which has been under pressure on changes of regulation in the US. Concerns around the potential for growth in China while the country continues to implement a very strict zero-Covid policy are also quite often cited by the press to explain the drift lower in shares in recent history.
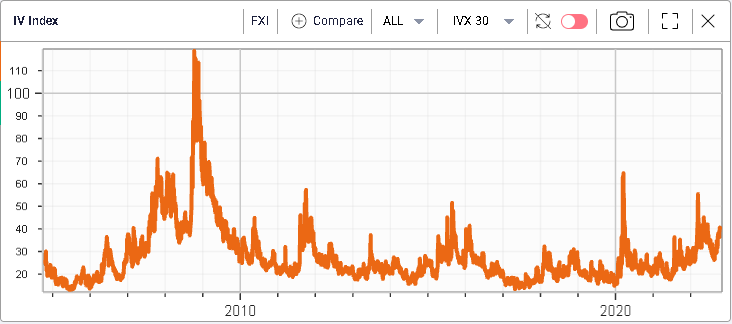
Looking at the implied volatility market, things do not seem to be perceived as being as worrying as spot prices indicate. On the below, we see a 30d IVX for FXI hovering around 40%, a long distance away from the peaks seen both in 2020 - 2015 and 2008.
The lack of reaction of implied volatility is best explained in the context of how realized volatility has been performing.
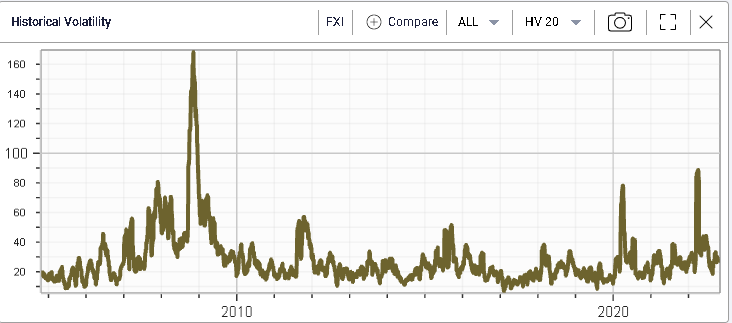
We can see on the above chart that realized volatility has remained very subdued in the current selloff. This creates a difficulty for options traders who will, on the one hand be concerned about the negative sentiment around the region but will have on the other hand to take into account the fact that historical volatility has remained below 30% for the past few months.
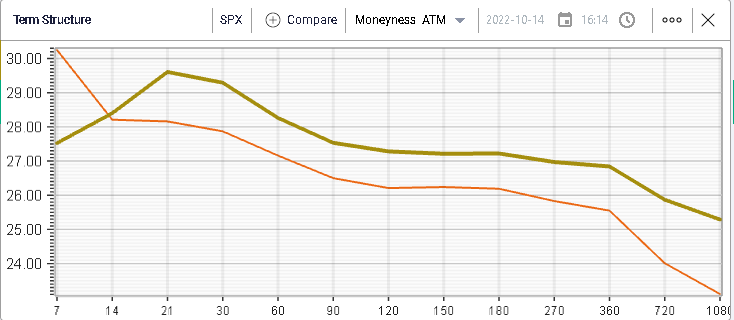
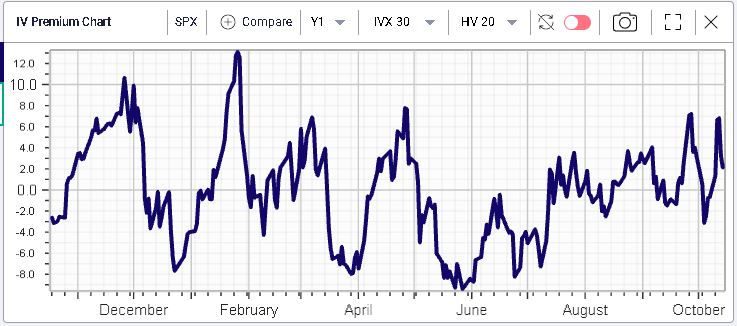
In fact, looking at the IV Premium chart that sums up the difference between implied volatility and realized volatility we can see that the difference is currently slightly higher than average historically.
Going back to US equity indices, we use the following daily chart on ES Futures from tradingview.com that displays the downtrend seen in 2022 alongside with the 200d MA that has been trading around the upper end of the channel for weeks.
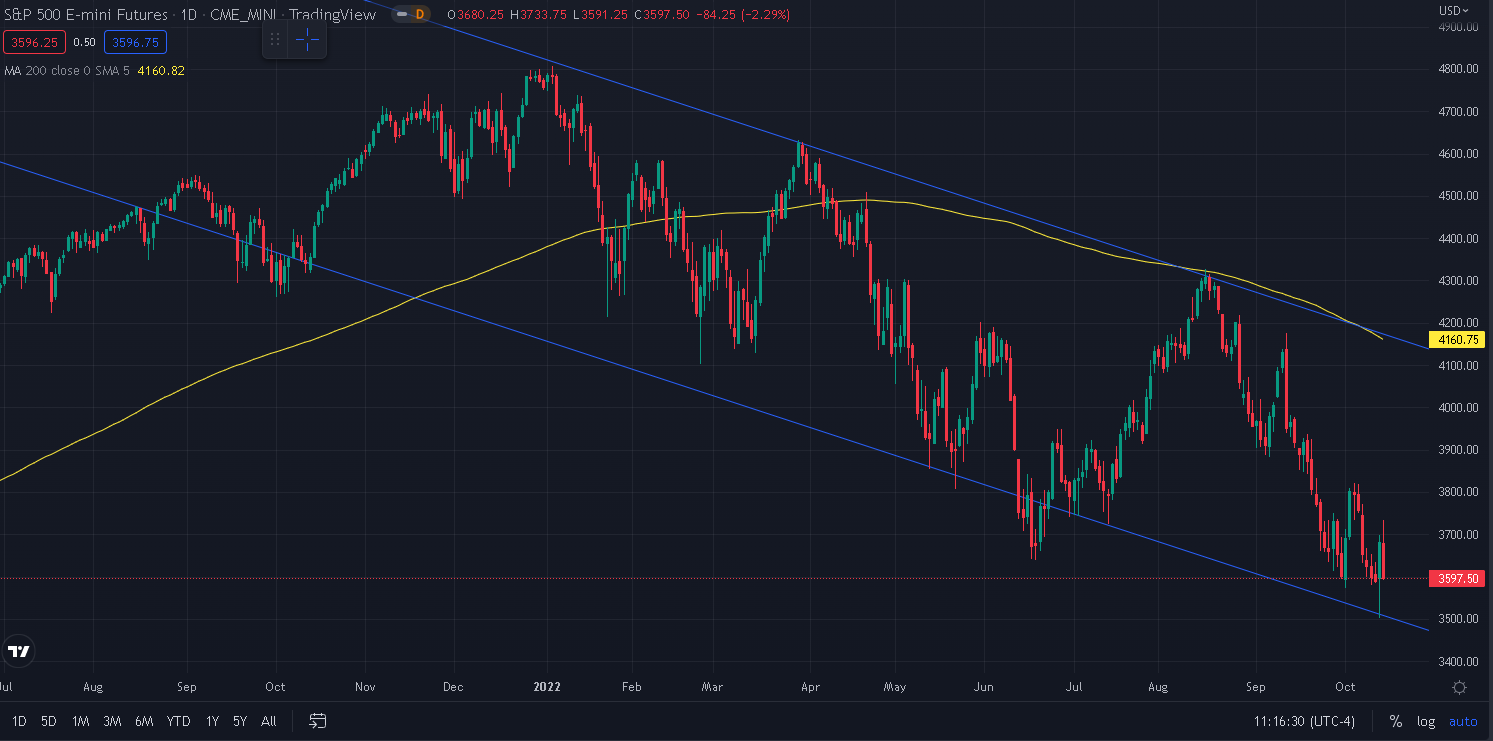
Source: Tradingview.com
This chart helps put Thursday’s bounce in context by showing how it has so far mostly been a technical bounce with key levels being respected in particular around 3500 which is the lower end of the downtrend.
Looking at the 5 minutes chart below, we can see how the trendline halted the selloff as bids appeared very quickly and absorbed all the supply that was created following the CPI numbers. The key intraday level/indicator for the week was in our opinion the trendline highlighted in green which could be used as a proxy to indicated which side had the upper hand.

Source: Tradingview.com
For most of the week, prices stayed below that line with bears seemingly in control but following the inflation number and the rally that followed, we saw bulls push prices above that level and maintaining for a short while. We finished fairly close to the level on Friday evening with multiple failed attempts from bulls to close above it.
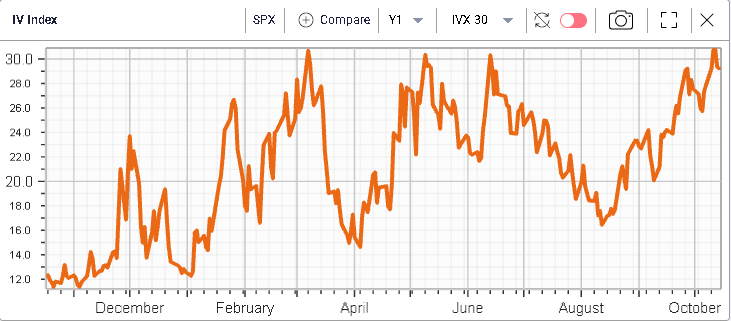
Despite all this action, SPX 30d IVX finished below 30 on Friday after pushing above on Tuesday while over the week, we see that implied volatilities have generally continued to move higher.