Earnings in focus
October 27, 2022
Yesterday saw a significant underperformance of the NDX which closed 2.26% lower while the SPX settled 0.74% lower and the DJIA was unchanged.
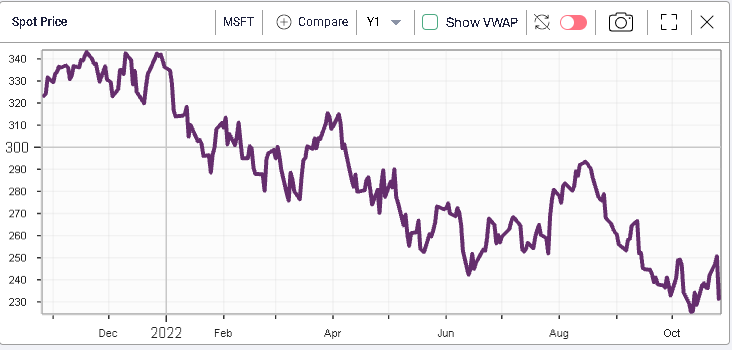
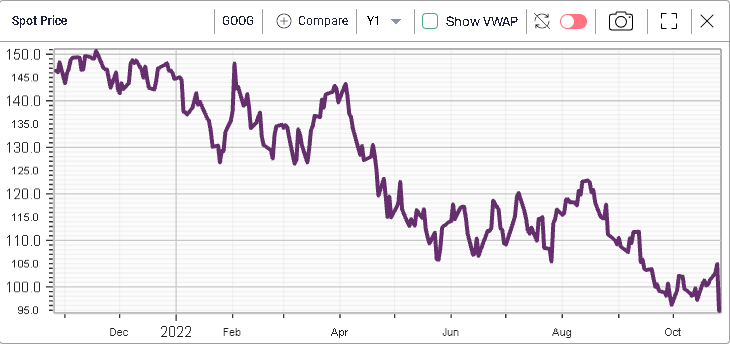
Tech stocks were under pressure following earnings releases by Microsoft and Alphabet which finished respectively 7.7% and 9.6% lower.
The fact that the DJIA and the SPX outperformed the NDX is testament of the performance of sectors outside of the Tech and Communications segments.
Communication Services stocks finished around 3% lower yesterday while Tech stock lost 2.2%. On the other hand, energy names continued to gain and finished 1.36% higher.
The healthcare segment also performed nicely gaining around 1.11% over the session.
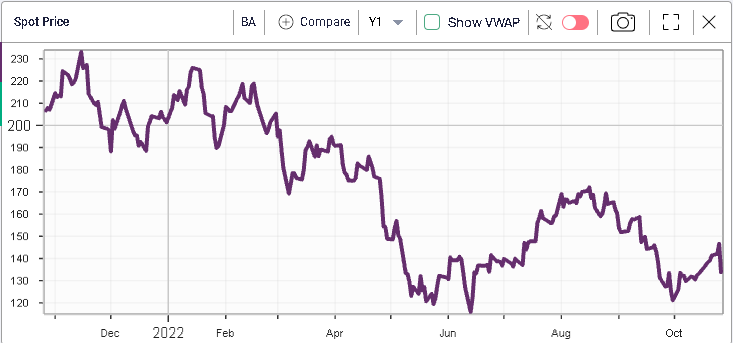
Looking at the DJIA components, we find that BA actually underperformed MSFT over the session losing 8.77% after reporting earnings. The stock has so far managed to hold its June lows just below $120.
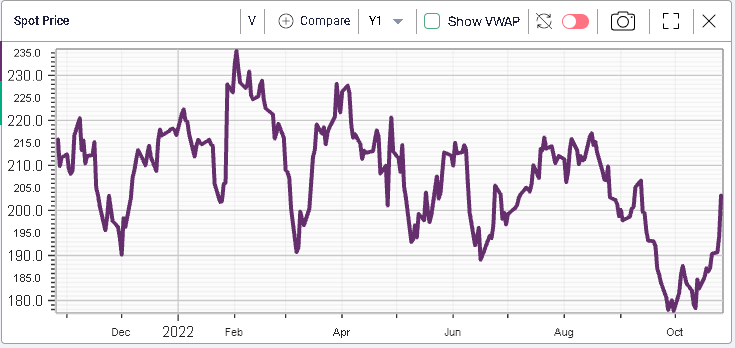
On the upside, V was a notable outperformer gaining 4.6% over the session.
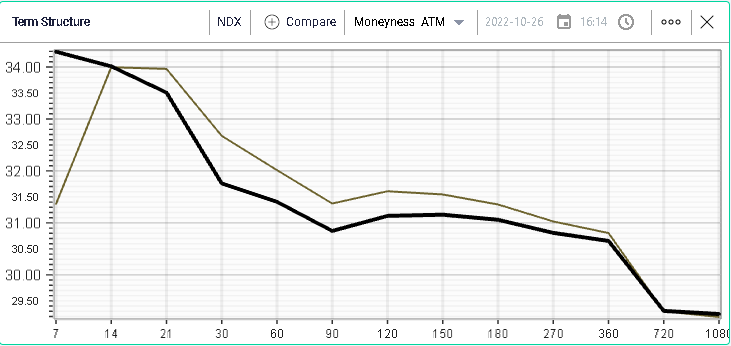
Looking at volatility, we can see on the below NDX term structure chart that short dated options remarked higher by around 3.5 points while longer dated volatilities remarked slightly lower over the session.
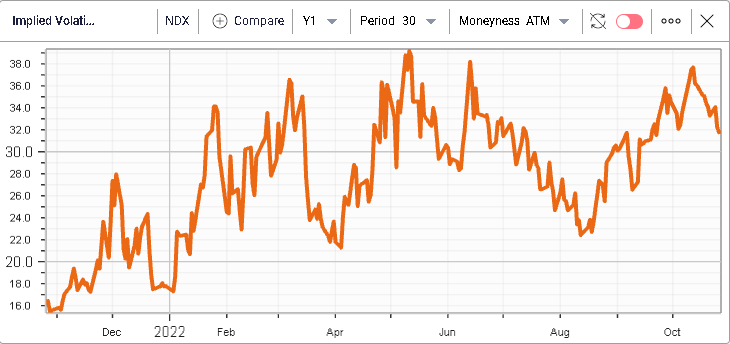
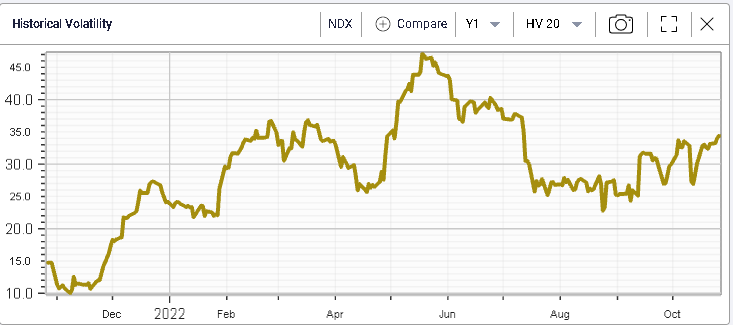
Implied volatility for the NDX have remained elevated historically when compared with the last 12 months but have generally drifted lower, despite realized volatilities continuing to move higher.
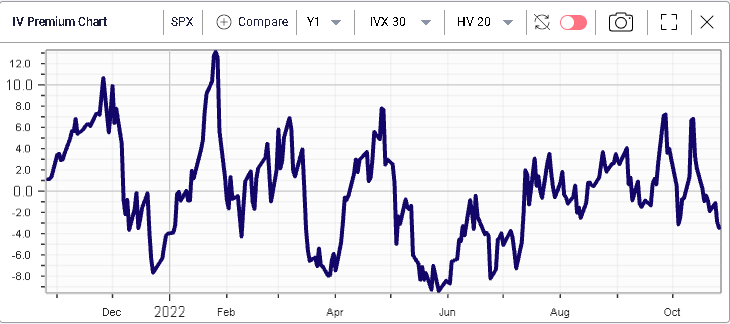
This has left the IV Premium drifting lower over the past few weeks and settling in negative territory around -2.7 points for the NDX.
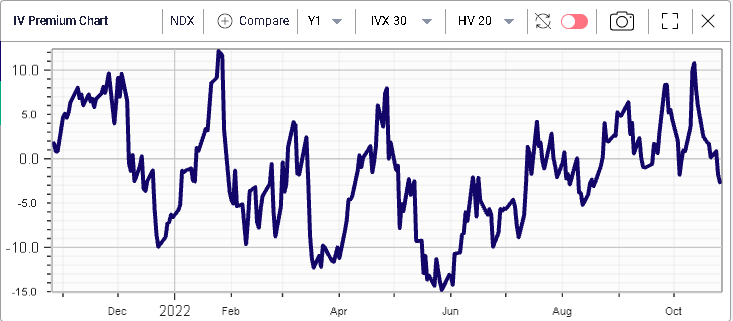
It is at -2.9 points for the SPX when measured by comparing the IVX30 with the HV20.
Overall, the market remains very much focused on stock specific stories for now. We expect more earnings today from names like SHOP - CAT - MCD - MRK - CMCSA and more.