DIS sells off, META rallies
November 8, 2022
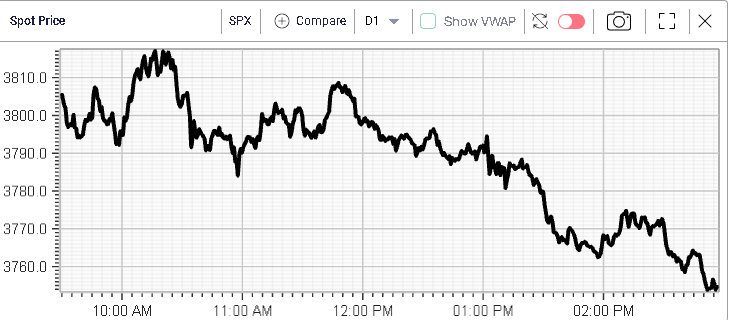
Crypto markets continued to dropped with BTCUSD losing around 9% which continued to impact sentiment negatively. Equity indices were under pressure, the NDX traded down more than 2% over the day, the SPX lost slightly less than 2%.
European assets continued to fare slightly better although this is partly due to difference in closing time compared with US counterparts which continued to selloff past the EU close.
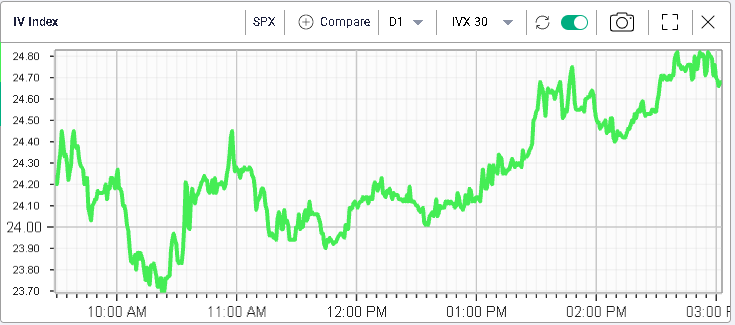
Implied volatility reacted to the price action in spot by moving higher and settling slightly under 25% for 30d IVX.
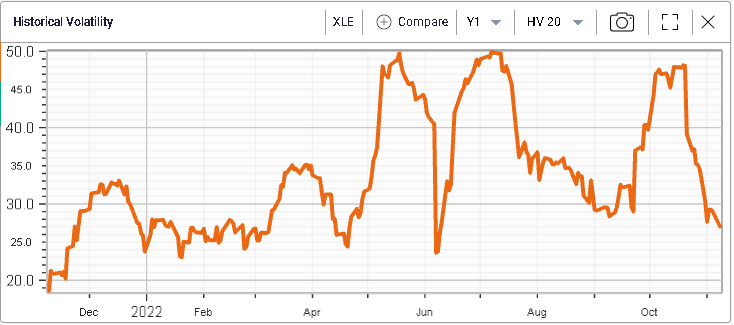
Looking at sectors, the energy segment was under a lot of pressure over the day with Crude Oil losing 3.5%. The XLE finished more than 4% in the red. Implied volatilities across the curve moved higher as a result.
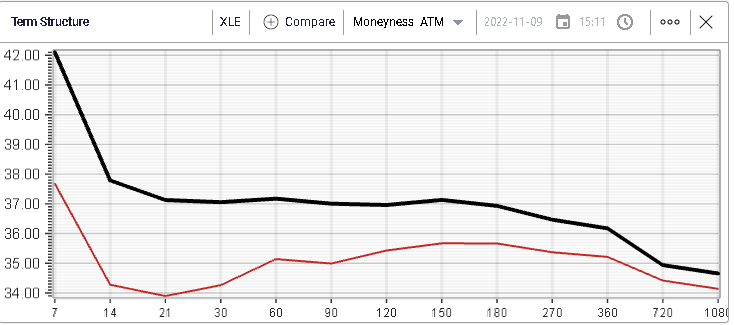
This very rapid repricing of implied volatility for the XLE is interesting especially as realized volatility had been trending lower prior to yesterday’s large move and was settling around 26%.
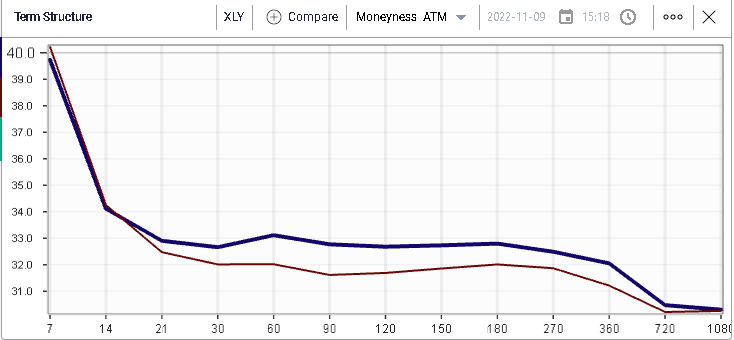
The consumer discretionary was the second worst performing segment in the market losing around 2.5% over the session and finishing at its most recent lows.
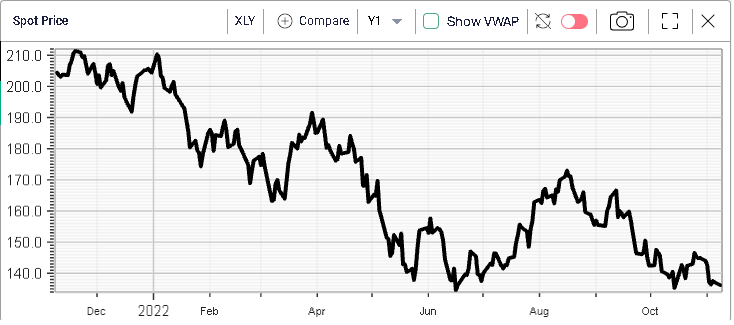
Implied volatilities were already elevated as market makers seem to have concerns about this sector and the vol remark was very light for short dated options. For longer dated maturities, we saw 30d IVX move higher by almost a full point over the session.
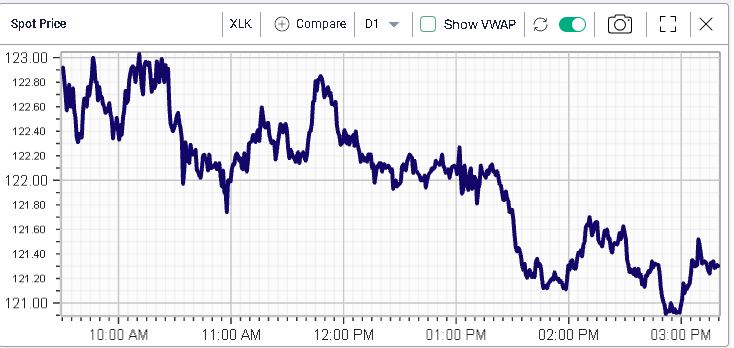
Tech stocks also struggled losing 2.3% over the day but bouncing intraday from their worst levels.
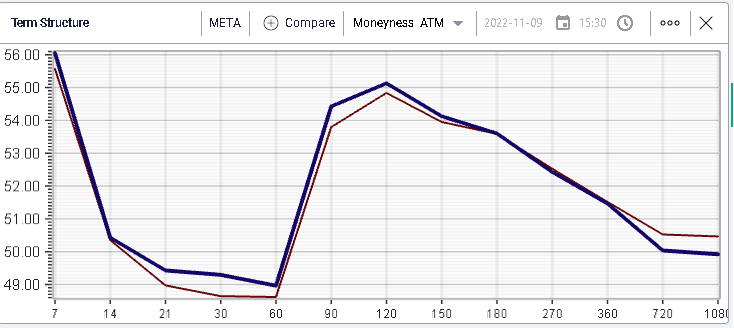
At the single stock level, we have to mention META which finished higher by around 5.6%. Media reports (FT) indicated that the company cut staff by 11,000 or 13% of total workforce citing difficulties with revenue growth, advertising performance and ecommerce.
The stock is still down around 70% YTD and options traders continue to be concerned about the possibility for elevated volatility over the next 12 months.
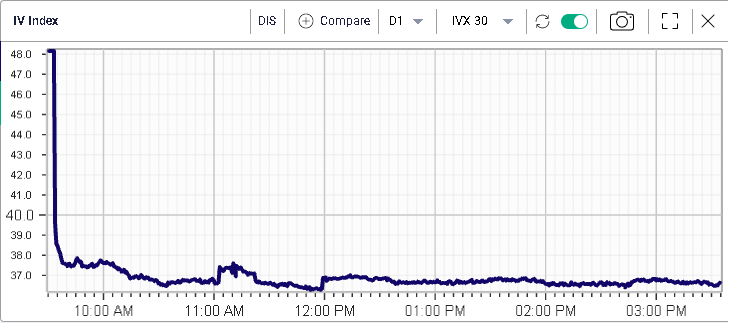
On the downside, DIS lost 12.5% yesterday after the company reported a larger loss than anticipated in its streaming business according to Reuters. Options traders had been anticipating a large move as shown below with the blue line showing implied volatility as of the 9th compared with the brown line as of the prior close.
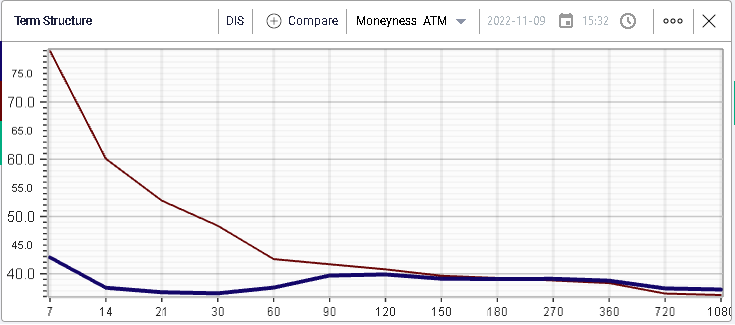
All implied volatilities remarked significantly lower over the day with the 30d IVX finishing around 36.5%.