Last Week’s Highlights at IVolLive:
- On Saturday, our experts gave a LIVE walkthrough and demo on the IVolLive platform, including how to trade puts, calls, and spreads as well as how to add features like stocks, charts, the Stock Monitor, and the Profit and Loss Calculator. Watch the video HERE.
- You can register for any of our upcoming LIVE webinars HERE.
- You can watch and view any of our past videos on our YouTube channel HERE.
- Register for a free IVolLive Trial HERE.
Conflicting Narratives
February 21, 2023
The Federal Reserve's actions and constant narrative that interest rates will go higher and stay higher for longer conflicts with markets expectations that rates will soon decline as the economy enters a recession and makes deciding on the best course of action as confusing as walking through a house of mirrors. Perhaps abundant instant data and analysis available to everyone gives both the bulls and the bears what they need.
S&P 500 Index (SPX) 4079.09, slipped just 11.37 points or -.28% even after an event filled week that included the Consumer Price Index, Producer Price Index, Retail Sales and monthly options expiration, by the end of the week, it ended almost where it began. The chart below shows the current upward sloping trendline (USTL) from the October low along with a small horizontal green mark at the 4325 level. This would activate the Head &Shoulders Bottom pattern on higher closes even though it already exceeded the technical neckline. The subjective higher level adds a buffer due to the weak level it reached on the December advance before forming the right shoulder (not labeled).
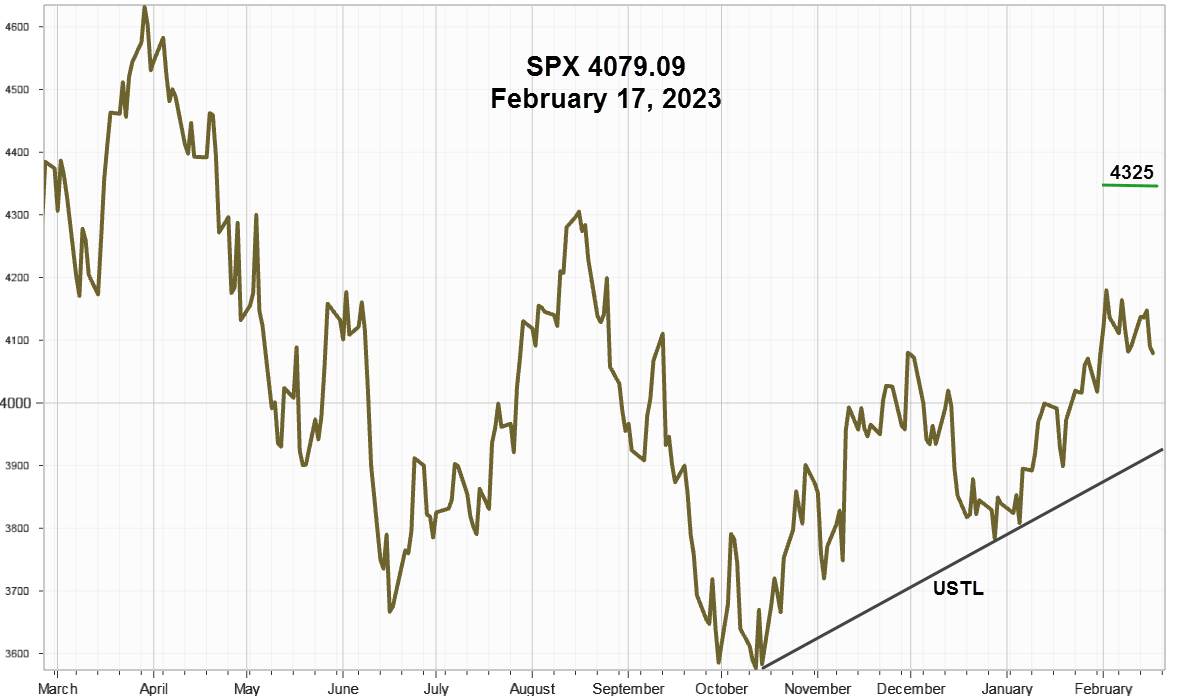
Using a range between the USTL and 4325 provides space for some movement while a low level of options implied volatility suggests the next move could be lower. In the meantime, focus on the range.
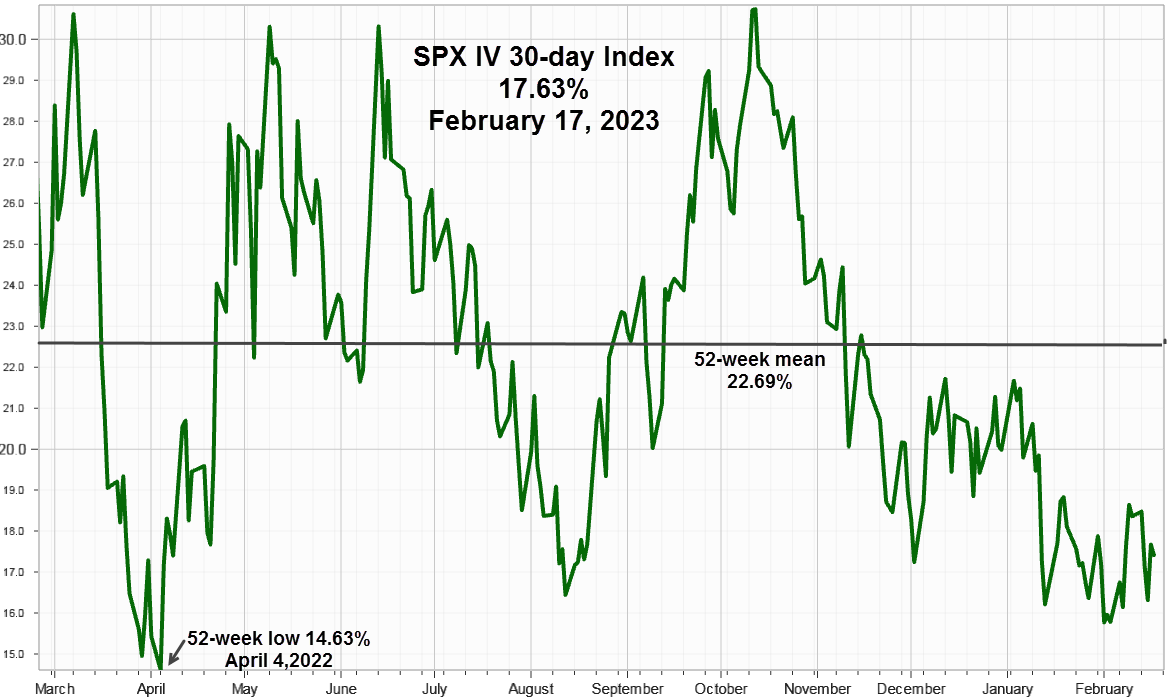
Implied Volatility
SPX 30-day options implied volatility index, IVX, ended .82 points lower at 17.63% while the 7-day IVX slipped 6.32 points to 15.84%, back to a normal positive spread after February monthly options expiration.
For reference keeping in mind the tendency to return to the mean, this 52-week chart shows it at 22.69%, along with the April 4, low at 14.63%.
Adding in another useful indicator that measures option implied volatility calculated from out-of-the-money SPX options seems to confirm increased hedging activity.
Cboe Skew Index (SKEW) 123.09 + 2.51 points for the week.
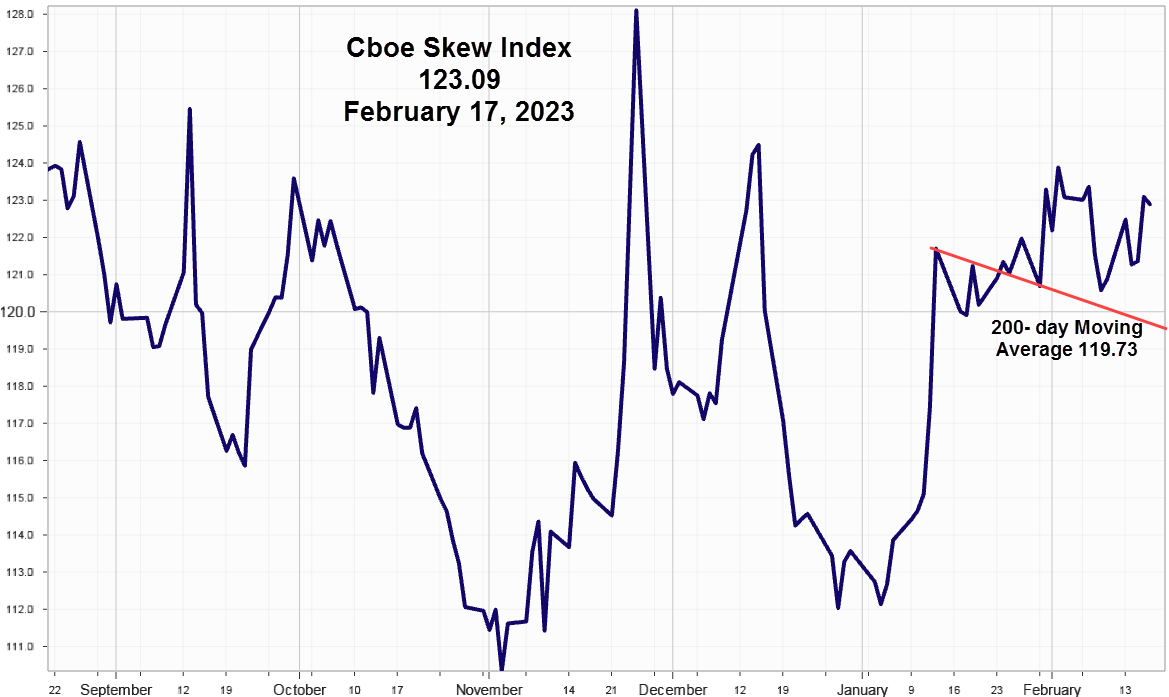
With 100 considered normal, higher readings measure added weight given to left tail probability distribution risk typically associated with negative equity events. For example, collars, long out-of the-money puts and short out-of- the- money calls would increase options volume. With low implied volatility, consider option combinations with more long than short legs such as ratio backspread strategies.
Previous spikes in October and December shown in the chart above reflect increased out-of-the-money options activity associated with hedging activity.
Market Breadth as measured by our preferred gauge, the NYSE ratio adjusted Summation Index that considers the number of issues traded, and reported by McClellan Financial Publications declined again all last week, slipping another 136.23 points to end 849.32. From a breadth perspective, the Fed's higher rates for longer narrative got the advantage, much to the dismay of the bulls.
Summing Up
The conflict between the Federal Reserve insisting that interest rates will go higher and stay longer and the market's expectations for a rate cut could be eased somewhat assuming both sides accept that inflation will decline somewhat but will remain higher than the Fed's 2% target, but the issue remains unresolved. In the meanwhile, odds favor S&P 500 Index trading in a range around 4000 while hedgers and option strategists prepare for more downside using options while option implied volatility nears previous low levels.
Previous issues are located under the News tab on our website.