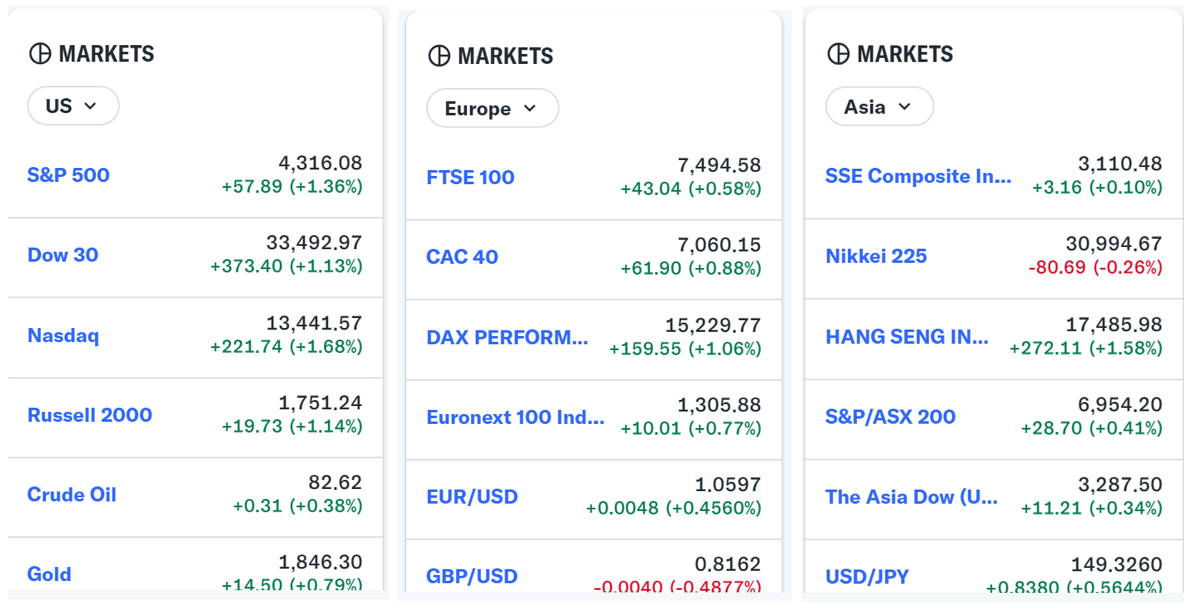
Last Week’s Highlights at IVolLive:
- Register HERE for our next live webinar on Tuesday, October 10th where we will feature the Sentiment Analyzer.
- Get a free IVolLive Trial HERE.
Oil Falls...
October 6, 2023
A few weeks ago, the topic du jour was the dramatic rise in oil. Today? The dramatic fall...
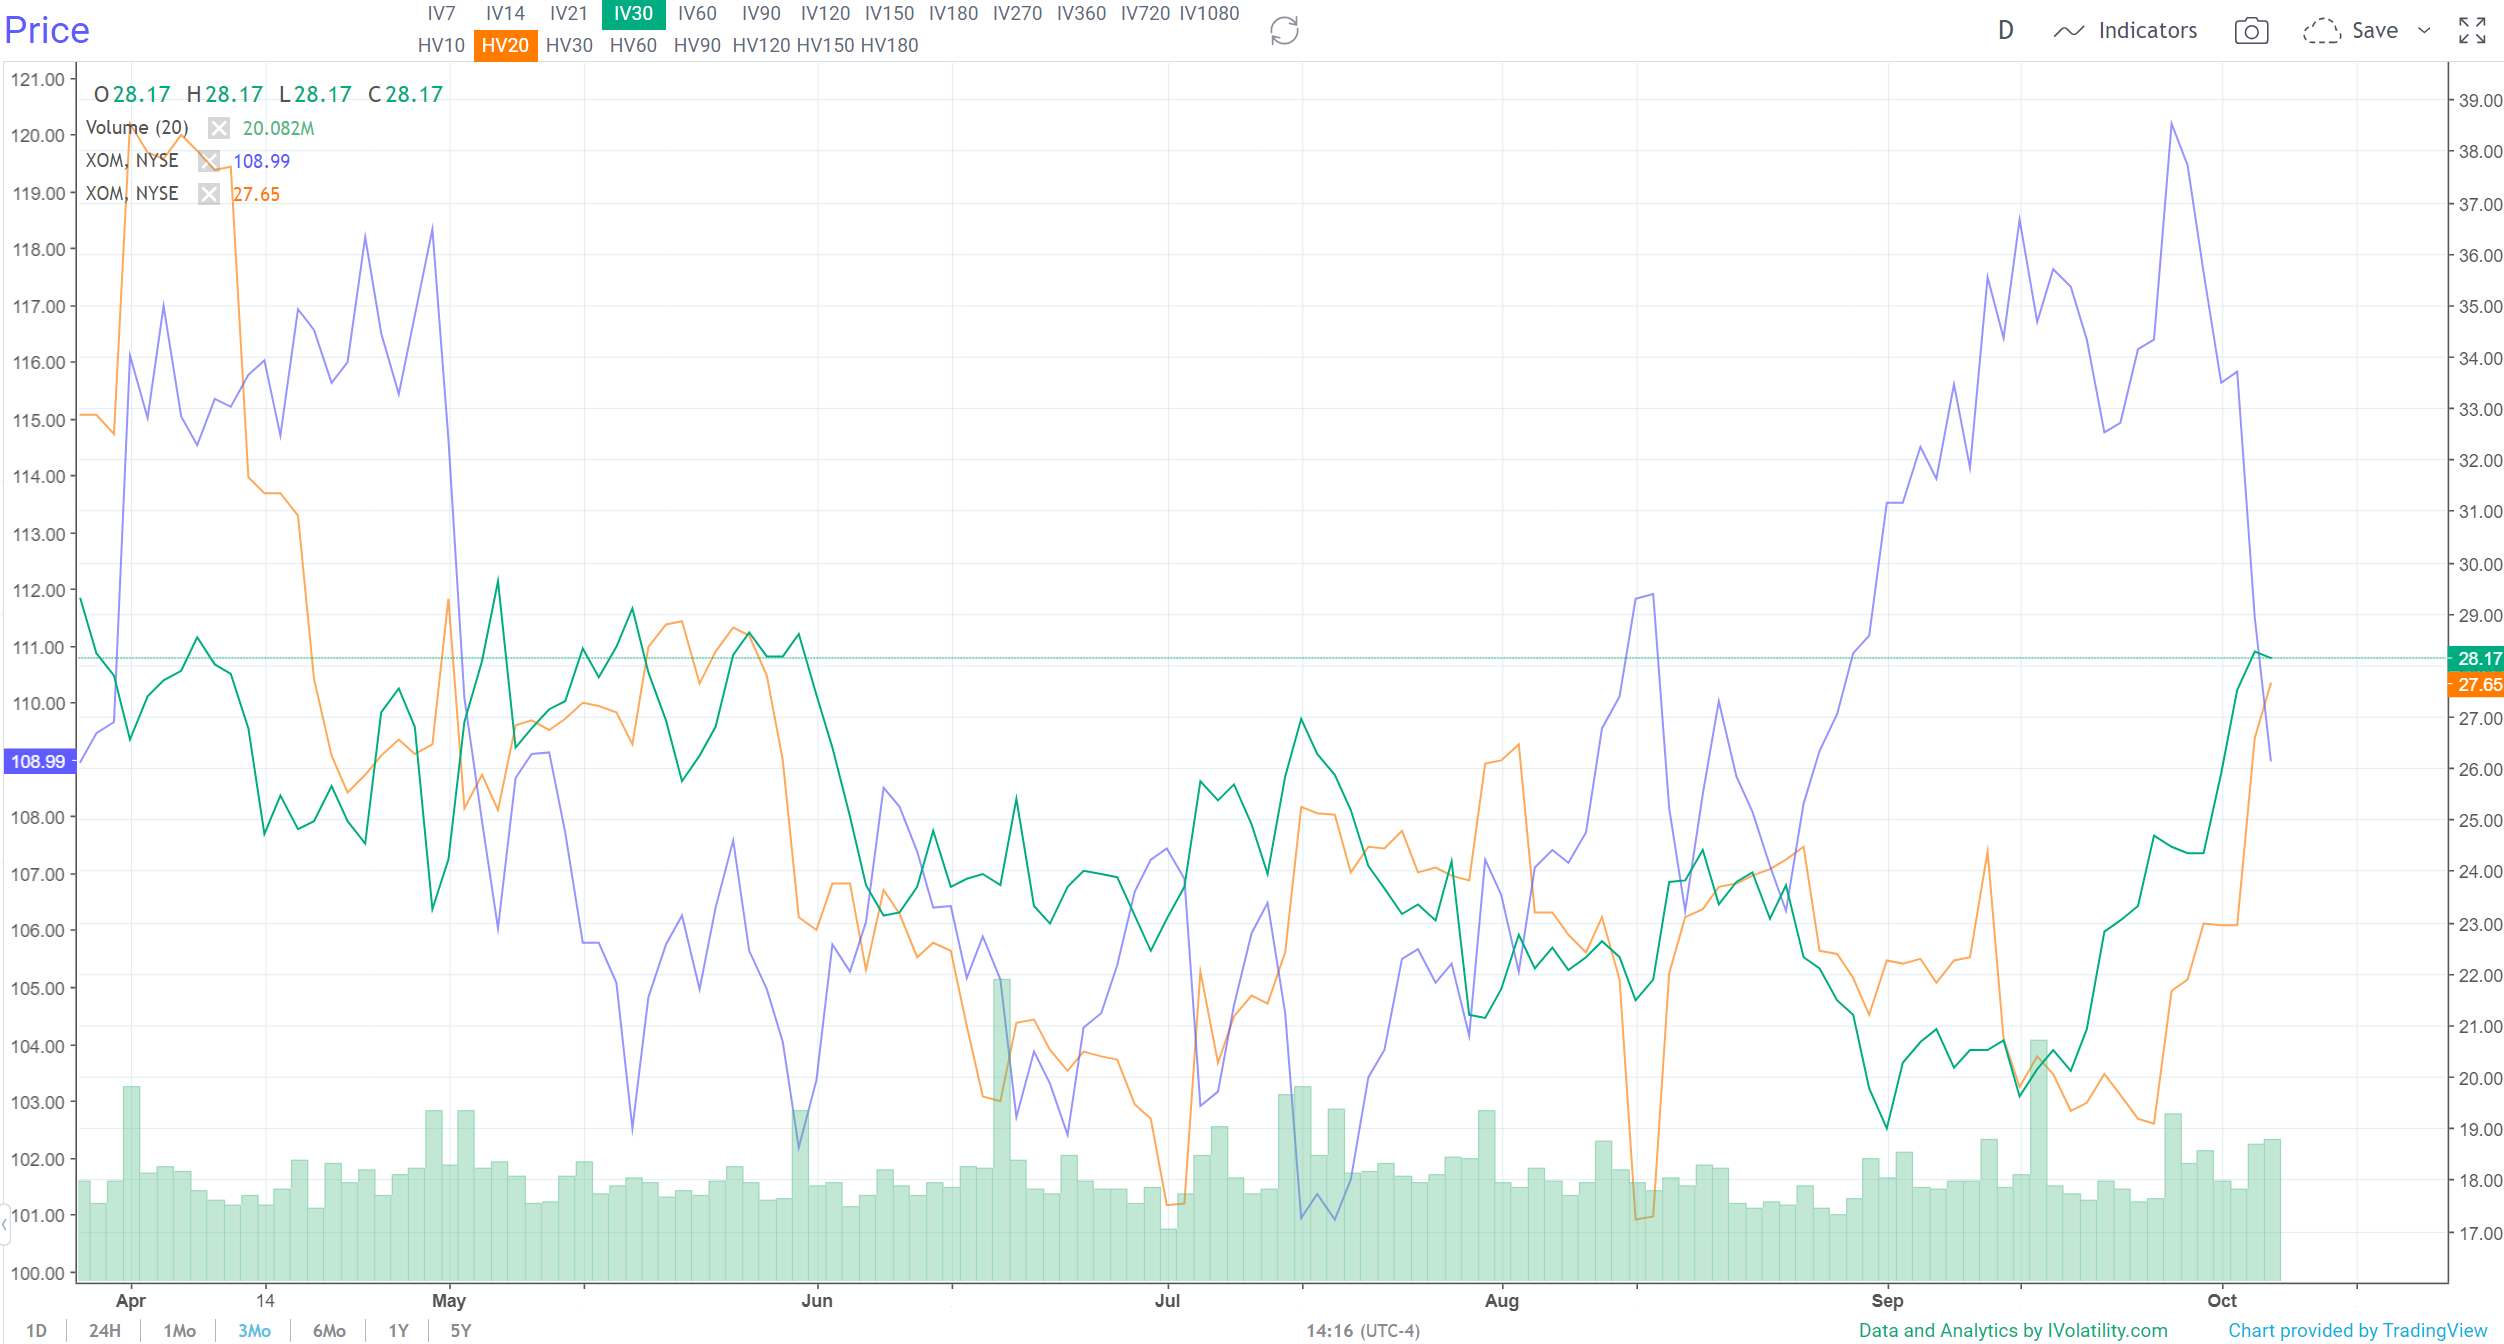
This three-month chart shows the dramatic decline in Exxon's (XOM) share price since the calendar turned to October. And oil is not alone, check out gold:
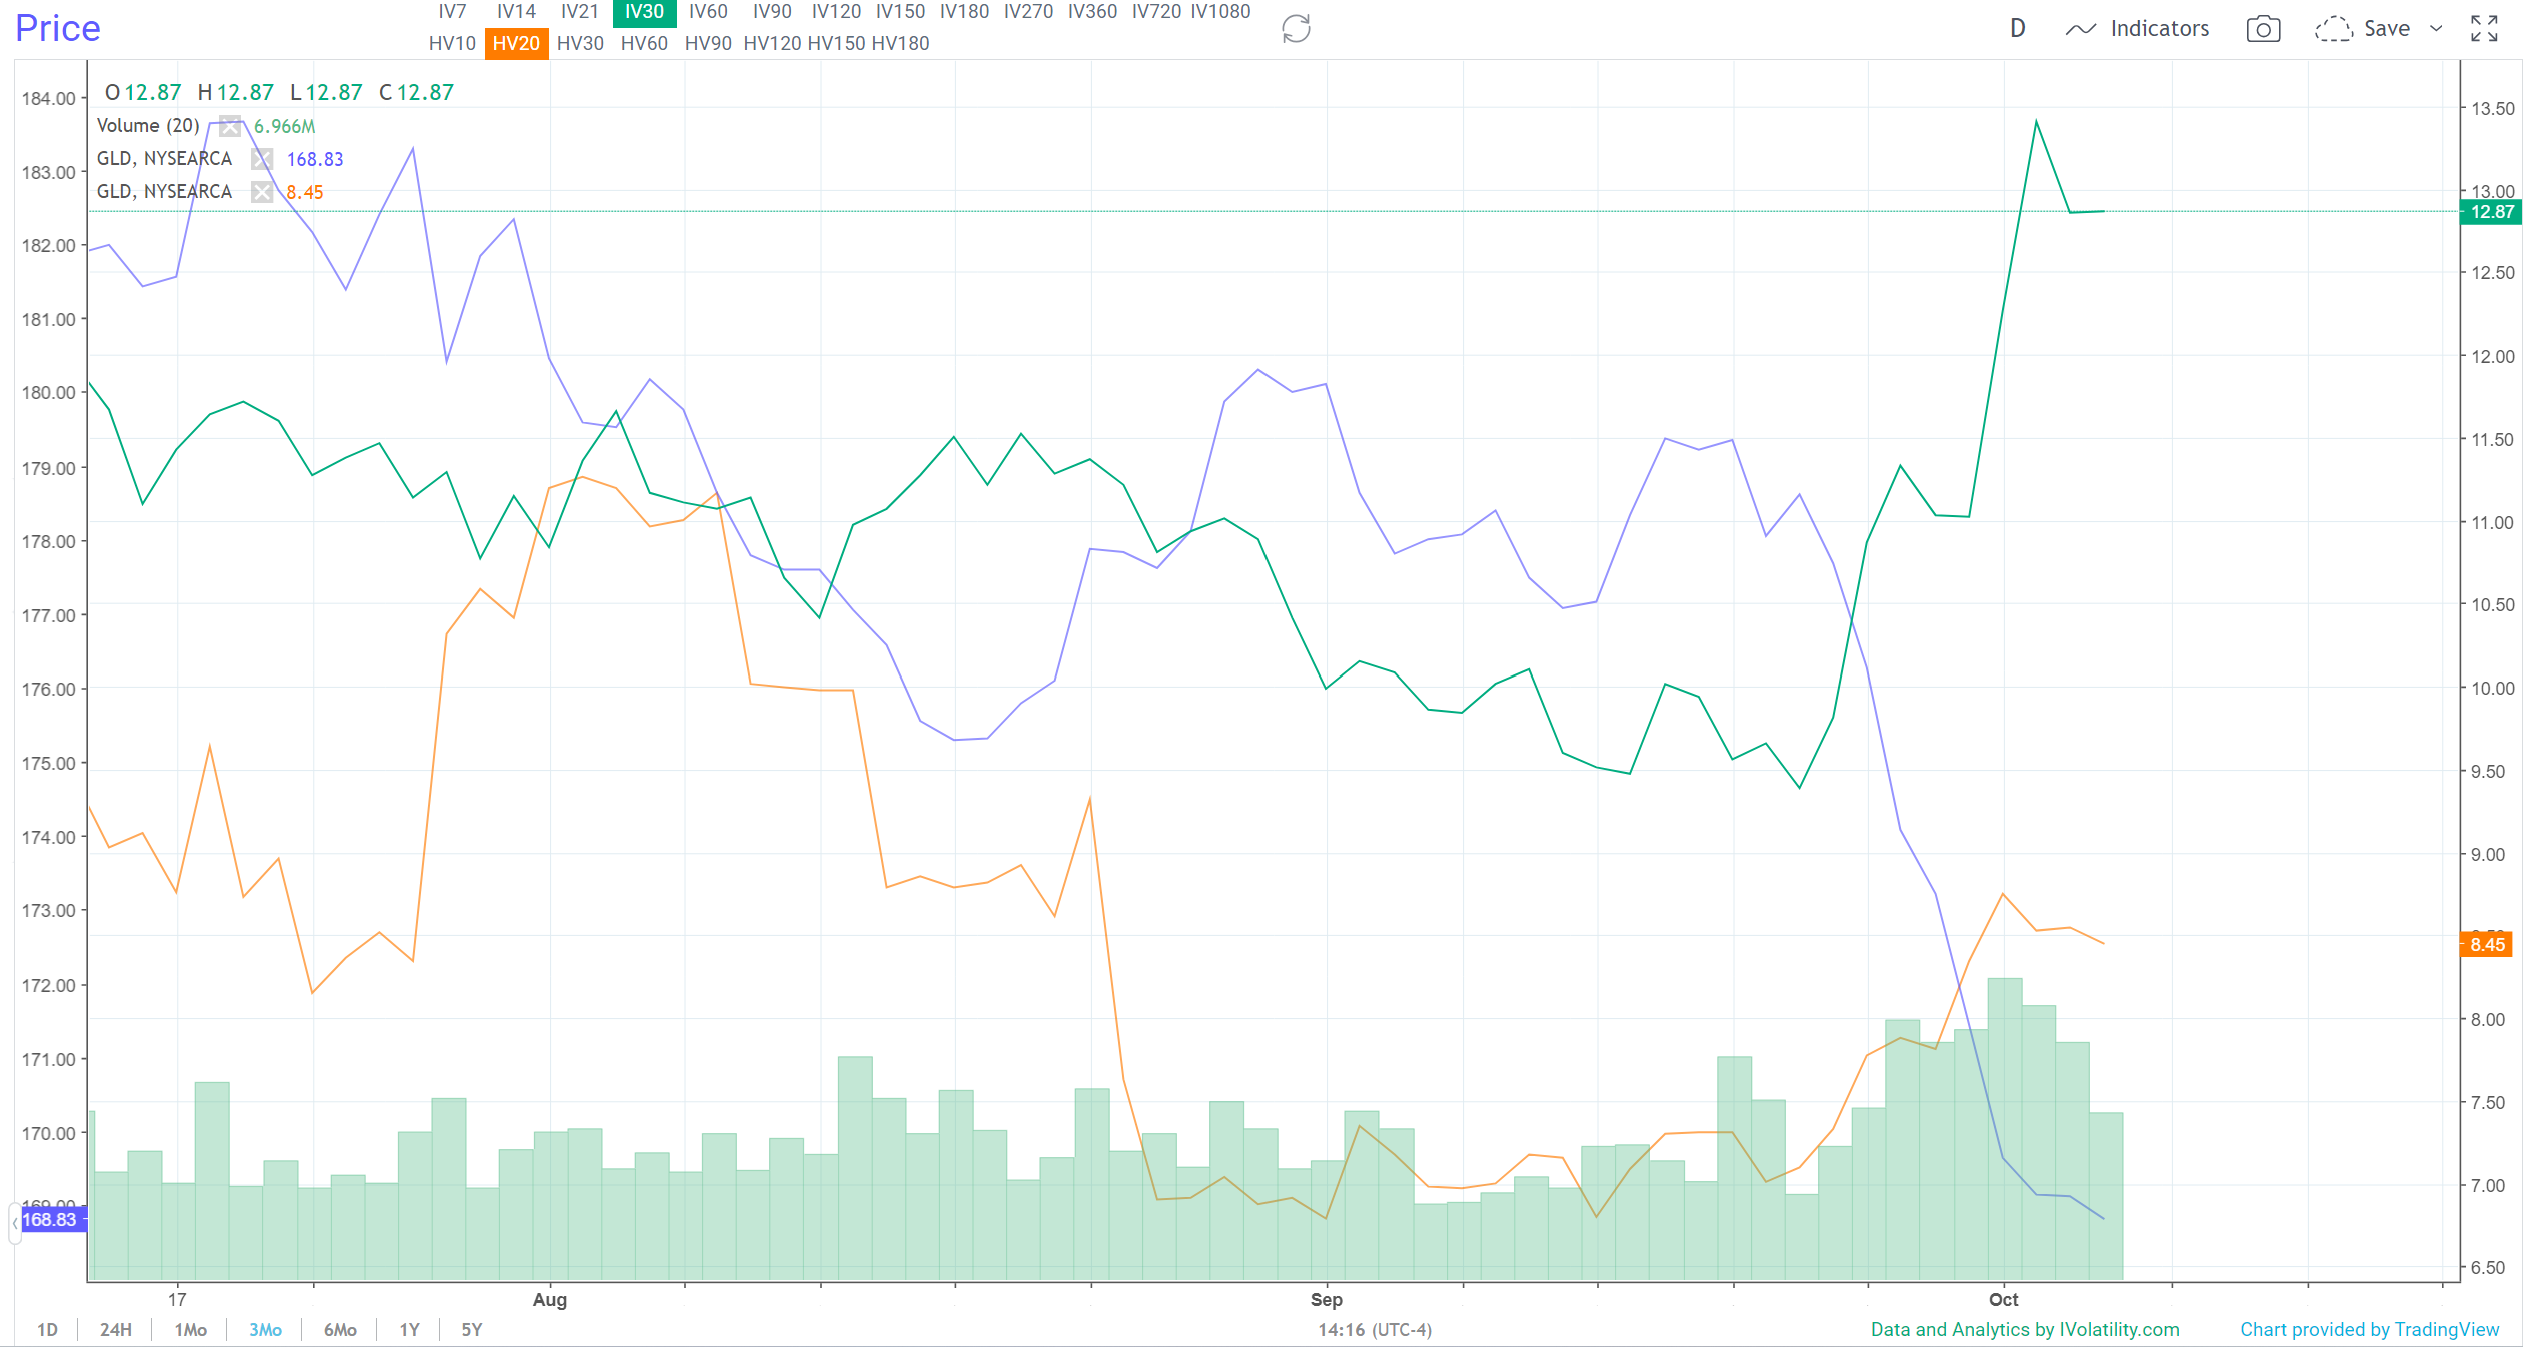
In both of these three-month charts, we can see price (the blue line) crashing through Implied Volatility (the green line).
When this happens (price crashing and IV rocketing higher) it means that an asset is under sever selling pressure, and that option prices/premiums are very expensive.
This also means that if you've been on the sidelines waiting to sell options (either puts, covered calls or spreads) these premiums are not much higher - which means the income is also much higher.
Also, using our IVolLive technical analysis tools, we can see that the dramatic move higher in IV is overstretched:
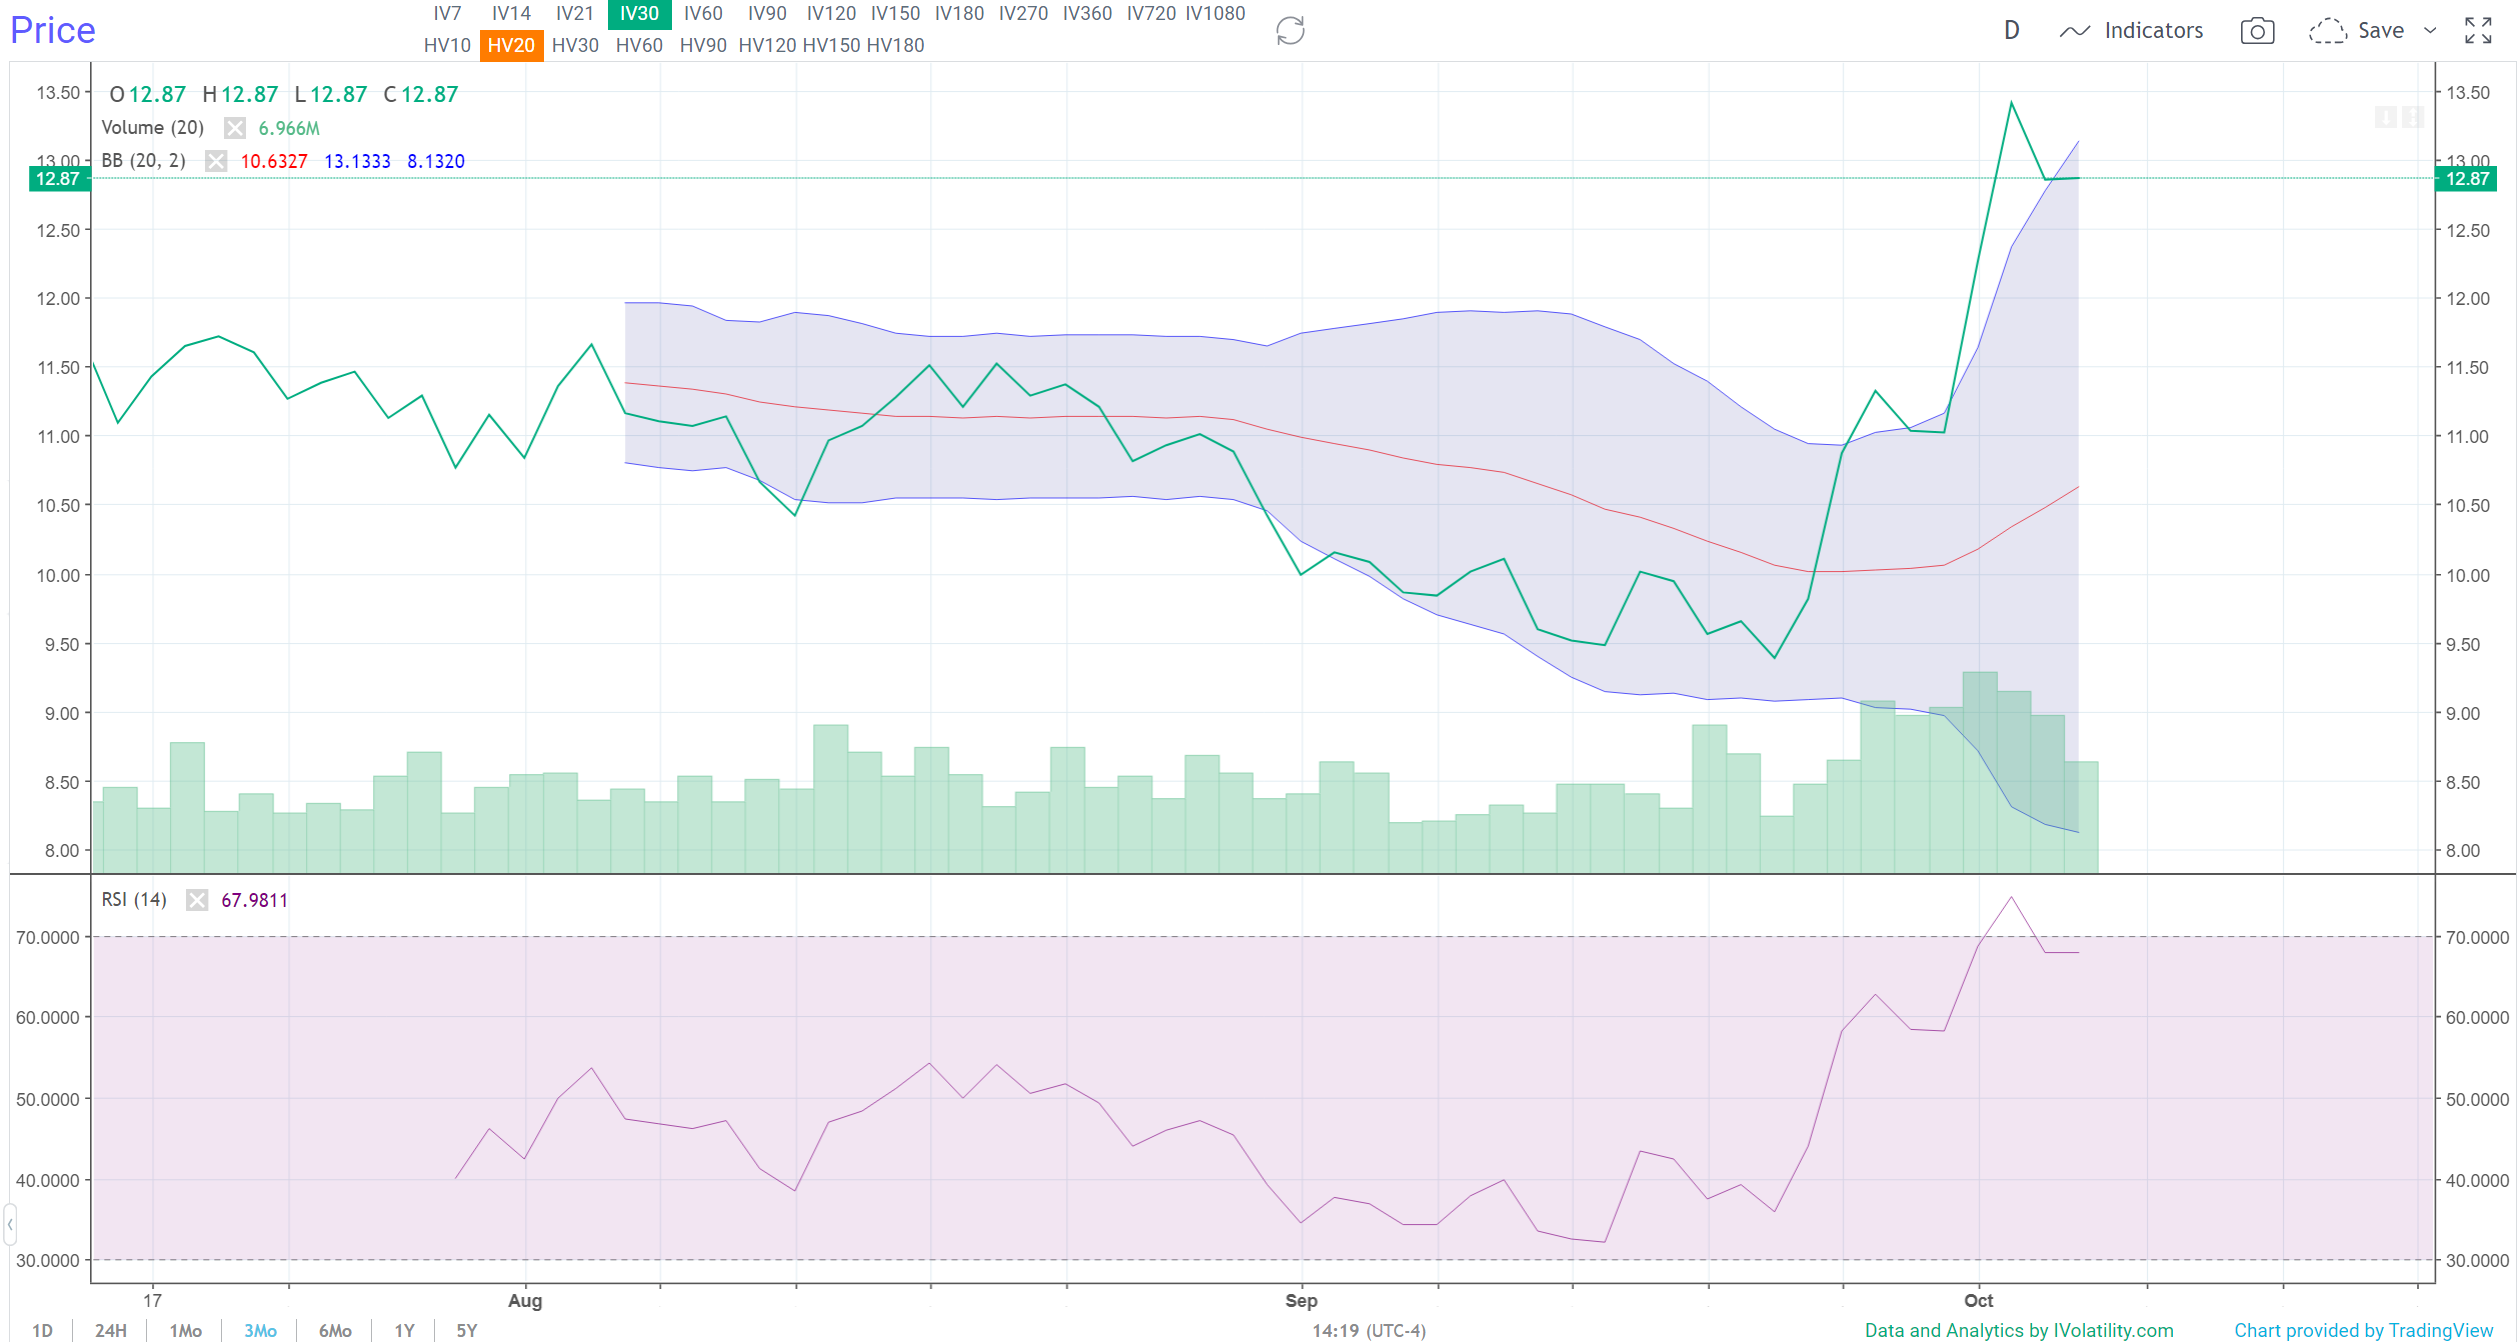
Here is GLD above. As you can see, IV spiked above the upper Bollinger Band and RSI level and is now heading lower. This almost always coincides with an increase in the underlying share price.
We have almost an identical setup with Exxon (XOM):
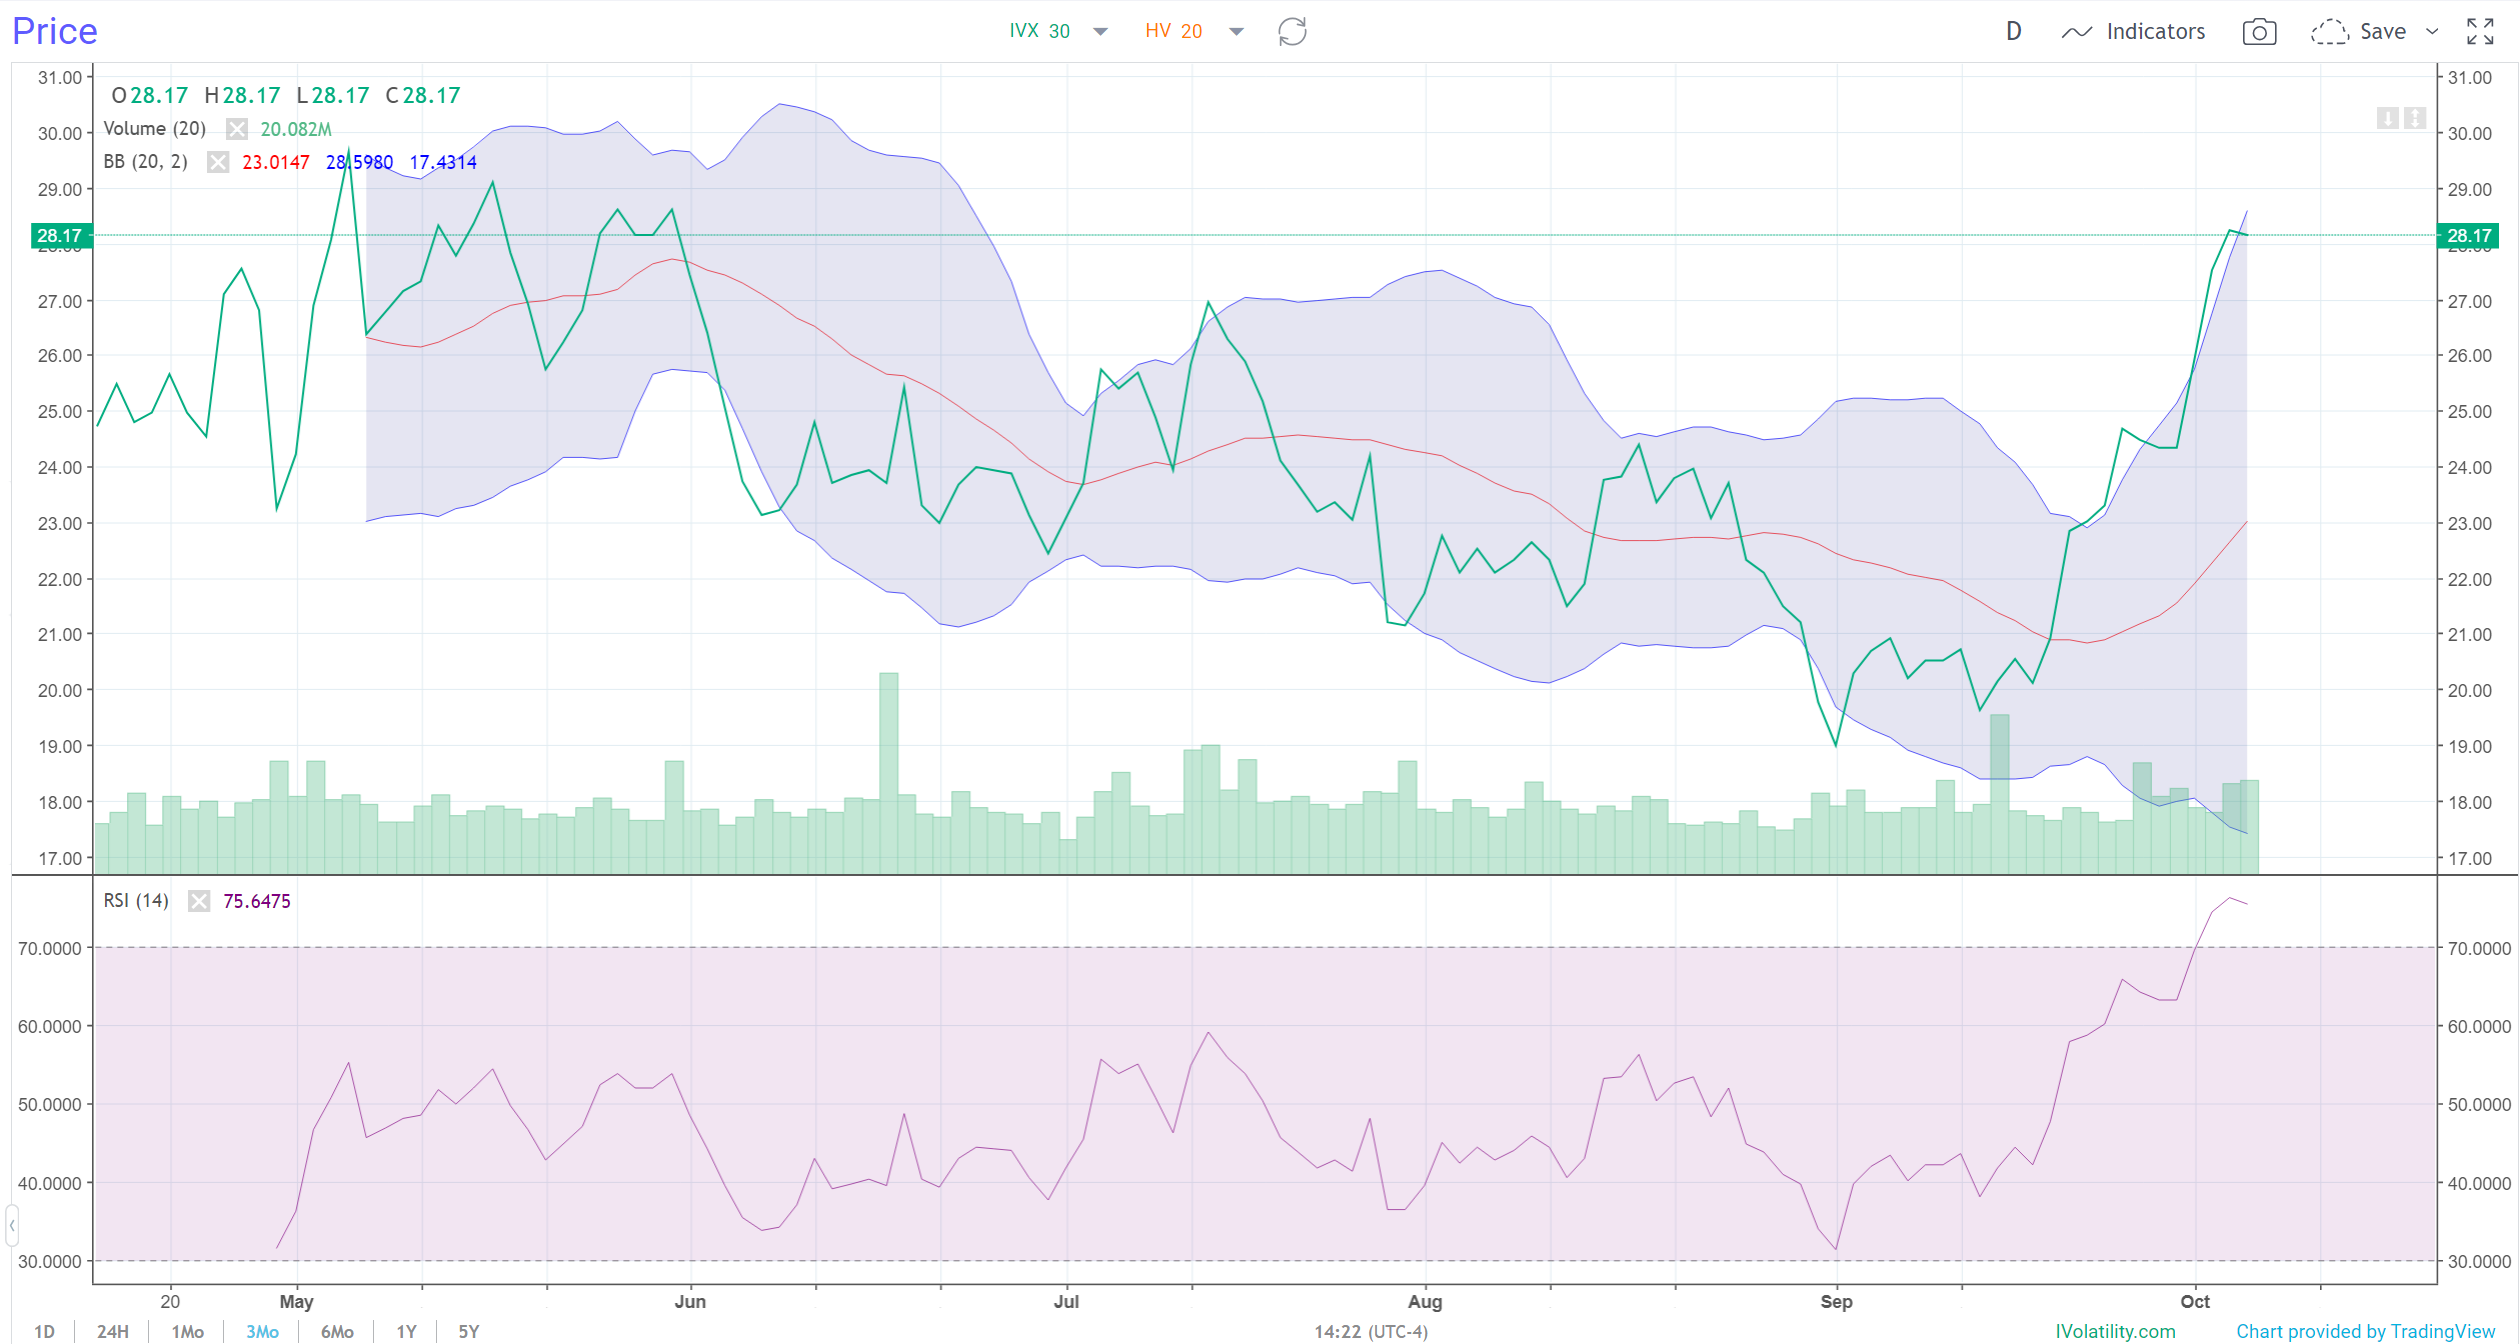
IV for the oil giant has turned lower after stretching and over-extending to the upside.
How to Play It
With the dramatic drop in share price - paired with the dramatic increase and no reversals of IV - now could be a great time to evaluate selling options against oil giants (like Exxon) and nibbling on strong gold names (GLD, Newmont, Barrick, etc).
Next steps: Evaluate your favorite energy and gold names in IVolLive using the Charting Tools from last week's live webinar HERE, and the P&L Calculator from this week HERE.
Previous issues are located under the News tab on our website.