Does High VIX Predict SPY Declines? Part I: Statistical Analysis and Z-Score Backtest. IVolAI Investigates
A Time-Series Study of SPY Implied Volatility Indicators, 2021–2026
Summary
Among market participants, few beliefs are as deeply held as the idea that VIX spikes signal impending market crashes. When the "fear index" surges, the natural instinct is to sell — or at least to stay out. But is this fear justified? Does high implied volatility on SPY actually predict negative forward returns?
We tested this using five years of daily SPY data with 16 volatility indicators — including VIX, IVX at multiple tenors (7 to 60 days), IV/HV ratios, IV Rank, IV Percentile, and derived signals like the IVX30 Z-score. We then subjected our findings to four rigorous robustness tests to separate genuine signals from statistical artifacts.
Key Findings
- High VIX/IVX predicts POSITIVE returns, not negative. SPY's 20-day forward return averaged +3.78% when IVX30 was in the 25–35 range, versus +0.90% when IVX30 was below 15. The direction is the opposite of the popular narrative.
- The IVX30 Z-score (how much IV has spiked relative to its own 60-day history) shows the strongest quintile effect: +2.51% mean 20d return in Q5 (highest z-score) versus +0.50% in Q1 (p < 0.001). This captures "sudden fear" better than raw IV level.
- IV spikes of ≥5 points in a single day were followed by an average +5.12% over 20 days — five times the baseline return.
- IV/HV Ratios show no predictive power for SPY. The signal that worked for individual stocks (in our previous study of S&P 500 constituents) does not transfer to the broad market.
- However, our robustness tests revealed that the statistical significance was inflated by overlapping returns. With non-overlapping 20-day samples (N≈64), the IV indicators lose significance. The one signal that survives non-overlapping sampling is simple trailing 5-day price return — "buy after SPY drops."
- The effect worked in the 2022 bear market too — this is not purely a bull market artifact.
- Backtest validation (Section 10): Trading the Z-score signal over 5 years using short ATM straddles returned +61.24% on 10% allocated capital (Sharpe 1.36, MaxDD 2.27%), profitable every year including 2022. Combined with 90% passive SPY, the portfolio returned +128% (17.93% CAGR) vs +74% for pure SPY buy-and-hold.
1. What We Studied
Context
In a previous study, we examined whether individual S&P 500 stocks with high IV readings underperform the market. We found that IV/HV Ratio (specifically IVX14/HV10) was the only reliable predictor of stock-level underperformance.
This naturally raises a follow-up question: does IV predict SPY itself? If high VIX predicts market declines, it would be a powerful timing signal. If it doesn't — or if it predicts the opposite — it challenges one of the most popular narratives in options trading.
Indicators
We tested 16 indicators across four categories:
| Category | Indicators | What They Capture |
|---|---|---|
| Absolute IV levels | IVX7, IVX14, IVX21, IVX30, IVX60, VIX | How much option-implied movement the market expects |
| Historical volatility | HV10, HV20, HV30 | How much SPY actually moved recently |
| IV/HV Ratios | IVX30/HV20, IVX14/HV10, IVX60/HV30 | Gap between expected and realized movement |
| Relative IV | IVR30, IVP30, IVX30 Z-score, IVX30 daily change | Where IV stands vs its own history |
Data
- Asset: SPY (SPDR S&P 500 ETF)
- Period: February 24, 2021 – February 23, 2026 (1,304 trading days)
- Sources: IVolatility.com API —
/equities/stock-market-datafor IVX30/60, HV10/20/30, IVR30, IVP30;/equities/eod/ivxfor IVX7/14/21;/equities/stock-market-datawith symbol VIX for VIX close - Forward horizons: 1, 3, 5, 7, 10, 20, 30 trading days
- Method: Spearman rank correlation + quintile conditional analysis + robustness tests
2. Correlation Results
We computed Spearman rank correlations between each indicator level on a given day and SPY's forward return at each horizon.

Figure 1: Spearman correlation between IV indicators and SPY forward returns. Red = positive (higher IV → higher future return). Blue = negative. Stars indicate statistical significance.
The Headline Finding: IV Levels Predict POSITIVE Returns
| Indicator | ρ (20d) | p-value | Direction |
|---|---|---|---|
| IVX14 | +0.120 | <0.001 | Higher IV → higher SPY return |
| IVX7 | +0.119 | <0.001 | Higher IV → higher SPY return |
| IVX30 | +0.104 | <0.001 | Higher IV → higher SPY return |
| IVX30 Z-score | +0.103 | <0.001 | Spike in IV → higher SPY return |
| VIX | +0.088 | 0.002 | Higher VIX → higher SPY return |
| IVX30/HV20 | -0.032 | 0.25 | No significant effect |
| IVX14/HV10 | -0.028 | 0.33 | No significant effect |
Every absolute IV measure is positively correlated with forward returns — the exact opposite of "high VIX = crash." The correlation strengthens from 1d (near zero) through 10-20d (peak), consistent with a multi-week mean reversion rather than an overnight effect.
The IV/HV ratios — which were the strongest predictors in our individual stock study — show no significant effect for SPY itself.
3. Conditional Returns: What Happens at Different IV Levels?
We divided all 1,304 trading days into quintiles by each indicator and measured the average 20-day forward return in each quintile.

Figure 2: Mean 20-day forward SPY return by indicator quintile. Q1 = lowest indicator value, Q5 = highest.
IVX30 Quintiles
| Quintile | Avg IVX30 Range | Mean 20d Return | Std Dev | % Negative |
|---|---|---|---|---|
| Q1 (Low) | ~10–12 | +0.75% | 3.03% | 33.1% |
| Q2 | ~12–14 | +0.75% | 2.99% | 28.8% |
| Q3 | ~14–17 | +1.26% | 3.05% | 25.4% |
| Q4 | ~17–22 | +0.45% | 4.67% | 39.1% |
| Q5 (High) | ~22–52 | +1.69% | 5.87% | 37.5% |
Q5 (highest IV) produces the highest mean return (+1.69%) but also the highest volatility (5.87% std) and more negative outcomes (37.5% vs 25% for Q3). This is the "buy the fear" tradeoff: higher expected return, but more variance and more paths that go through drawdowns first.
IVX30 Z-Score: The Strongest Signal
| Quintile | Mean 20d Return | t-test (Q5 vs Q1) |
|---|---|---|
| Q1 (Low z-score) | +0.50% | |
| Q3 | +0.16% | |
| Q5 (High z-score) | +2.51% | t = 5.65, p < 0.001 |
The z-score (current IV minus 60-day rolling mean, divided by rolling std) separates the quintiles more cleanly than raw IV. This is because z-score measures how suddenly IV has changed — capturing the "spike" events that drive the mean reversion effect. An IVX30 of 25 after weeks at 12 (high z-score) is very different from IVX30 of 25 after weeks at 30 (low z-score, IV is actually calming down).
4. IV Regime Analysis
We grouped days by absolute IVX30 level into regimes commonly used by practitioners.
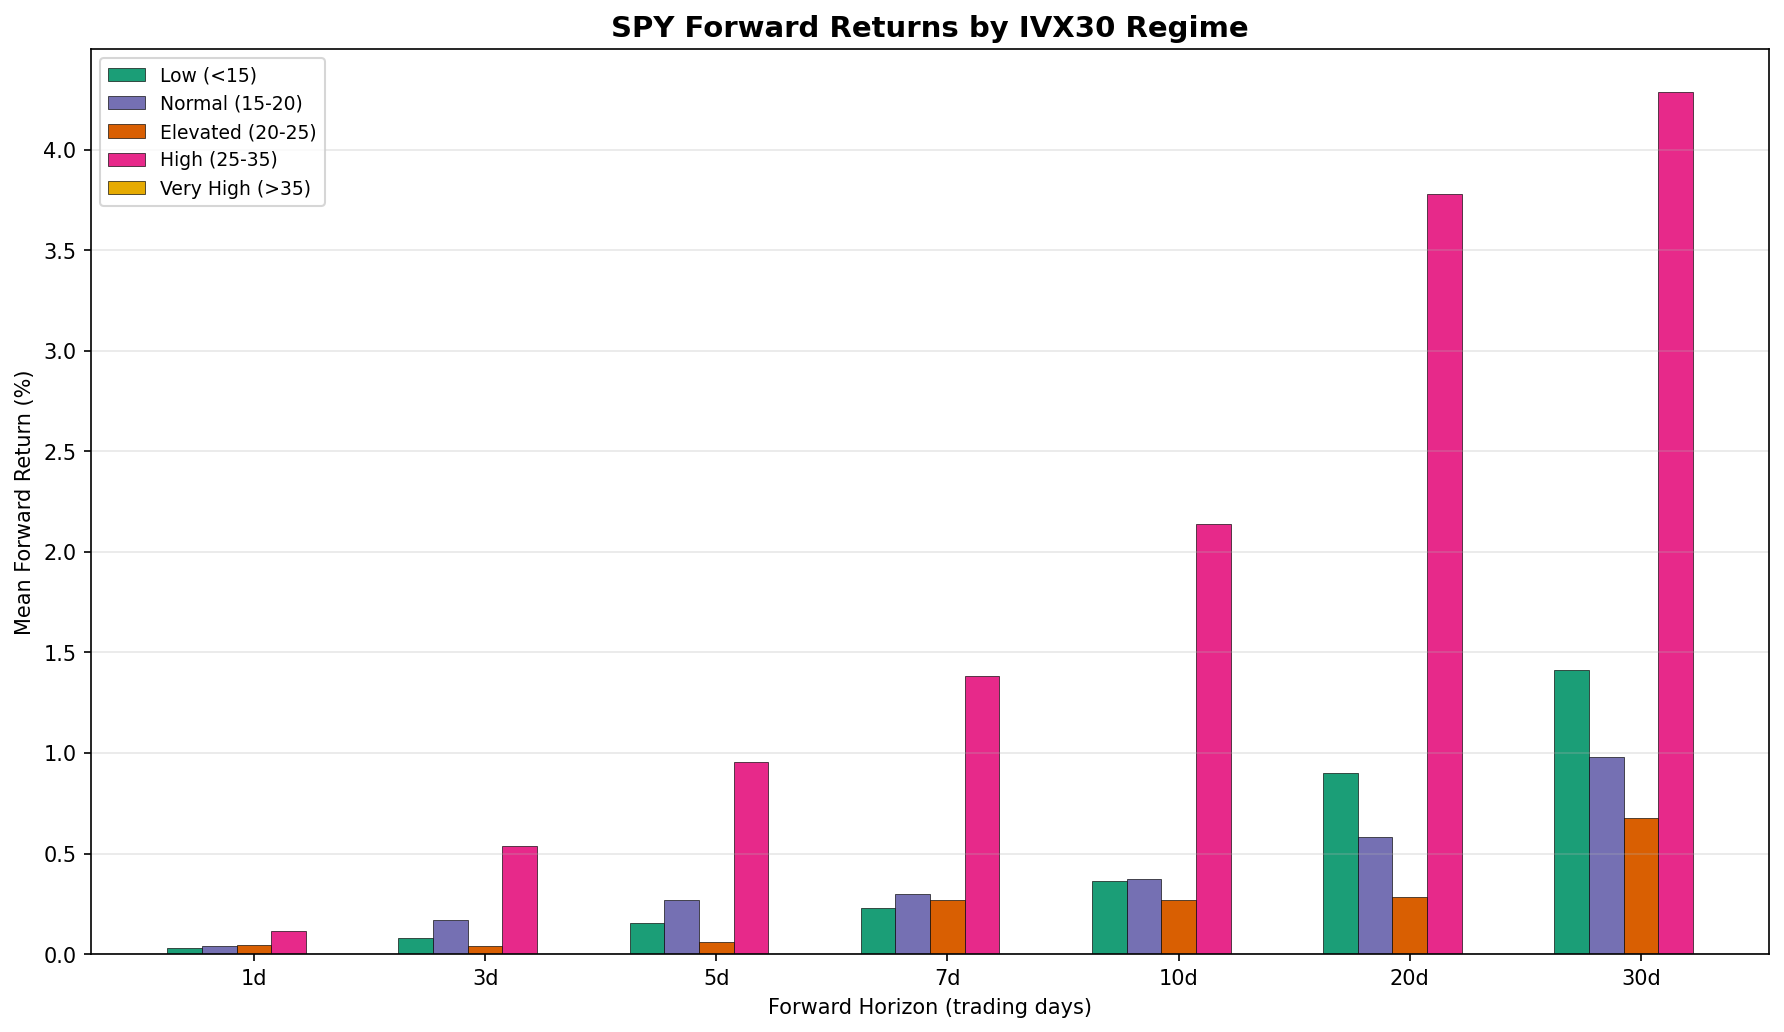
Figure 3: SPY forward returns by IVX30 regime. Higher IV regimes show dramatically higher forward returns at all horizons.
| Regime | N Days | Avg IVX30 | 5d Fwd | 10d Fwd | 20d Fwd | 30d Fwd |
|---|---|---|---|---|---|---|
| Low (<15) | 702 | 12.6 | +0.15% | +0.36% | +0.90% | +1.41% |
| Normal (15–20) | 343 | 17.2 | +0.27% | +0.38% | +0.58% | +0.98% |
| Elevated (20–25) | 161 | 22.3 | +0.06% | +0.27% | +0.29% | +0.67% |
| High (25–35) | 93 | 27.4 | +0.95% | +2.14% | +3.78% | +4.29% |
The "High" regime (IVX30 25–35) stands out dramatically: +3.78% over 20 days, roughly 4× the low-IV return. There were only 4 days above IVX30 = 35 in our sample — too few to draw conclusions about extreme events, but the 25–35 range provides a clear and statistically meaningful difference.
Note the "Elevated" regime (20–25) is actually the weakest at 20d (+0.29%). This suggests the relationship is non-linear: moderate IV increases don't help (the market is uneasy but not scared enough for a sharp rebound), while large IV spikes trigger the mean reversion.
5. What Happens After IV Spikes?
We isolated days where SPY's IVX30 changed by large amounts in a single day.
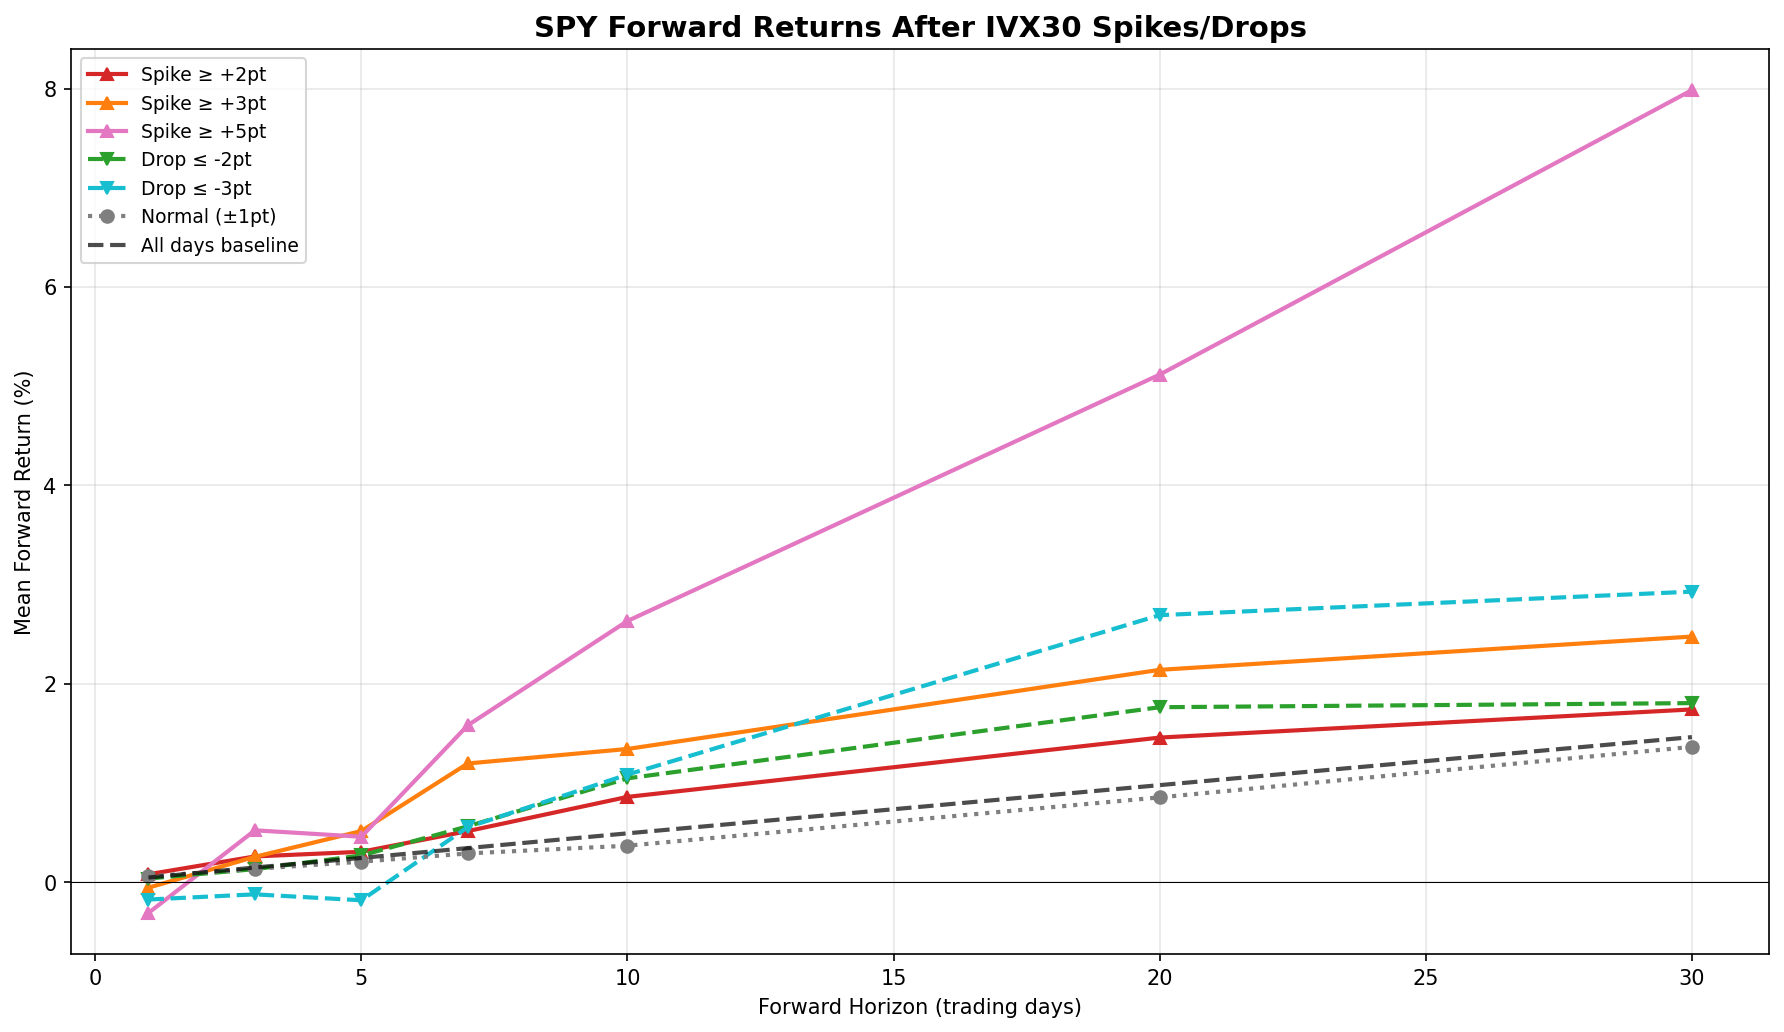
Figure 4: SPY forward returns conditional on IVX30 daily change. Large spikes (≥3pt, ≥5pt) produce the strongest forward returns.
| Condition | N Days | 5d Fwd | 10d Fwd | 20d Fwd | 30d Fwd |
|---|---|---|---|---|---|
| Spike ≥ +5pt | 9 | +0.46% | +2.63% | +5.12% | +7.98% |
| Spike ≥ +3pt | 40 | +0.52% | +1.34% | +2.14% | +2.48% |
| Spike ≥ +2pt | 78 | +0.31% | +0.86% | +1.46% | +1.74% |
| Normal (±1pt) | 865 | +0.21% | +0.37% | +0.86% | +1.37% |
| Drop ≤ -3pt | 20 | -0.18% | +1.09% | +2.69% | +2.93% |
| All days | 1,284 | +0.25% | +0.50% | +0.98% | +1.46% |
The largest IV spikes (≥5 points) produced +5.12% over 20 days — five times the baseline. Even IV drops (≤ -3pt) showed above-average forward returns, because large IV drops often follow spikes (the VIX aftershock), and the market is still recovering from the initial event.
6. SPY Price and IV Time Series

Figure 5: SPY price (blue) vs IVX30/VIX (red). Dashed lines mark IV = 25 and IV = 35. Every major IV spike corresponds to a drawdown followed by recovery.
The visual pattern is unmistakable: VIX spikes coincide with price troughs. The 2022 bear market had persistently elevated IV (15–35 range), and the 2025 tariff shock produced the sharpest single spike. In every case within our sample, SPY eventually recovered.
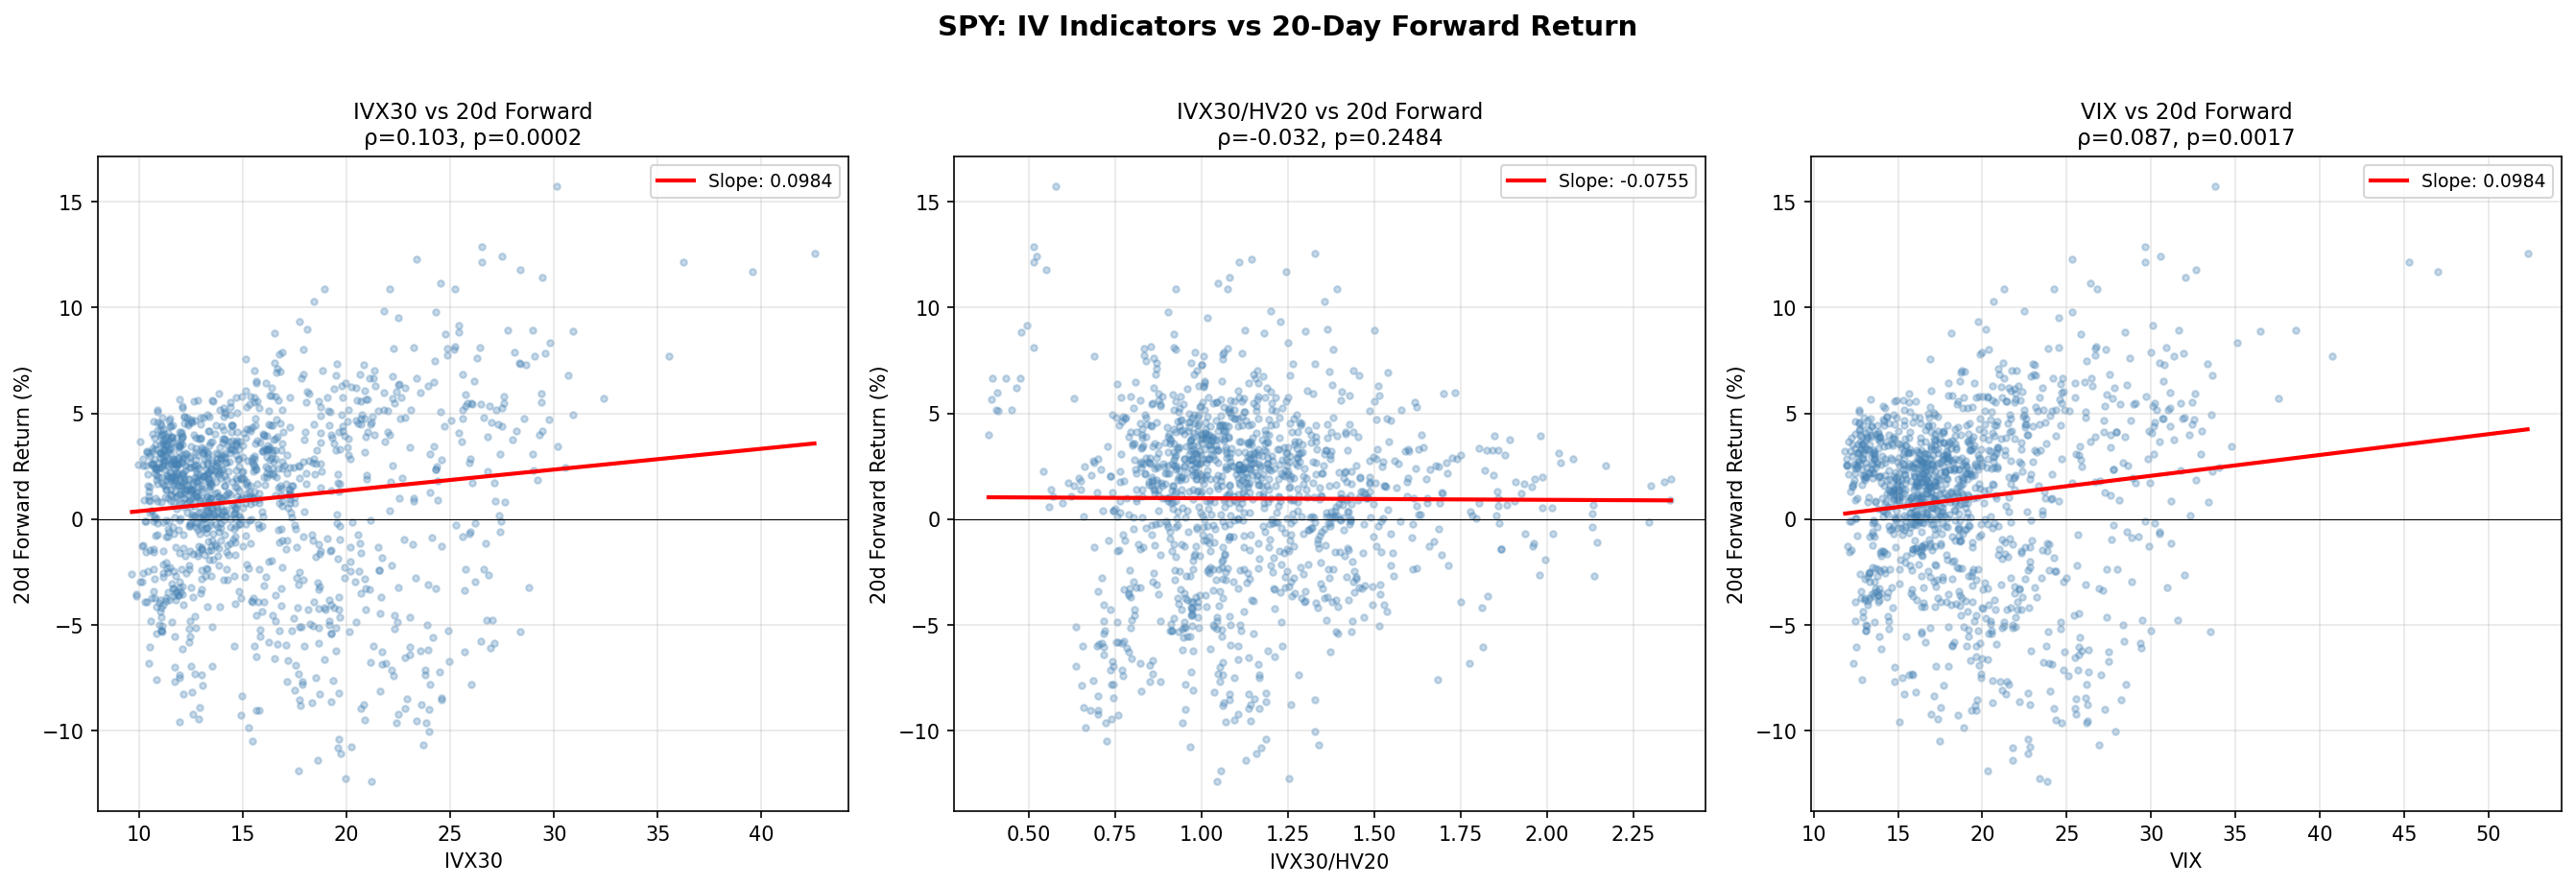
Figure 6: Scatter plots — IVX30, IVX30/HV20, and VIX vs 20-day forward return. The regression slopes are positive for absolute IV, flat for the ratio.
7. Robustness Tests
The results above use overlapping 20-day returns — every consecutive day shares 19 of 20 return days with its neighbor. This inflates sample sizes and p-values. We ran four robustness tests to determine what survives honest scrutiny.
Test 1: Non-Overlapping Returns
Method: Sample every 20th trading day, giving ~64 truly independent observations.

Figure 7: Non-overlapping correlations across 20 different starting offsets. Red dashed line = overlapping correlation. Green bars = p < 0.05. Most offsets are not significant.
| Indicator | Overlapping ρ | Overlapping p | Non-overlap ρ | Non-overlap p |
|---|---|---|---|---|
| IVX30 | 0.104 | < 0.001 | 0.147 | 0.243 |
| Z-score | 0.103 | < 0.001 | 0.218 | 0.088 |
| VIX | 0.088 | 0.002 | 0.154 | 0.221 |
| Trail 5d ret | -0.039 | 0.165 | -0.363 | 0.003 |
Verdict: The IV indicators lose statistical significance with independent samples. The correlations are still positive (ρ ≈ 0.15–0.22) and in the right direction, but N = 64 is insufficient to confirm them at p < 0.05.
The surprise: trailing 5-day price return is the only signal that survives non-overlapping sampling (ρ = -0.363, p = 0.003). Simple "buy after SPY drops" is more robust than any IV indicator.
Across 5 different starting offsets (0, 4, 8, 12, 16), IVX30 was significant in 0/5 offsets and Z-score in 0/5. This confirms the original p-values were inflated by autocorrelation.
Test 2: Delayed Entry
Method: Start measuring the 20-day forward return 0, 1, 2, 3, or 5 days after the signal.

Figure 8: Correlation strength at increasing entry delays. If the signal were pure reverse causality (drop → VIX spike → bounce), it would decay rapidly.
| Indicator | Delay 0 | Delay 1 | Delay 3 | Delay 5 |
|---|---|---|---|---|
| IVX30 | 0.103 | 0.097 | 0.085 | 0.087 |
| Z-score | 0.103 | 0.100 | 0.098 | 0.116 |
| Trailing 5d | -0.039 | -0.030 | -0.019 | -0.034 |
Verdict: The IV signal survives delayed entry. The Z-score correlation actually strengthens at 5-day delay (0.116 vs 0.103). This argues against pure reverse causality — if the effect were just "VIX spikes because SPY dropped, then the drop reverses," delaying entry should kill it. The fact that it doesn't suggests the IV level contains some genuine forward-looking information beyond the contemporaneous price move. However, these are overlapping numbers, so interpret cautiously.
The Z-score Q5 mean goes from +2.52% (delay 0) to +2.22% (delay 3) to +2.11% (delay 5) — a gradual decline, not a collapse.
Test 3: Per-Year Analysis
Method: Compute correlations separately for each calendar year.

Figure 9: Per-year Spearman ρ for IVX30 and Z-score. Red bar = 2022 bear market.
| Year | Market | IVX30 ρ | IVX30 p | Z-score ρ | Z-score p |
|---|---|---|---|---|---|
| 2021 | Bull (+27%) | 0.407 | < 0.001 | 0.248 | 0.001 |
| 2022 | Bear (-19%) | 0.539 | < 0.001 | 0.283 | < 0.001 |
| 2023 | Recovery (+24%) | 0.134 | 0.031 | -0.036 | 0.569 |
| 2024 | AI Bull (+23%) | 0.328 | < 0.001 | 0.314 | < 0.001 |
| 2025 | Tariff vol (+5%) | 0.296 | < 0.001 | -0.124 | 0.045 |
Verdict: The IVX30 level effect is strongest in the 2022 bear market (ρ = 0.54), not weakest. This is important — the "buy the fear" effect is not just a bull market artifact. However, the Z-score signal is less consistent: it works well in 2021, 2022, 2024, but reverses slightly in 2023 and 2025.
Z-score quintile spread by year:
- 2022 bear: Q5 = +1.46%, Q1 = -2.03% → spread = +3.49% (strongest)
- 2023 recovery: Q5 = +1.51%, Q1 = +1.96% → spread = -0.45% (reversed)
- 2024 AI bull: Q5 = +2.65%, Q1 = +0.62% → spread = +2.04%
Test 4: Is IV Redundant vs. Price?
Method: Compare IV indicators against simple trailing price returns, and test partial correlations.
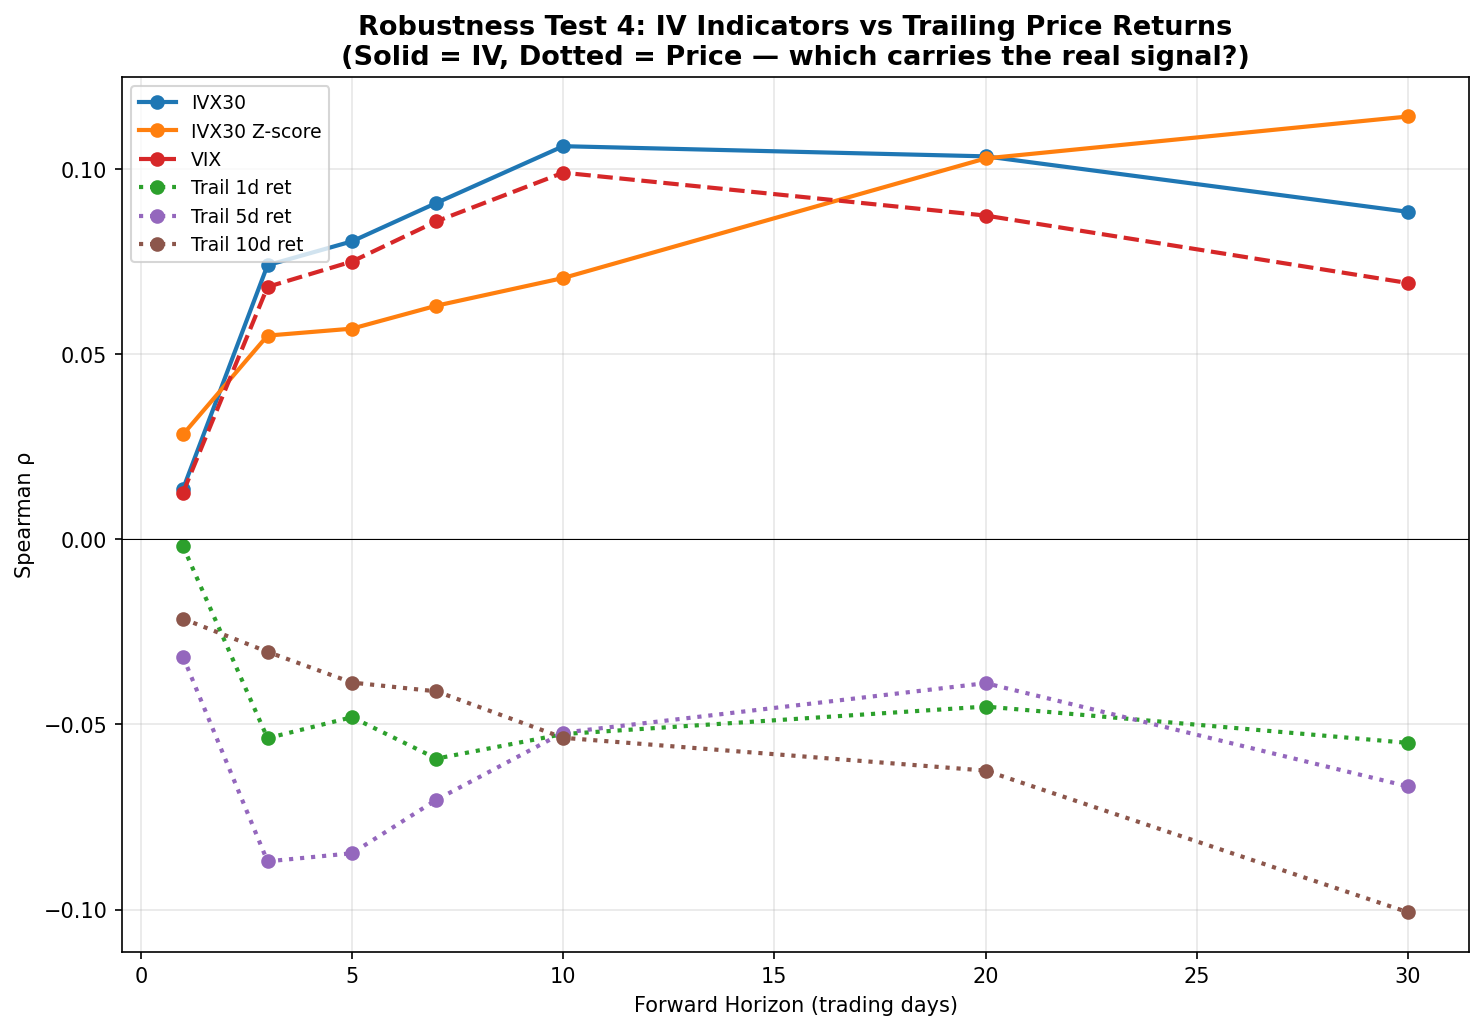
Figure 10: IV indicators (solid lines) vs trailing price returns (dotted) — correlation with SPY forward returns across horizons.
| Signal | ρ with 20d fwd | Type |
|---|---|---|
| IVX30 | +0.103 | IV indicator |
| Z-score | +0.103 | IV indicator |
| Trail 1d return | -0.045 | Price |
| Trail 5d return | -0.039 | Price |
| Trail 10d return | -0.062 | Price |
IV and trailing returns are correlated with each other (IVX30 vs trailing 5d: ρ = -0.34). When SPY drops, IV rises. So both signals partially capture the same phenomenon: mean reversion after drawdowns.
Partial correlation test: After controlling for trailing 5-day return:
- IVX30 vs fwd_20d: ρ = 0.087, p = 0.002 (reduced from 0.103)
- Z-score vs fwd_20d: ρ = 0.080, p = 0.005 (reduced from 0.103)
Verdict: IV carries some independent information beyond price momentum — the partial correlations remain significant. But roughly 15-20% of the IV signal is explained by the price drop itself. A combined signal (high IV + recent price decline) would likely outperform either alone.
8. Why SPY Differs from Individual Stocks
In our previous study of S&P 500 constituents, we found that IV/HV Ratio predicts underperformance for individual stocks with the highest cross-sectional IV/HV readings. Here we find the opposite for SPY: high IV predicts positive forward returns. These findings are not contradictory — they measure different things:
| Individual Stocks | SPY | |
|---|---|---|
| Study type | Cross-sectional (which stocks?) | Time-series (when to buy?) |
| Signal | Stock's IV/HV ratio vs all peers | SPY's IV level vs its own history |
| Finding | High relative IV → underperformance | High absolute IV → outperformance |
| Mechanism | Market overprices individual stock risk | Market overprices aggregate fear |
| Best indicator | IVX14/HV10 ratio | IVX30 level / Z-score |
For individual stocks, a high IV/HV ratio means "options are expensive relative to this stock's actual movement" — the stock is overpriced and tends to underperform. For SPY, high absolute IV means "the market is scared" — and scared markets tend to recover.
The IV/HV ratio has no predictive power for SPY (ρ ≈ -0.03, not significant). This makes sense: SPY's implied and realized vol tend to move together during market stress, so their ratio stays relatively stable. The signal for individual stocks works because it captures cross-sectional mispricing — stocks where IV has risen far above their own realized vol, regardless of the market environment.
9. Practical Implications
For Market Timers
The data supports a nuanced version of "buy the fear":
- When IVX30 is 25–35: Forward 20d returns average +3.78%, roughly 4× the low-IV baseline. But the standard deviation is also much higher — you're buying into volatility.
- The Z-score is a better entry signal than raw level. A sudden spike from 12 to 25 (high z-score) is more predictive than IV sitting at 25 for weeks.
- Don't expect instant results. The effect is minimal at 1–3 days and builds through 10–30 days. This is a multi-week mean reversion, not a day trade.
What the Robustness Tests Tell You
- Don't overstate the significance. With independent (non-overlapping) samples, the IV effect has the right sign but p ≈ 0.09–0.24. We cannot reject the null hypothesis at traditional significance levels.
- Simple price momentum works better. "Buy SPY when it's dropped 3–5% over 5 days" is a more robust signal than any IV indicator in our non-overlapping test.
- IV adds marginal value. After controlling for trailing returns, IV still contributes ρ ≈ 0.08 of independent signal. For practitioners who already use price signals, adding IV level as a confirmation filter is reasonable.
What NOT to Do
- Don't panic-sell when VIX spikes. The data shows this is exactly when forward returns are highest.
- Don't use IV/HV Ratio for SPY timing. It works for individual stocks (see our previous study) but shows no predictive power for the broad market.
- Don't treat the 2021–2025 period as universal. Five years is a short sample. The effect worked in the 2022 bear market, which is encouraging, but a proper validation requires out-of-sample testing on earlier decades.
For Further Research
- Test on longer history — does the "buy the VIX spike" effect hold through 2008, 2020 COVID, etc.?
- Combine signals — a composite of trailing 5d return + IVX30 level + Z-score might yield a stronger timing signal than any single indicator.
10. Backtest Validation: Trading the IVX30 Z-Score Signal
The statistical study above suggested that the IVX30 Z-score is a tradeable signal. We put this to the test with a full 5-year backtest (Feb 24, 2021 – Feb 23, 2026) using two different strategy implementations — directional (buy SPY shares) and volatility (sell ATM straddle). Both strategies use the same IVX30 mean IV z-score entry signal, allocate 10% of capital per trade, and exit when IV normalizes.
Methodology
- Entry signal: IVX30 mean IV z-score exceeds entry threshold (long-only — enters only on elevated IV)
- Exit signal: Z-score falls below exit threshold (IV has normalized)
- Position sizing: 10% of capital per trade
- Directional: Buy SPY shares, P&L stop-loss monitored via 1-minute intraday bars
- Straddle: Sell ATM straddle (~30 DTE), collect premium, exit on z-score reversion / profit target / expiration / stop-loss
- Optimization: Grid search over z-score entry (1.0/1.5/2.0), exit (0.1/0.3/0.5), lookback (63/84 days), and stop-loss levels
- Directional: 54 parameter combinations tested; Straddle: 36 combinations tested
SPY Buy & Hold Benchmark
| Metric | Value |
|---|---|
| Total Return | +74.18% |
| CAGR | 11.75% |
| Sharpe | 0.74 |
| Max Drawdown | -25.36% |
Directional Strategy Results (Buy SPY Shares)
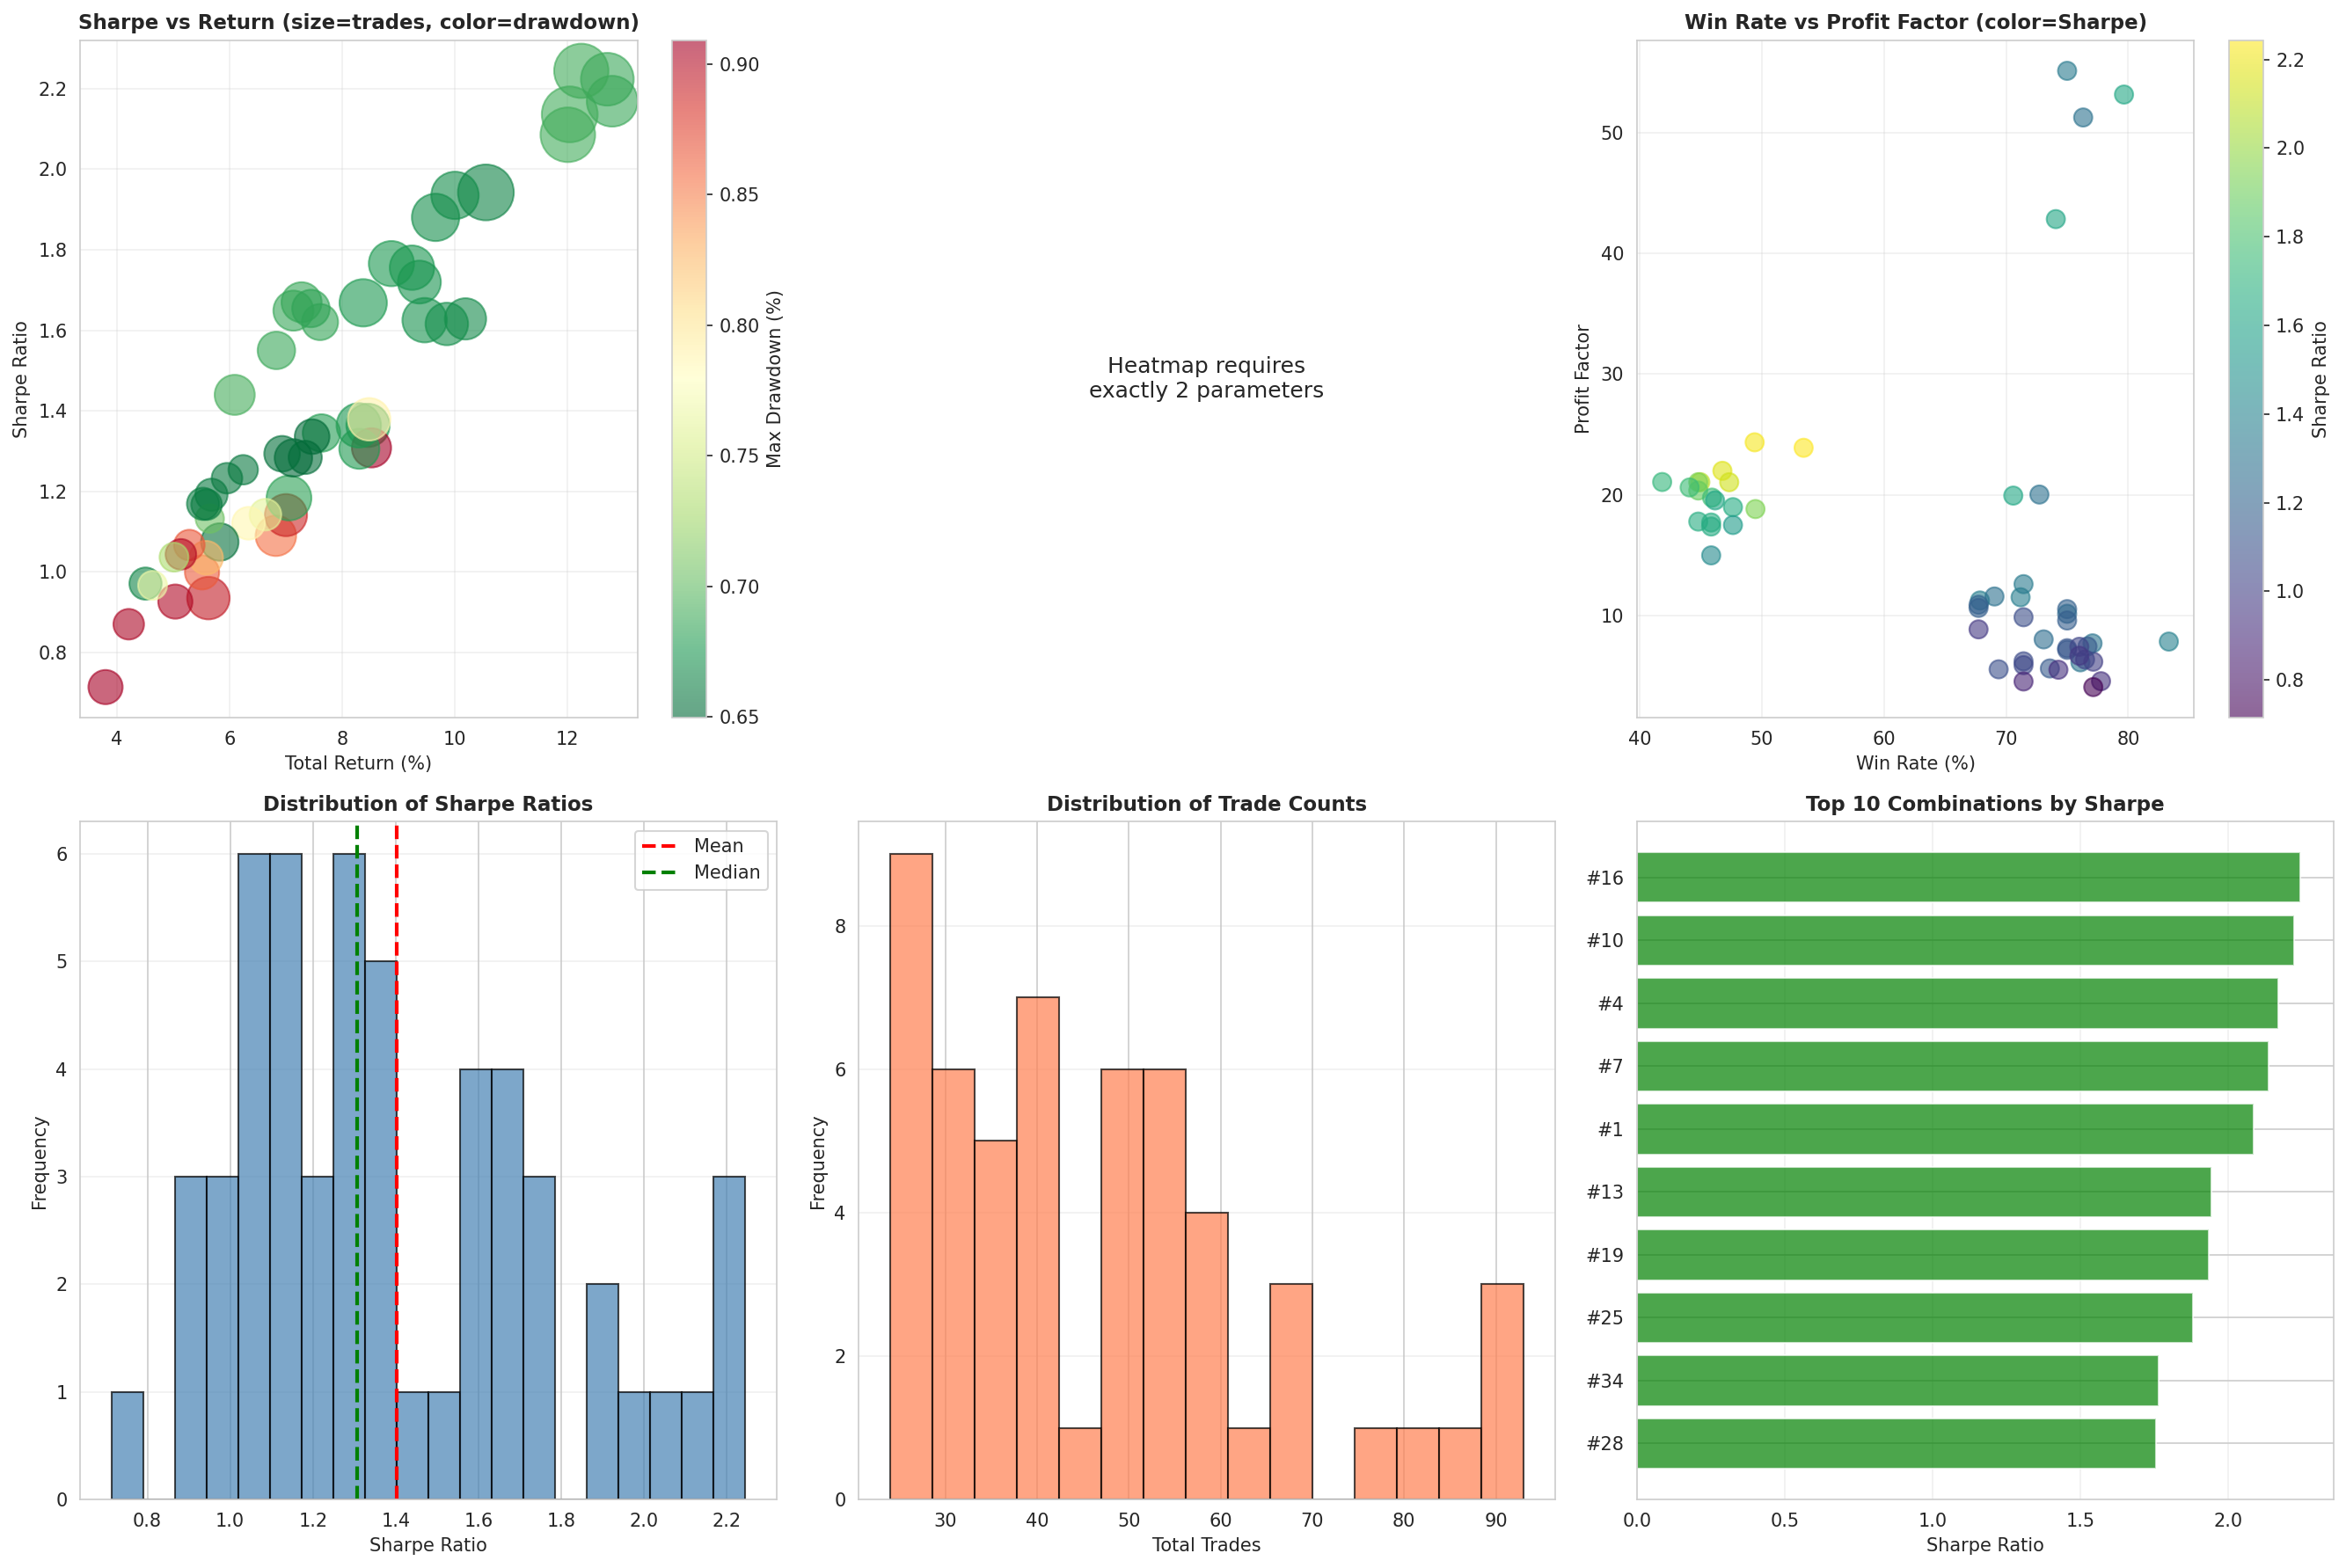
Figure 11: Directional strategy optimization results across 54 parameter combinations. Tighter stop-losses (PL 1%) achieve higher Sharpe ratios.
Best configuration: Z=1.0, exit=0.5, lookback=84 days, 5% stop-loss
| Metric | Baseline (no SL) | Best (PL 5%) |
|---|---|---|
| Total Return | +3.62% | +8.48% |
| CAGR | 0.71% | 1.64% |
| Sharpe | 0.66 | 1.38 |
| Max Drawdown | -1.08% | -0.79% |
| Win Rate | 74.1% | 83.3% |
| Total Trades | 27 | 54 |
| Avg Holding | 8 days | 8 days |
| Exposure Time | 22.4% | 27.5% |
Stop-loss dramatically improved the directional strategy: Sharpe doubled (0.66 → 1.38), drawdown fell 27%, and win rate jumped to 83%. The tightest stops (PL 1%) achieved Sharpe >2.0 with sub-0.7% drawdowns.

Figure 12: Equity curve for the best directional configuration (Z=1.0, exit=0.5, L84, PL 5%). Steady uptrend with minimal drawdowns.
#### Directional Annual Returns
| Year | SPY | Baseline (no SL) | Best (PL 5%) |
|---|---|---|---|
| 2021 | +21.23% | +1.09% | +1.73% |
| 2022 | -19.48% | +0.94% | +2.43% |
| 2023 | +24.29% | +0.41% | +0.45% |
| 2024 | +23.30% | +0.53% | +1.35% |
| 2025 | +16.35% | +0.35% | +1.95% |
| 2026 (partial) | +0.07% | +0.25% | +0.30% |
The strategy was profitable every year, including the 2022 bear market — its best year (+2.43% on 10% allocation). The signal correctly identified IV spikes as buying opportunities during the downturn.
Straddle Strategy Results (Sell ATM Straddle)
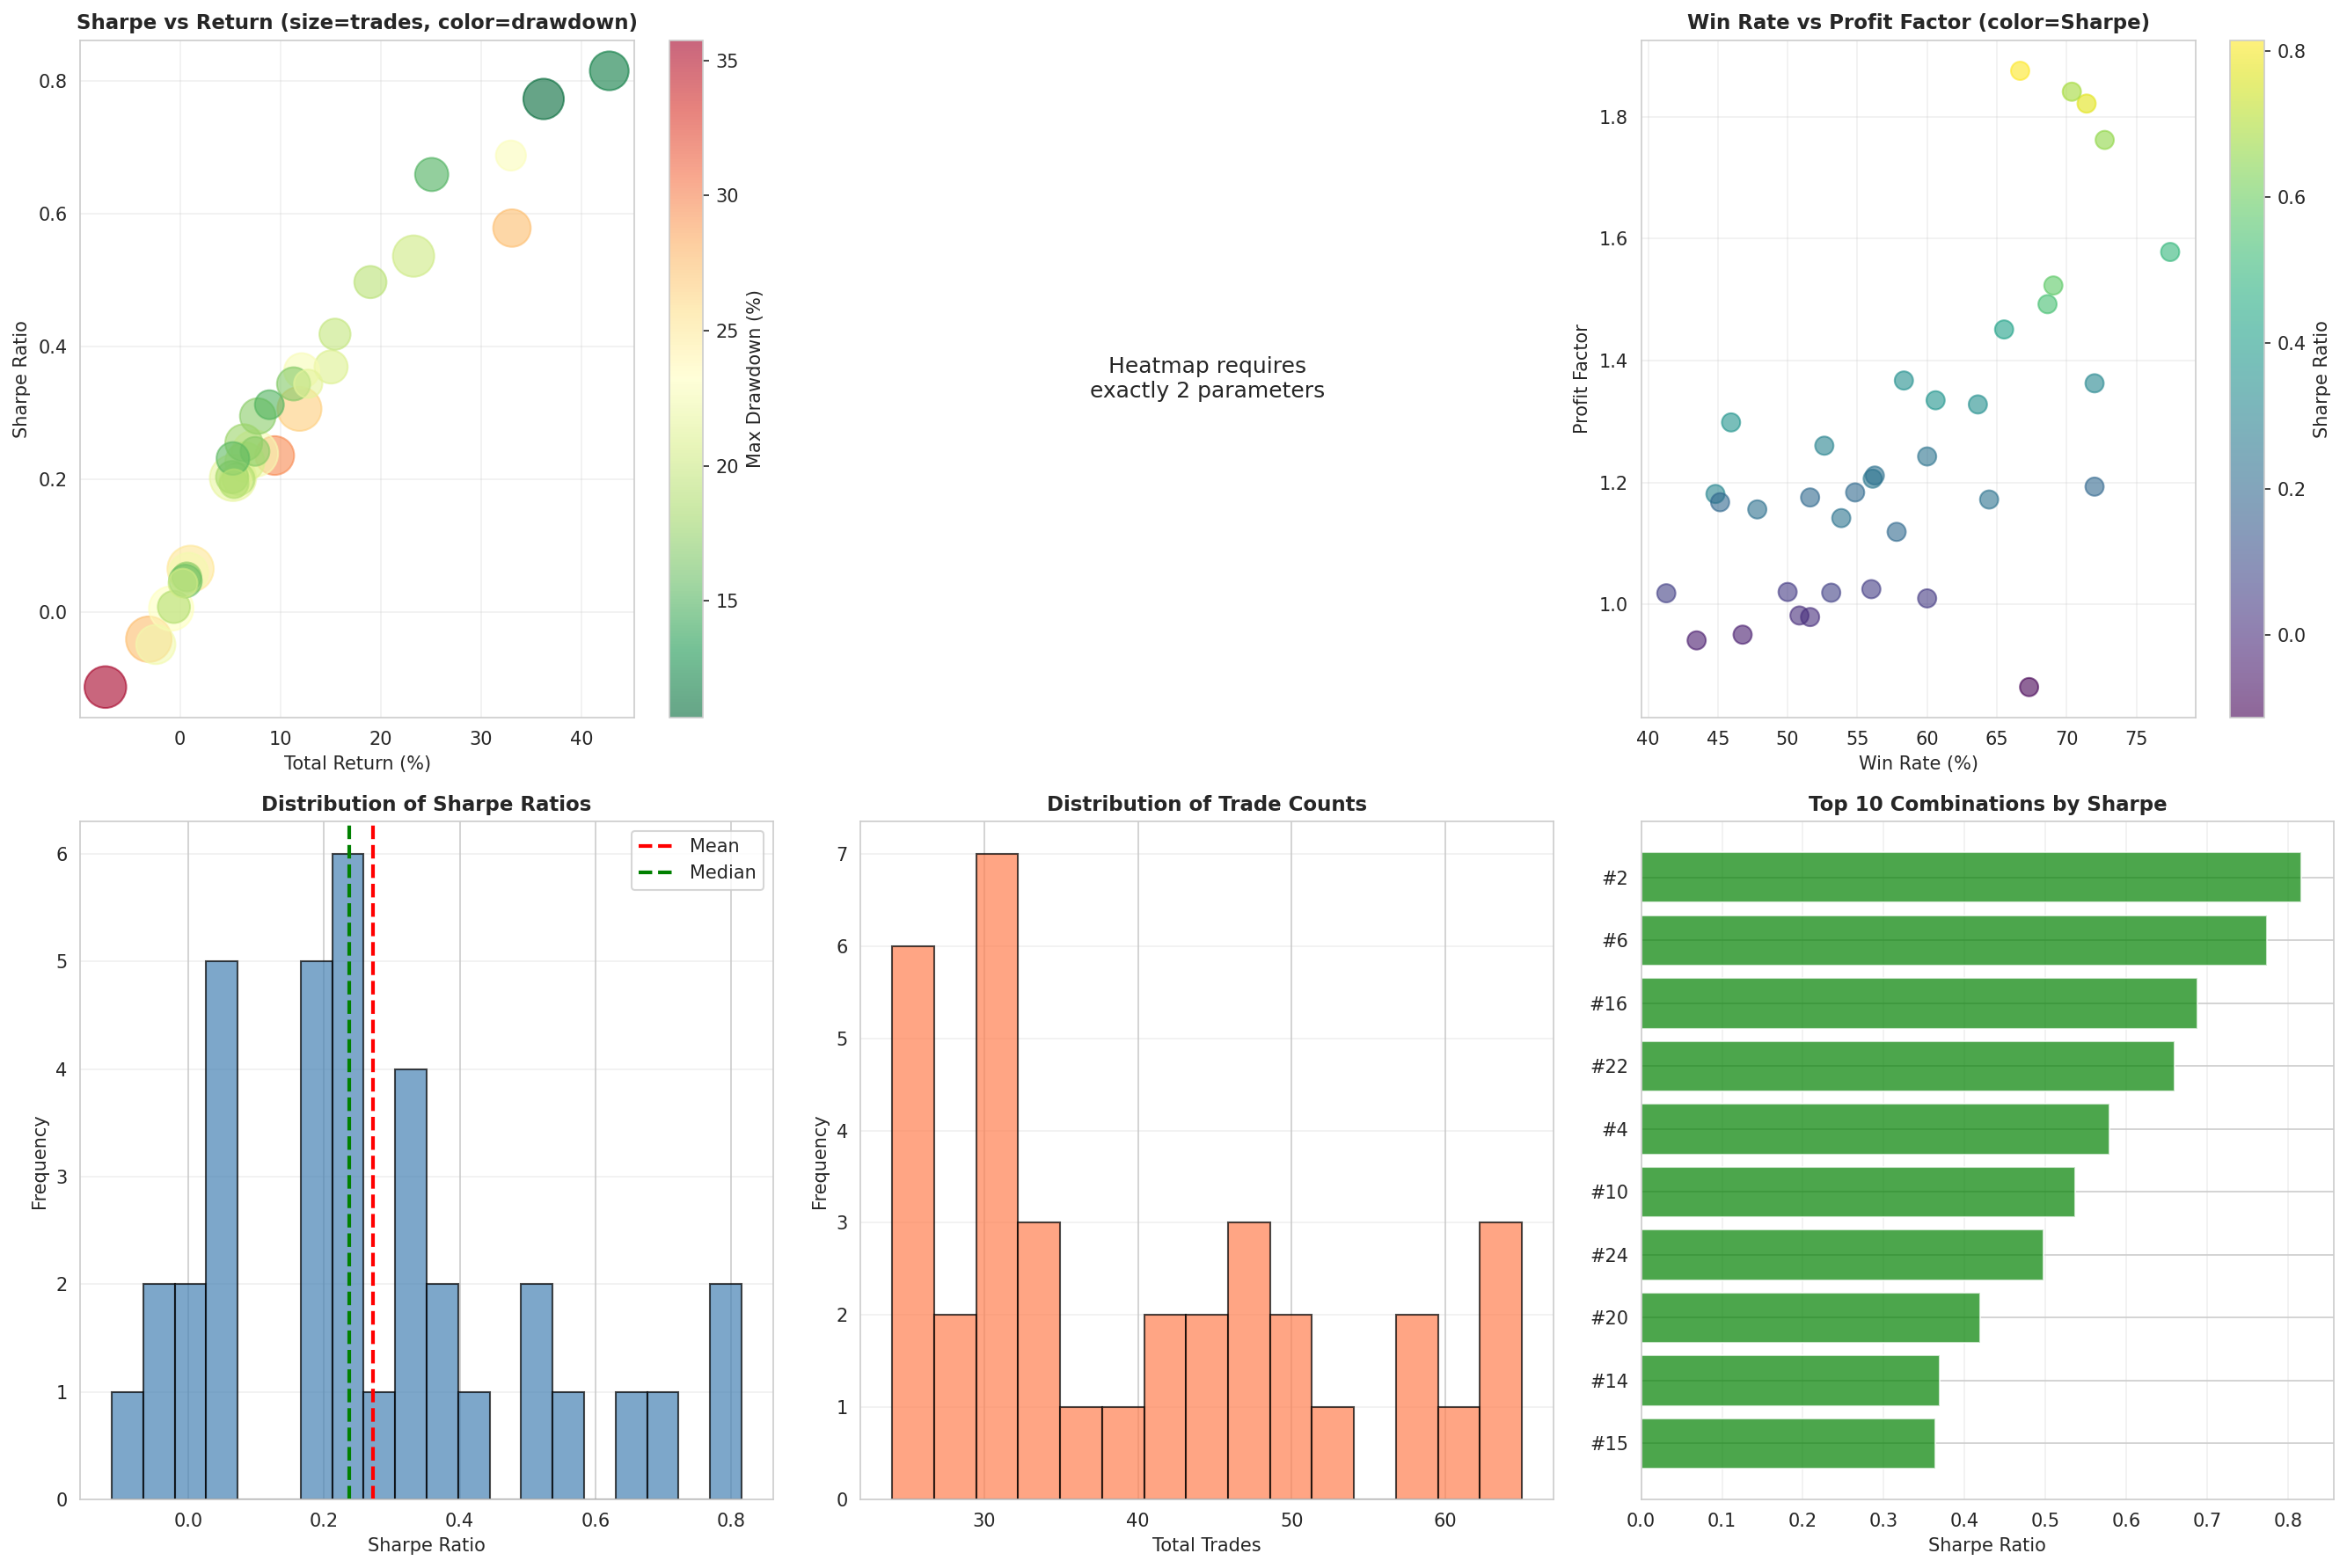
Figure 13: Straddle strategy optimization results across 36 parameter combinations.
Best configuration: Baseline — Z=1.5, exit=0.3, lookback=84 days, no stop-loss
| Metric | Baseline (no SL) | Best SL (PL 40%) |
|---|---|---|
| Total Return | +61.24% | +42.75% |
| CAGR | 10.03% | 7.38% |
| Sharpe | 1.36 | 0.82 |
| Max Drawdown | -2.27% | -11.75% |
| Win Rate | 76.9% | 66.7% |
| Profit Factor | 8.43 | 1.88 |
| Total Trades | 26 | 45 |
| Avg Holding | 15.5 days | — |
| Exposure Time | 23.5% | 38.8% |
A key finding: for straddles, stop-loss degraded performance. The no-SL baseline outperformed all 36 SL combinations. Short straddle positions have naturally bounded risk (premium received), and SL exits cut positions that would have recovered as IV collapsed. The directional strategy, by contrast, strongly benefits from SL because stock positions have unbounded downside.
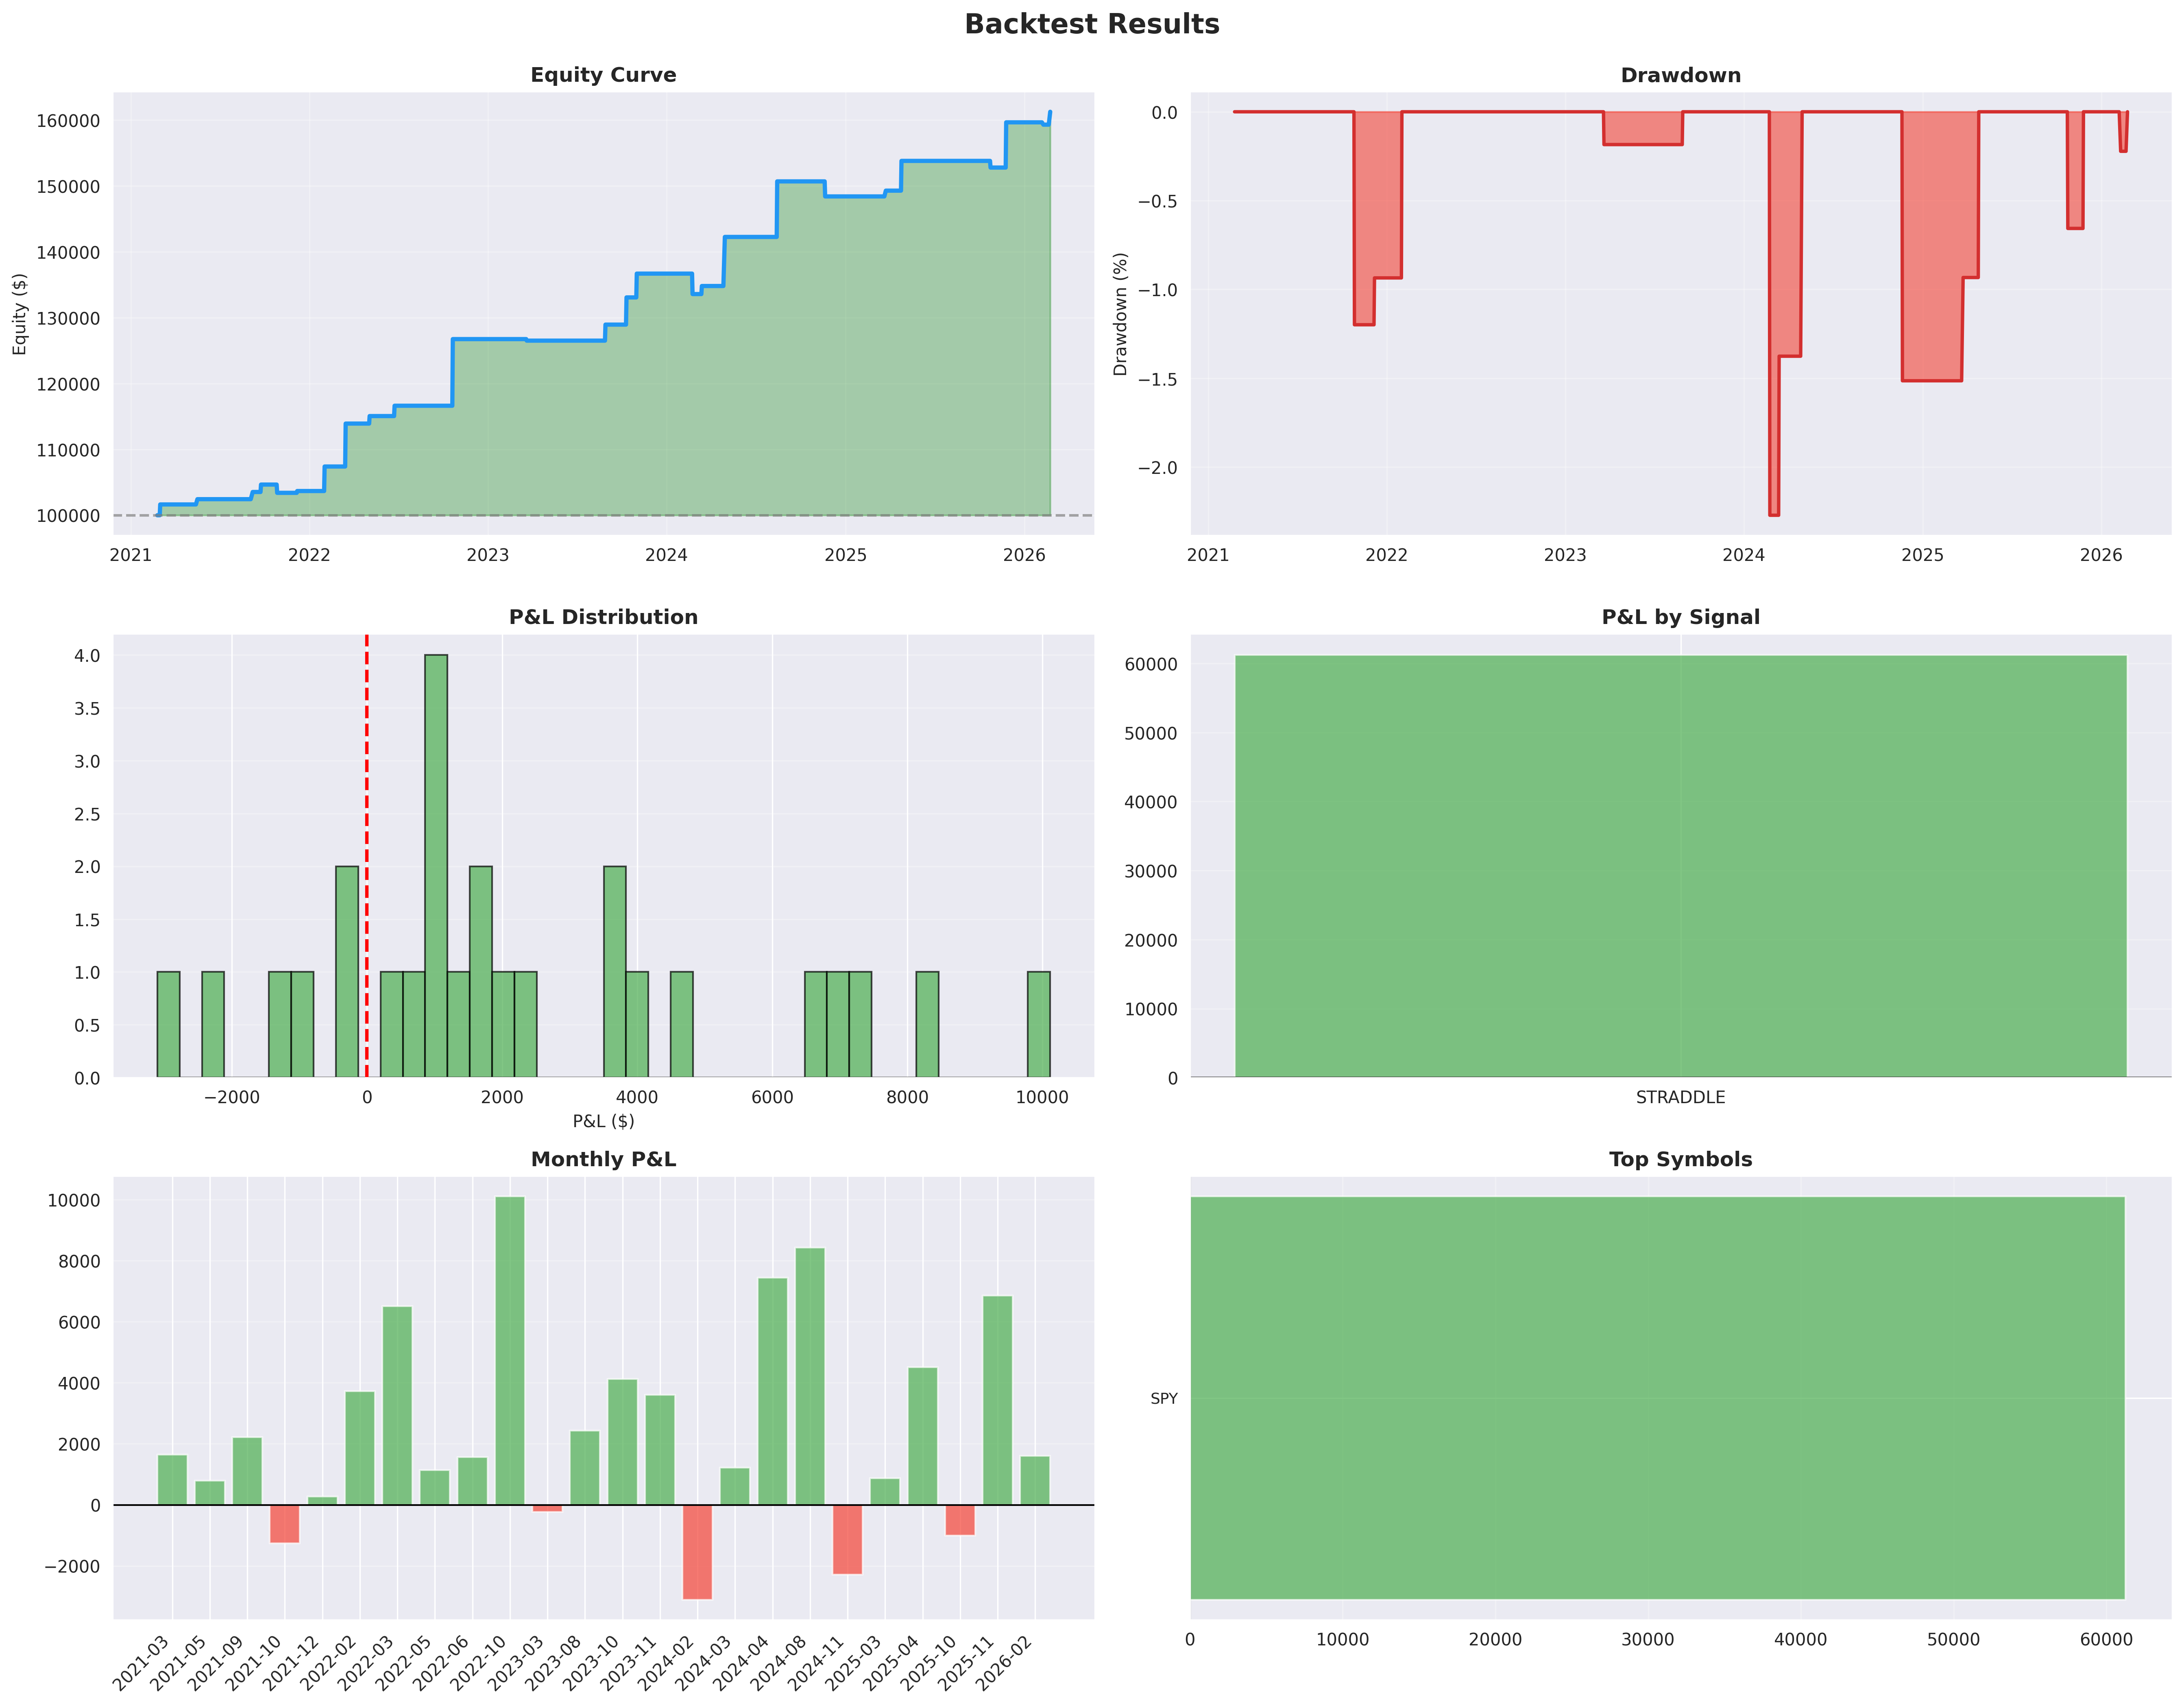
Figure 14: Equity curve for the straddle baseline (Z=1.5, exit=0.3, L84, no SL). +61.24% return with only 2.27% max drawdown over 5 years.
#### Straddle Annual Returns
| Year | SPY | Straddle Baseline |
|---|---|---|
| 2021 | +21.23% | +3.68% |
| 2022 | -19.48% | +22.24% |
| 2023 | +24.29% | +7.84% |
| 2024 | +23.30% | +8.57% |
| 2025 | +16.35% | +7.58% |
| 2026 (partial) | +0.07% | +1.00% |
The straddle earned positive returns in every year. The 2022 bear market was the standout (+22.24% on 10% allocation) as elevated IV provided rich premium to sell while the signal correctly timed entries at IV peaks.
Combined Portfolio: Strategy (10%) + SPY (90%)
Since each strategy uses only 10% of capital per trade, the remaining 90% can be held in SPY. This directly answers the question: does the signal add value over passive indexing?
| Portfolio | Total Return | CAGR | Sharpe | Max DD |
|---|---|---|---|---|
| 100% SPY Buy & Hold | 74.18% | 11.75% | 0.74 | -25.36% |
| Directional (PL5%) + 90% SPY | 75.25% | 11.88% | 0.80 | -21.46% |
| Straddle baseline + 90% SPY | 128.00% | 17.93% | 1.18 | -16.48% |
The straddle + SPY combination delivers +54% excess return over pure SPY buy-and-hold, improves Sharpe by 60% (0.74 → 1.18), and reduces max drawdown by nearly 9 percentage points. The capital efficiency is remarkable: the straddle achieves ~100% annualized return on the 10% of capital deployed, with only 23.5% time exposure.
Why Straddle Dominates Directional
Both strategies use the identical entry signal, but the straddle captures three return sources while directional captures one:
| Return Source | Directional | Straddle |
|---|---|---|
| Delta (price recovery) | Yes | Partial (via short puts) |
| Vega (IV crush) | No | Yes — primary driver |
| Theta (time decay) | No | Yes — ~15-day avg hold |
The study's core finding — that high IV predicts mean reversion — directly translates to short straddle profits via vega. When IV normalizes, the straddle position gains from the IV decline (vega) plus time decay (theta) during the 15-day average hold. The directional strategy only captures the price recovery component.
> In Part II of this study, we test an alternative entry mechanism — IV Percentile (IVP) — which measures where IV stands relative to its own history rather than how fast it spiked. We compare IVP vs Z-score as straddle entry signals and explore why rate of change outperforms level.
11. Data and Reproducibility
This study uses data from the IVolatility.com API. Three data sources were used:
/equities/stock-market-datawithsymbols=SPY— provides IVX30, IVX60, HV10, HV20, HV30, IVX30/HV20 ratio, IVR30, and IVP30.
/equities/eod/ivxwithsymbol=SPY— provides the IVX at shorter terms (7, 14, 21 calendar days) with separate Call, Put, and Mean values.
/equities/stock-market-datawithsymbols=VIX— provides the CBOE VIX close price.
Study parameters:
- Asset: SPY (SPDR S&P 500 ETF)
- Date range: February 24, 2021 – February 23, 2026
- Trading days: 1,304
- Forward horizons: 1, 3, 5, 7, 10, 20, 30 trading days
- Statistical tests: Spearman rank correlation, Welch's t-test (quintile comparison)
- Robustness: Non-overlapping returns (every 20th day), delayed entry (0–5 day lag), per-year breakdown, partial correlation controlling for trailing price return
- IVX30 Z-score: (IVX30 − 60-day rolling mean) / 60-day rolling std
The complete analysis code (spy_iv_correlation_study.py, spy_iv_robustness_tests.py), DuckDB database, and chart generation are available for reproducibility.
Disclaimer: This study is for informational and educational purposes only and does not constitute investment advice, a recommendation, or a solicitation to buy, sell, or hold any security, option, or financial instrument. Past performance and statistical findings do not guarantee future results. Options trading involves significant risk, including the potential for losses exceeding the initial investment. Always conduct your own due diligence and consult a qualified financial advisor before making any investment decisions.
Research and backtesting by IVOLAI. Analysis conducted using IVolatility.com data and API. SPY implied volatility indicators (IVX at all tenors) are calculated by IVolatility using a proprietary weighting technique factoring Delta and Vega of 8 ATM options per expiration, normalized to fixed tenors. VIX data represents the CBOE Volatility Index.