Peace Rally Pivot
April 17, 2026
Market Roundup & The Week in Review
The trading week ending April 17, 2026, was nothing short of historic. Equities charged to fresh all-time highs as a "peace rally" took hold of global markets. The primary catalyst was the unexpected news that the Strait of Hormuz—a critical artery for 20% of the world's oil—has been declared open for commercial traffic following a 10-day ceasefire.
This de-escalation probably shifted the market narrative from "inflationary war footing" to a "relief-driven recovery."
Crude oil (WTI) plummeted over 9% on Friday alone, settling near $84. This collapse in energy prices could drastically reduce the "fear premium" embedded in global logistics and consumer staples.
The 10-year Treasury yield retreated to 4.24%, suggesting that fixed-income markets are beginning to price in a less aggressive Federal Reserve if cooling energy costs help tame headline inflation.
The VIX cratered to just under 18, reflecting a massive evaporation of the hedging demand that dominated the previous month. This move suggests that the "wall of worry" might be getting easier for bulls to climb.
Strategy Corner
Based on this week's market movements, here are some trading ideas and option strategies for the readers' consideration. The positions can be scaled bigger (or smaller) to suit individual account size.
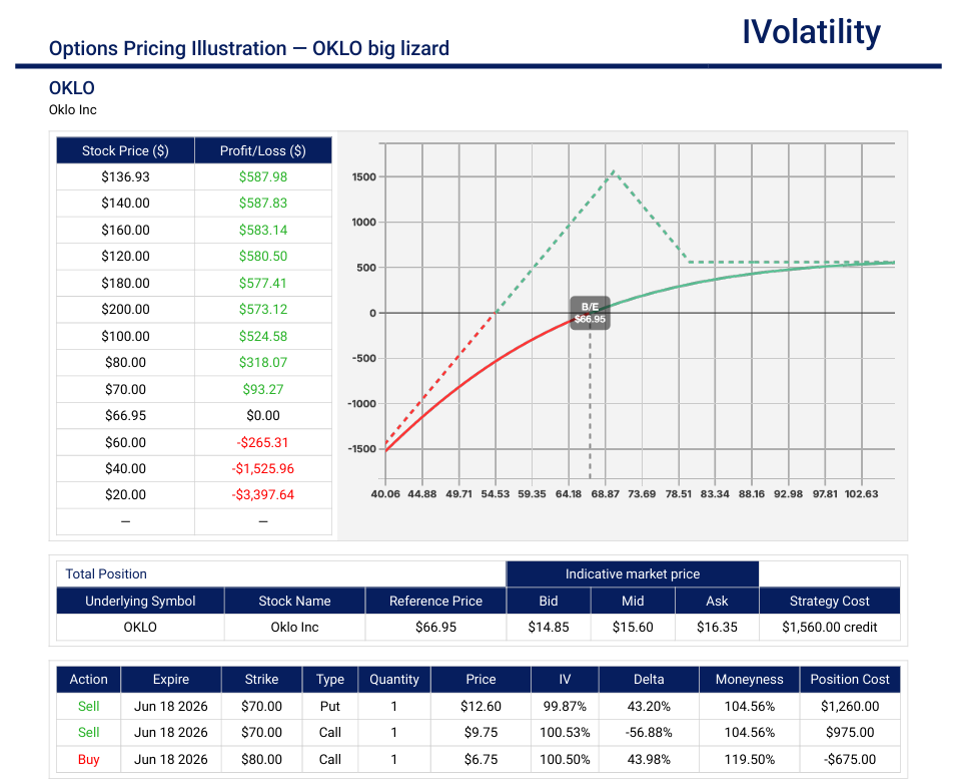
- OKLO (closed at 66.79 on Friday, Apr 17th)
Just this past Friday, the White House announced a major initiative for orbital nuclear energy by 2028 and lunar surface power by 2030. OKLO surged +4.2% on this news, as they are a primary player in the "micro-reactor" space that fits this mission perfectly. If an investor would like to stay bullish in OKLO, a big lizard strategy could be considered. - Strategy: Big Lizard with no risk to the upside
- Setup:In the June monthly expiration, SELL the 70 straddle and buy the 80call.
- Credit received: about $1600
- Probability of profit: around 63%
- Breakevens: downside risk around (70 -16) $56 and no risk to the upside since the 70/80 call spread is covered by the credit received.
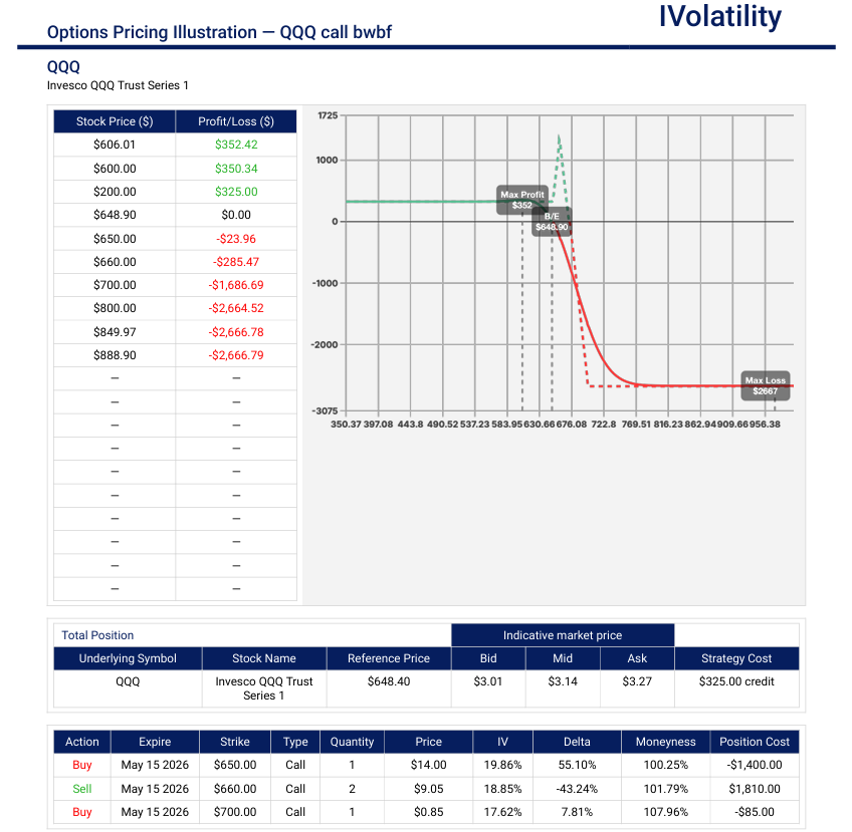
- QQQ (closed at 648.74 on Friday, Apr 17th)
The Nasdaq 100 has just come off a 9-session winning streak, pushing the index to fresh all-time highs above 26,000. The Relative Strength Index (RSI) is currently knocking on the door of 70 (overbought territory). Historically, when the QQQ rallies this hard without a "base-building" period, it becomes vulnerable to a 3–5% mean-reversion pull-back. If an investor would like to get short-term bearish, a call broken-wing butterfly could be considered. - Strategy: Call broken-wing butterfly.
- Set up: In the May monthly expiration, BUY one 660call / SELL two 670calls / Buy one 700call.
- Credit Received: $325
- Probability of Profit: 73%
- Breakevens: upside breakeven around 673 (about 25delta) and no risk to the downside.
Movement of the Major Market Indices:
| INDEX | UP | DOWN |
| SPY | 4.53% | |
| QQQ | 6.81% | |
| IWM | 5.55% | |
| DIA | 3.23% | |
| GLD | -1.12% | |
| BTC/USD | 2.45% | |
| 10-year yield | -1.85% | |
| Crude Oil | -9.0% | |
| VIX | -9.10% |
Movement of the Major Market Sectors:
The trading week ending showcased a dramatic "risk-on" rotation, with growth-oriented sectors leading the charge as geopolitical tensions eased significantly. The official reopening of the Strait of Hormuz triggered a massive wave of capital into high-beta areas that had been weighed down by the "fear premium." Conversely, the sharp drop in crude oil prices transformed the Energy sector from a top performer into the week's primary laggard.
| SECTOR | UP | DOWN |
| TECH (XLK) | 4.80% | |
| FINANCIALS (XL) | 3.10% | |
| INDUSTRIALS (XLI) | 2.90% | |
| ENERGY XLE | -4.20% | |
| HEALTHCARE (XLV) | 1.80% | |
| UTILITIES (XLU) | 0.90% | |
| MATERIALS (XLB) | 2.20% | |
| REAL ESTATE (XLRE) | 3.50% | |
| CONSUMER STAPLES (XLP) | 1.20% | |
| CONSUMER DISCRETIONARY (XLY) | 4.40% |
- Growth Leadership (XLK & XLY): Technology and Discretionary sectors were the primary beneficiaries of the peace rally. XLK soared as falling yields and strong AI-related earnings from firms like Oracle and Intel boosted valuations. XLY followed closely, as the prospect of lower fuel prices and a resilient job market probably encouraged bets on increased consumer spending.
- Energy & Defensive Retrenchment (XLE & XLU): The energy sector was the notable outlier this week. As the supply chain bottleneck in the Middle East cleared, the speculative premium in crude oil vanished, dragging down heavyweights like Exxon and Chevron. Utilities also lagged, as the rapid shift into growth names left little room for the "boring" safety of defensive yield-plays.
- Cyclical Strength (XLF, XLI, XLRE): Financials and Industrials saw steady inflows. Banks (XLF) found support from strong early Q1 earnings results, while Real Estate (XLRE) caught a tailwind from the slight pullback in Treasury yields, making mortgage-sensitive equities more attractive.
Notable gainers for the week of Apr 13th–Apr 17th:
The sudden de-escalation in Middle East tensions this week were defined by a massive surge in the Technology and Travel sectors, fueled by a "double tailwind": groundbreaking AI partnership news. As crude oil prices collapsed following the reopening of the Strait of Hormuz, sectors that are typically sensitive to energy costs—like airlines and cruise lines—saw an immediate and aggressive influx of capital. Simultaneously, the tech sector's momentum probably indicates that investors are shifting their focus back to long-term secular growth stories now that the immediate geopolitical fear premium has evaporated.
- Oracle (ORCL) skyrocketed over 29% following the announcement of a massive energy partnership with Bloom Energy to secure reliable power for its expanding AI data center network. This deal effectively allows Oracle to bypass utility grid queues, providing a significant competitive advantage in deploying AI infrastructure.
- Marvell Technology popped nearly 13% and emerged as a top performer within the Nasdaq, benefiting from intense technical buying and a broader rally in AI-powered semiconductor giants. The market probably viewed Marvell as an undervalued play in the custom-silicon space compared to its peers.
- Intel jumped over 11% and continued its strong April run after analysts raised price targets, citing the company's increasing strategic value in manufacturing and a multi-generation AI chip deal with Google. The stock reached a five-year high as investors gained confidence in its domestic foundry capabilities.
- Royal Caribbean popped over 7% as the top gainer in the Consumer Discretionary sector and led a broader rally in travel stocks. The massive drop in crude oil this week probably translated to lower operating costs for the cruise industry, prompting a sharp relief rally.
- United Airlines rose 7% as jet fuel prices tumbled. The reopening of the Strait of Hormuz probably eased concerns about a prolonged energy-driven inflation spike, which would have pressured airline margins and consumer travel budgets.
Notable losers for the week of Apr 13th–Apr 17th:
While the broader market celebrated a de-escalation in global tensions, several key sectors and individual names faced a punishing week. The primary driver of the weakness was the sharp reversal in energy prices, which effectively stripped the geopolitical risk premium from the oil and gas markets. This shift hit energy producers and chemical firms particularly hard, as investors rotated capital out of defensive inflation-hedges and into high-growth tech. Additionally, the first batch of Q1 earnings reports introduced idiosyncratic volatility, particularly in the streaming and credit-data spaces, where soft guidance overshadowed current-quarter successes.
- Dow Inc. dropped over 11% with the materials ETF being the biggest drag on the blue-chip index this week. Shares plummeted as the sharp drop in energy and commodity prices probably signaled a potential compression in average selling prices, while broader concerns about global manufacturing demand in a cooling commodity environment weighed on sentiment.
- Netflix dropped nearly 10% despite reporting a significant EPS beat—aided by a $2.8 billion termination fee from the failed WBD deal—Netflix faced its worst day in years on Friday. The stock was hammered by soft Q2 revenue guidance and the unexpected announcement that co-founder and board chair Reed Hastings will not seek reelection to the board this June.
- CF Industries shed nearly 10%. As a major producer of nitrogen-based fertilizers, CF Industries saw its shares slide in tandem with the broader energy complex. Since natural gas is a primary input for its products, the general cooling of the energy market, combined with a rotation out of inflation-shield stocks, triggered a significant sell-off.
- APA Corp. shed nearly 9% being the primary victim of the oil market's 10% weekly decline. With the Strait of Hormuz reopened, the urgent demand for non-Middle Eastern oil supplies cooled, leading investors to pull back from domestic producers that had previously been used as a hedge against supply chain disruptions.
- Valero Energy dropped 8.5% as refiners were caught in the crosshairs of the energy market's peace rally. Valero faced pressure as the collapse in crude prices often precedes a period of margin volatility, and investors shifted away from the energy-heavy trade that dominated the first quarter of the year.
Review selected market indices below:
Daily Notable Market Action
The trading week was a dramatic narrative of geopolitical whiplash. Markets opened on Monday with a sense of dread as weekend peace talks collapsed, sending the VIX surging and oil back above $100. However, the tide turned mid-week as diplomatic off-ramps emerged, culminating in Friday's historic news that the Strait of Hormuz has completely reopened to commercial traffic. This de-escalation probably acted as a massive coiled spring for equities, allowing the S&P 500 and Nasdaq to notch back-to-back record highs to close the week.
Monday's Markets and News:
Markets opened the week under significant pressure after weekend negotiations between the U.S. and Iran in Pakistan ended without an agreement. The implementation of a U.S. naval blockade on Iranian ports sent Crude Oil (WTI) back above $100/bbl, unsettling investors who feared a return to peak-conflict inflation levels. Goldman Sachs (GS) fell over 4% following its earnings report, dragging the financials lower, while energy stocks were the sole green shoot in a sea of red.
Tuesday's Markets and News:
A shift in tone occurred as President Trump suggested Tehran was open to a deal, sparking hopes for a diplomatic off-ramp. Tech led a modest recovery rally, with the Nasdaq posting its 10th consecutive winning session. In corporate news, United Airlines (UAL) and American Airlines (AAL) surged on reports of a potential merger pitched by United's CEO, while Amazon (AMZN) announced an $11.5 billion deal to acquire Globalstar.
Wednesday's Markets and News:
Optimism hit a fever pitch as mediators moved closer to extending a ceasefire. The S&P 500 crossed the 7,000 threshold for the first time in history, and the Nasdaq followed with its own record close. Bank of America (BAC) and Morgan Stanley (MS) provided a boost to the financial sector with strong earnings, while retail investors cheered new SEC day-trading rules that sent Robinhood (HOOD) up over 10%.
Thursday's Markets and News:
The rally solidified as the White House expressed openness to a long-term ceasefire extension. Despite Brent crude remaining near $99, stocks continued to climb as investors focused on corporate resilience. Strong profit reports across the board helped offset firming Treasury yields, and the S&P 500 secured its 11th gain in 12 days.
Friday's Markets and News:
The week culminated in a Peace Rally following the official reopening of the Strait of Hormuz. This news triggered a 9% collapse in Crude Oil, which traded back down to the $82-$84 range. While the broader market reached new all-time highs, Netflix (NFLX) was a notable outlier, falling 10% on soft guidance and the news that Reed Hastings would step down from the board. The VIX retreated toward 17, suggesting a massive evaporation of the "fear premium."
Notable Earnings (Apr 20th–Apr 24th)
Earnings season moves into high gear next week, shifting focus from the major financial institutions to heavyweight growth names and industrial giants. Following the volatile reaction to Netflix this week, investors will be looking for confirmation that high valuations are supported by both bottom-line beats and robust forward guidance. With energy prices cooling, the focus for the week probably shifts to how AI infrastructure spending is translating into revenue for the broader tech ecosystem and how industrial leaders are navigating the stabilization of global trade routes.
The actual earnings date may vary, so traders should confirm with their brokers. If a trader wishes to open a position to participate in earnings announcements, it is important to check whether the earnings are released BEFORE the markets open or AFTER the markets close on the date of earnings.
Monday, Apr 20th: no notable company is reporting
Tuesday, Apr 21st: UNH / GE / MMM / ISRG
Wednesday, Apr 22nd: TSLA / BA / T / IBM / NOW / LRCX
Thursday, Apr 23rd: INTC / BX / CAT / HON / TMO / GOOGL / MSFT
Friday, Apr 24th: PG / AXP / SLB
Economic Calendar (April 20th – April 24th:)
The economic slate next week is relatively light on top-tier "Fed-moving" data, which may allow corporate earnings to remain the primary driver of price action. However, the Friday release of the PCE Price Index—the Federal Reserve's preferred inflation gauge—will be the critical pivot point for interest rate expectations.
The daily schedule of notable economic data releases is:
Monday: Leading Economic Indicators (LEI)
Tuesday: New Home Sales
Wednesday: Crude Oil Inventories; Fed Beige Book
Thursday: Weekly Jobless Claims; Durable Goods Orders; Pending Home Sales
Friday: PCE Price Index (Inflation Data); University of Michigan Consumer Sentiment (Final)
Blue Sky Horizons
The "Lithium Loop" and the Rise of Circular Mining
While the market spent the week obsessing over the flow of oil through the Middle East, a more quiet but perhaps more profound shift is occurring in the high-desert of Nevada – the birth of the "Lithium Loop", an industrial initiative aimed at creating a completely domestic, closed-loop battery economy.
For decades, the "extractive" model of investing—dig up something, use it, and discard it—has been the gold standard. However, the next decade of infrastructure probably belongs to circular mining.
Current industry leaders like Redwood Materials are no longer just recycling companies; they are essentially becoming urban miners. They are proving that it is now possible to recover over 95% of the critical metals (lithium, cobalt, nickel, and copper) from old EV batteries and consumer electronics to feed directly back into the start of the supply chain.
As geopolitical tensions make traditional trans-oceanic shipping riskier and more expensive, localized supply chains that don't leave the continent offer a massive margin of safety for manufacturers. Companies like Tesla and 6K are moving toward "additive manufacturing" and modular battery plants that can be co-located with these recycling hubs.
In the 20th century, wealth was built by those who controlled the source of the commodity (the oil well). In the mid-21st century, the most significant ripples in the global industry might come from those who control the loop—the ability to keep the same molecule of lithium working in the economy for 50 years.
Questions / Comments
We're here to serve IVolatility users and we welcome your questions or feedback about the option strategies discussed in this newsletter. If there is something you would like us to address, we're always open to your suggestions. Use support@ivolatility.com.
Previous issues are located under the News tab on our website.