Bulls Run Wild as a Late Summer Rally Ignites
By Fauzia Timberlake, personal coach for trading options
August 10, 2026
Week in Review
U.S. equities surged during the week, lifted by strong corporate earnings reports and a soft jobs report that scaled back fears of aggressive Federal Reserve tightening. Growth, semiconductor, and AI-linked equities led the charge following upbeat guidance from major market players.
Treasury yields moved lower across the curve as cooling labor market indicators—highlighted by an unexpected contraction in nonfarm payrolls and an uptick in the unemployment rate—reinforced expectations for a more patient monetary policy approach. The benchmark 10-year U.S. Treasury note yield eased to 4.65% by Friday's close, down 3 basis points on the session and reflecting strong demand for safe-haven fixed income assets.
Commodity markets experienced downward price pressure, primarily driven by easing geopolitical risk premiums. Crude oil futures retreated notably over the week as tensions surrounding the Strait of Hormuz cooled and supply concerns alleviated. Industrial metals and agricultural commodities also saw subdued trading as global growth crosscurrents kept speculative buying in check.
Digital assets experienced a volatile yet resilient week, tracking broader risk-on sentiment across global technology sectors. Major tokens hovered within established ranges, digesting macroeconomic data prints while finding support from steady institutional product inflows and expanding digital asset derivatives volume.
Strategy Corner
Based on this week's market movements, here are some trading ideas and option strategies for the readers' consideration. The positions can be scaled bigger (or smaller) to suit individual account size.
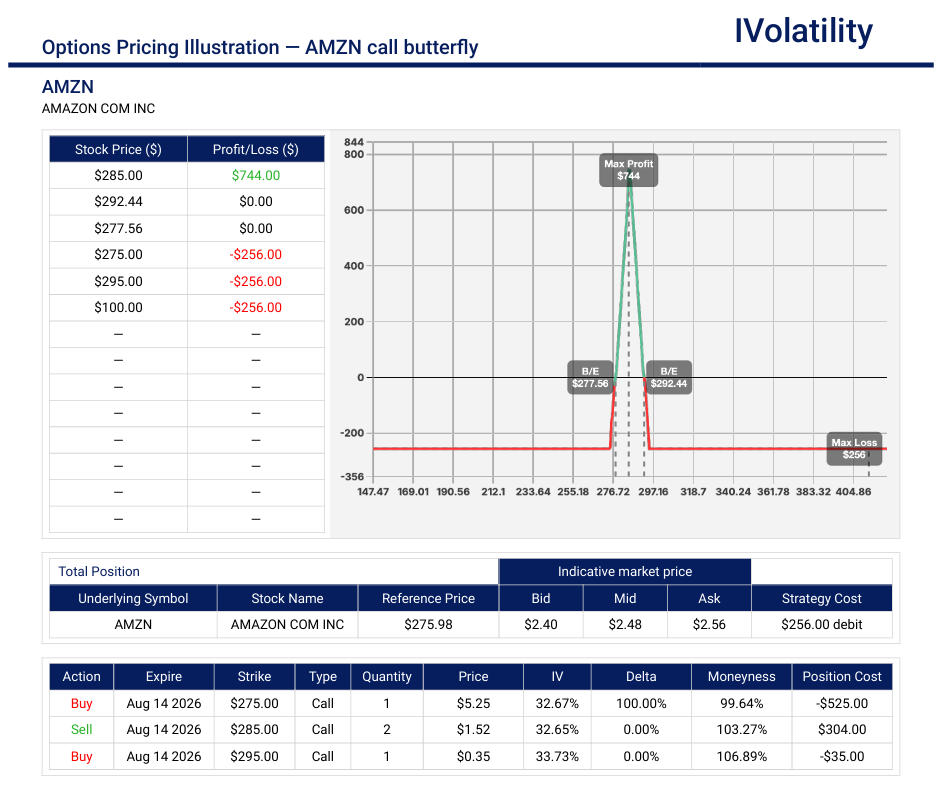
AMZN (closed at 274.45 on Friday, Aug 6th)
If a trader is bullish on AMZN in the short-term, then a call butterfly could be opened.
This is a low probability, high payout strategy.
- Structure: In the Aug14 expiration, buy one 275 Call / Sell two 285 Calls / Buy one 295 Call
- Net Cost about $250 / butterfly
- Max Profit about $750 / butterfly (if UL pins 285 at expiration)
- Max Risk limited to the debit paid
- Downside Breakeven around $277.50
- Upside Breakeven around $292.50
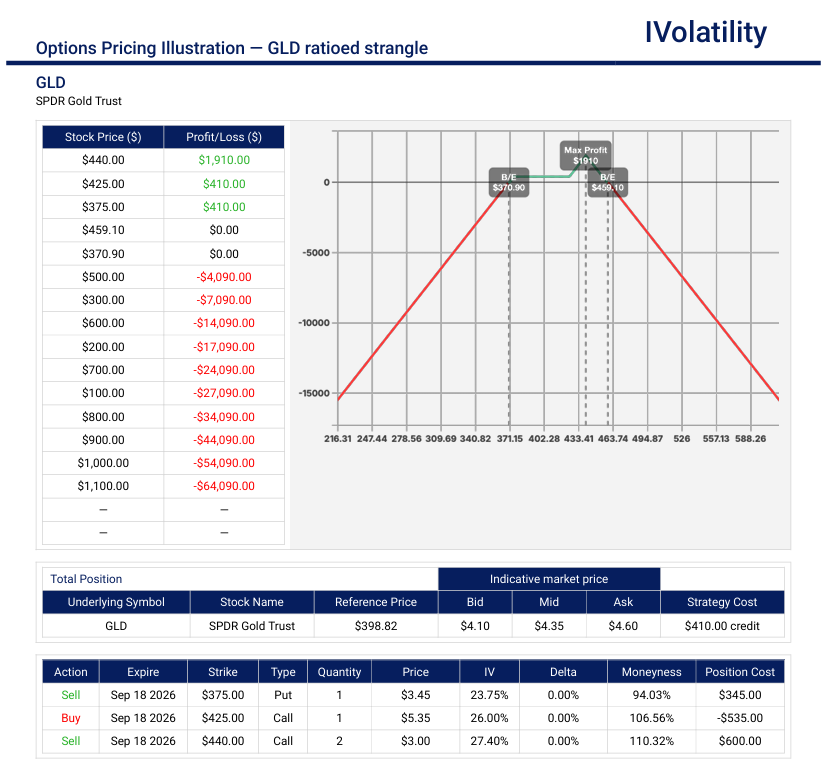
GLD (closed at 398.48 on Friday, Aug 7th)
If a trader believes that a neutral to bullish position in GLD is suitable for the near future, then a Sept ratioed strangle could be opened. This is a high probability strategy with a neutral strangle combined with a long call spread to capture any sharp upside moves.
- Structure: In the Sep18 expiration, sell one 375/340 strangle and buy one 425/440 call spread
- Net Premium about $410
- Max Profit about $1910 (if UL pins 440 at expiration)
- Downside Breakeven around $371
- Upside Breakeven around $459
Movement of the Major Market Indices:
| INDEX | UP | DOWN |
| SPY | 3.37% | |
| QQQ | 5.11% | |
| IWM | 3.38% | |
| DIA | 1.90% | |
| GLD | 6.30% | |
| BTC/USD | 3.12% | |
| 10-year yield | -0.21% | |
| Crude Oil | -3.76% | |
| VIX | -7.11% |
Movement of the Major Market Sectors:
| SECTOR | UP | DOWN |
| TECH (XLK) | 8.02% | |
| FINANCIALS (XL) | 0.54% | |
| INDUSTRIALS (XLI) | 2.62% | |
| ENERGY XLE | -2.03% | |
| HEALTHCARE (XLV) | 1.25% | |
| UTILITIES (XLU) | 1.42% | |
| MATERIALS (XLB) | 4.18% | |
| REAL ESTATE (XLRE) | -0.22% | |
| CONSUMER STAPLES (XLP) | -0.93% | |
| CONSUMER DISCRETIONARY (XLY) | 1.89% |
Notable Gainers Week of Aug 3rd – Aug 7th
The heavy outperformance concentrated in some names pointed to several distinct underlying market dynamics for the week.
- Intense Earnings-Driven Re-Pricing
- Broadening Out of Tech Leadership
- Confidence in Corporate and Consumer Resilience
Atlassian Corp. (TEAM): Advanced 47.6% as robust enterprise software demand and aggressive institutional buying propelled tech and growth leadership following recent quarterly results.
Palantir Technologies Inc. (PLTR): Surged 39.8% as heavy momentum in artificial intelligence platforms and expanding government and commercial contracts drove aggressive buying across software equities.
WPP PLC (WPP): Climbed 36.3% as strong institutional accumulation and positive sector reallocation flows helped media and advertising shares rebound sharply.
Paycom Software Inc. (PAYC): Gained 31.1% following strong operational updates and broad-based buying pressure across cyclical software and human capital management names.
Shopify Inc. (SHOP): Rallied 29.4% as upbeat consumer spending resilience and heavy growth-sector momentum lifted major e-commerce platforms.
Notable Losers Week of Aug 3rd – Aug 7th
The sharp pullbacks point to several distinct underlying stress points and shifting priorities in the market:
- Zero Tolerance for Operational Missteps
- Sector-Specific De-Risking
- Cautious Realities in Discretionary & Ad-Tech
Cogent Communications Holdings Inc. (CCOI): Declined 26.5% as weak sector data and ongoing profit-taking weighed heavily on communications infrastructure providers.
TripAdvisor Inc. (TRIP): Fell 23.9% as cautious consumer travel spending indicators and soft forward guidance triggered broad institutional liquidations.
The Trade Desk Inc. (TTD): Slumped 23.5% following C-suite restructuring updates and disappointing forward revenue guidance that sparked aggressive selling across ad-tech.
DaVita Inc. (DVA): Dropped 23.5% as defensive healthcare rotation took a back seat to aggressive high-beta tech buying, leading to sharp capital outflows.
Western Digital Corp. (WDC): Retreated 18.2% amid diverging quarterly reports and cyclical profit-taking across digital storage and memory hardware names.
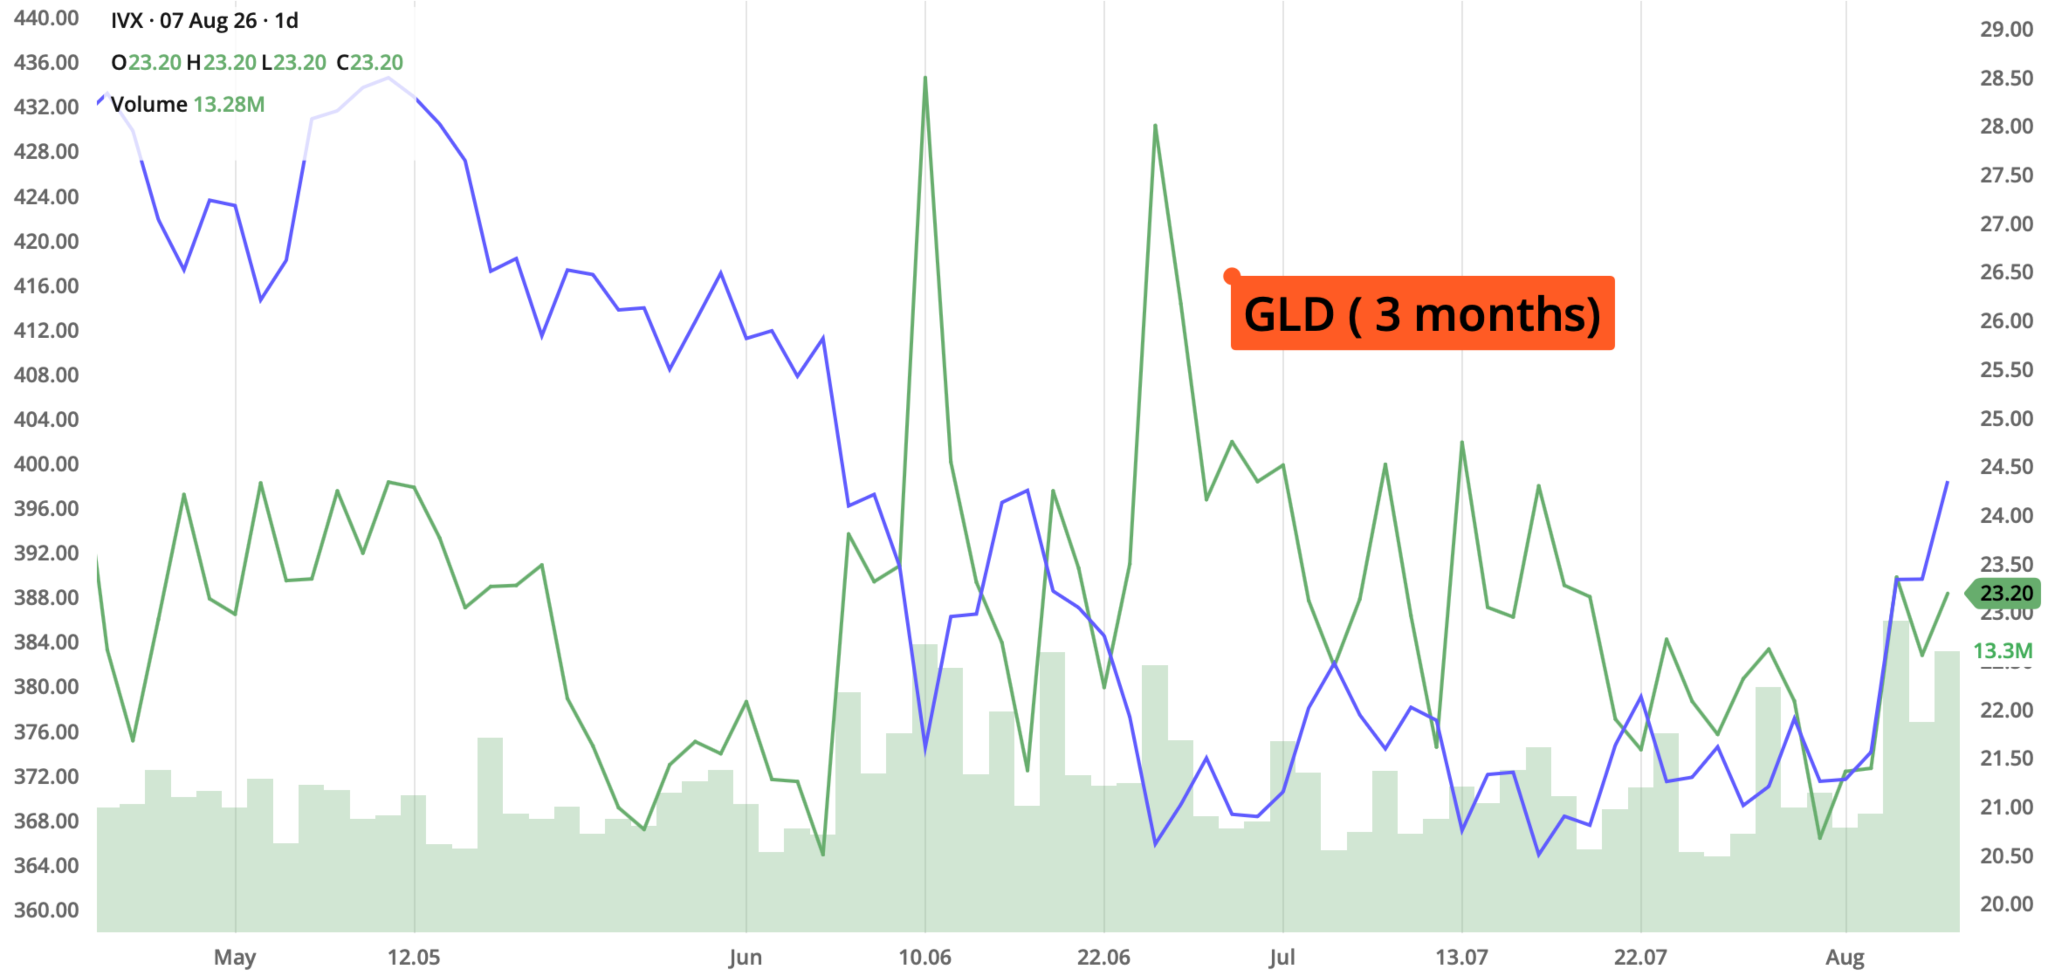
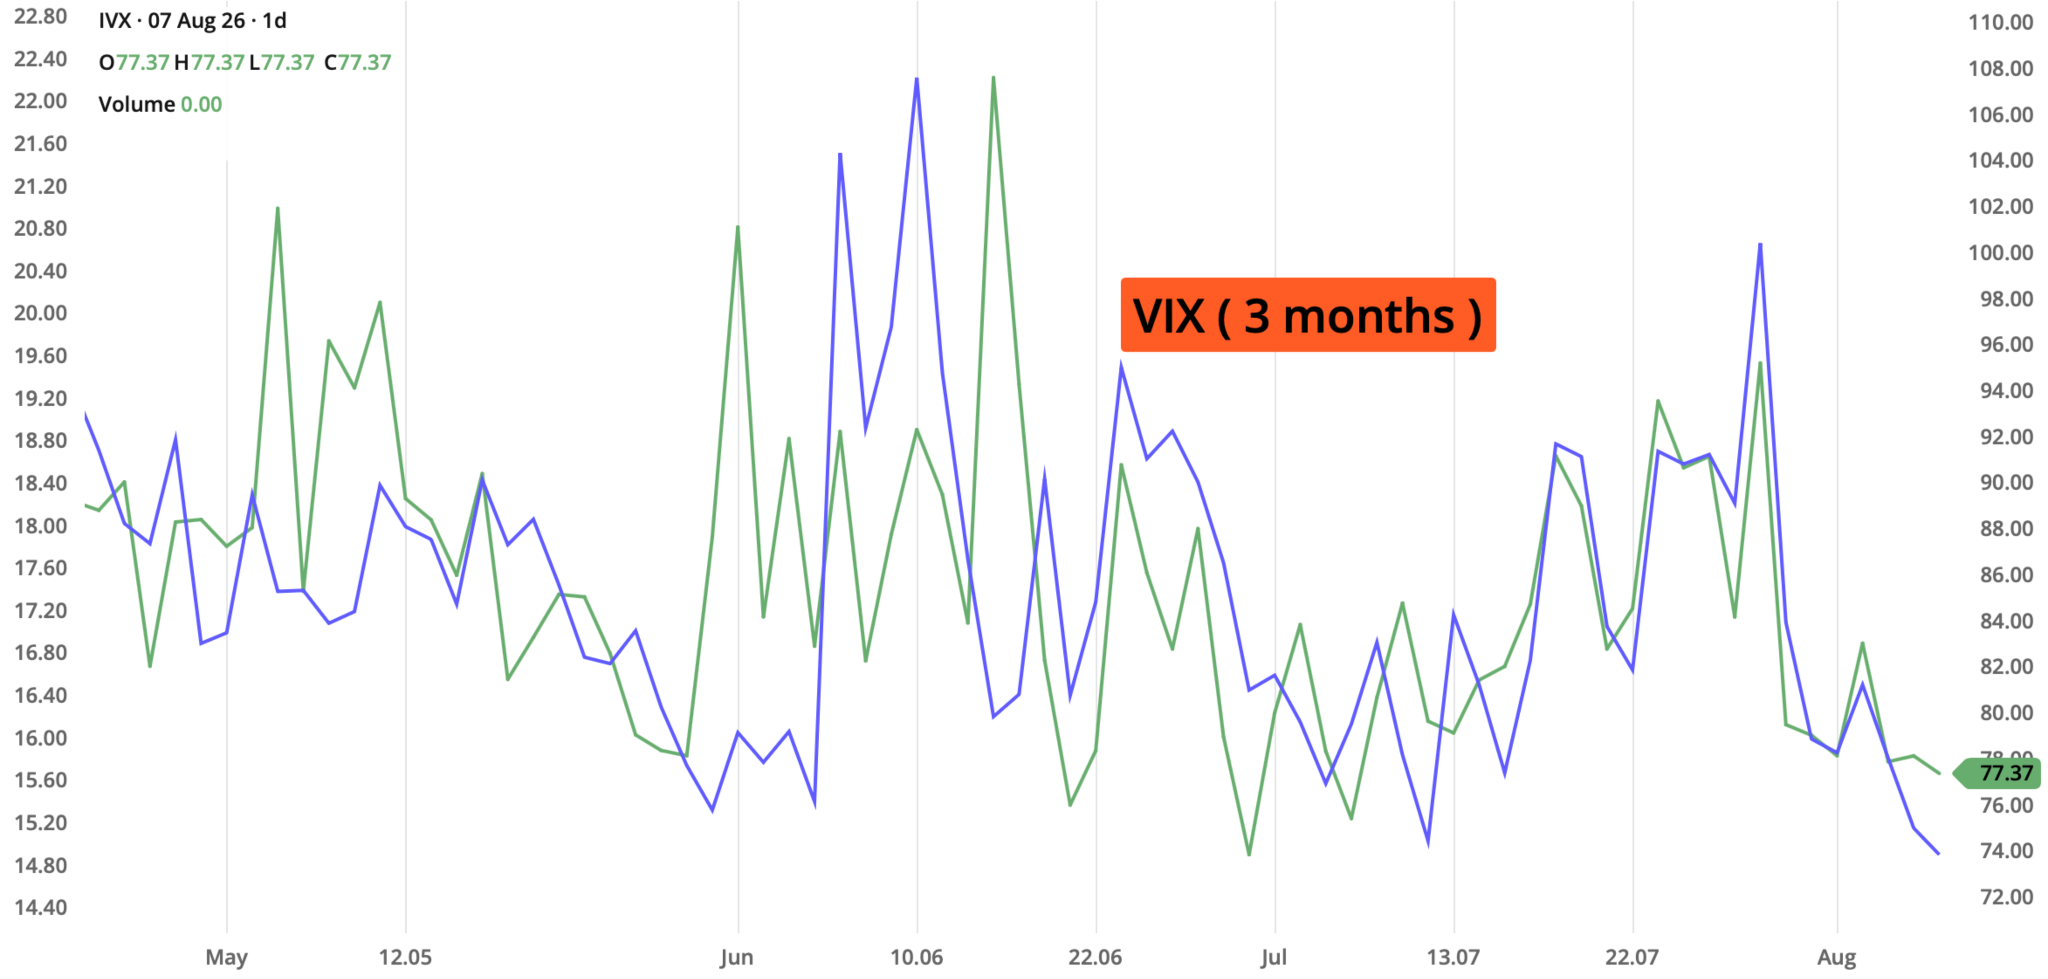
Review selected market indices below:
Daily Notable Market Action
Market Summary for Monday, Aug 3rd
US equities opened the week on a firm, constructive footing. Technology and growth shares led the charge, driving major indices higher as investors continued to digest strong corporate earnings follow-through and position ahead of key macro data releases.
Treasury yields experienced subtle downward pressure as bond markets balanced growth evaluations against expectations for future monetary policy adjustments, providing mild relief to duration-sensitive sectors.
Crude oil faced a sharp pullback, with Brent crude sliding more than 5% toward $83 a barrel as easing geopolitical risk premiums and diplomacy headlines provided a disinflationary tailwind. Meanwhile, gold remained exceptionally resilient, holding near record territory above $4,060 an ounce as investors maintained macro hedges.
Bitcoin traded in a steady, range-bound posture near $62,500, reflecting a consolidation phase rather than aggressive directional speculation as crypto continued to act as a measured risk proxy.
- S&P 500: 7,489.72 (+0.85%)
- Nasdaq Composite: 25,373.85 (+1.00%)
Market Summary for Tuesday, Aug 4th
U.S. equities surged powerfully to fresh record highs, fueled by an ongoing wave of stronger-than-expected corporate profits (notably led by explosive artificial intelligence and industrial reports) and substantial easing in oil prices. Growth and semiconductor heavyweights heavily outperformed, driving broad-based momentum across major indices.
Treasury yields experienced a notable downward pull as sliding energy costs eased broader inflationary anxiety. The 10-year Treasury yield retreated to 4.62%, providing welcome relief to duration-sensitive equities and borrowing costs.
Crude oil faced steep downward pressure, with international benchmark Brent crude plunging over 5% to fall below $80 per barrel amid diminishing geopolitical risk premiums. Meanwhile, precious metals held firm as safe-haven demand balanced against a shifting macro rate landscape.
Cryptocurrencies consolidated in an orderly range, mirroring the traditional markets' risk-on appetite while maintaining steady underlying participation.
- S&P 500: 7,736.52 (+1.80%)
- Nasdaq Composite: 26,584.99 (+2.60%)
Market Summary for Wednesday, Aug 5th
U.S. equities pulled back in a relatively subdued, mixed session, pausing to consolidate after back-to-back record-shattering rallies. Mega-cap tech names faced localized profit-taking and weighed on the indices, though strong individual earnings reports (such as consumer discretionary and travel platforms) kept underlying sentiment constructive.
Treasury yields stabilized with a slight upward tilt as bond markets digested incoming labor data and weighed the broader path of future monetary policy adjustments.
Crude oil prices ticked higher as traders continued to monitor shifting geopolitical headlines and supply dynamics in the Middle East. Meanwhile, gold and safe-haven assets held steady as investors balanced strong equity earnings against macro crosscurrents.
Cryptocurrencies traded sideways in an orderly consolidation pattern, tracking the broader market's cautious mid-week pause.
- S&P 500: 7,723.55 (-0.20%)
- Nasdaq Composite: 26,363.44 (-0.84%)
Market Summary for Thursday, Aug 6th
U.S. equities edged lower in a cautious session as investors paused to digest a fresh batch of corporate earnings reports and positioned cautiously ahead of the upcoming monthly jobs report. Energy stood out as a lone bright spot, benefiting from rebounding crude prices, while broader indices experienced minor profit-taking from record territory.
Treasury yields saw light upward pressure as bond traders weighed incoming economic indicators and employment expectations ahead of Friday's critical payroll data.
Crude oil rebounded sharply, climbing back above key support levels as supply tightening concerns and shifting inventory data spurred fresh buying. Meanwhile, gold and precious metals maintained an orderly bid as safe-haven demand held steady.
Cryptocurrencies traded in a tight, range-bound pattern, showing minimal directional conviction as participants awaited broader macro catalysts.
- S&P 500: 7,709.96 (-0.18%)
- Nasdaq Composite: 26,348.35 (-0.06%)
Market Summary for Friday, Aug 7th
U.S. equities rallied sharply to close out the week following the release of an unexpectedly soft employment report showing job cuts, which fueled strong market optimism that aggressive Federal Reserve rate hikes can remain on hold. Mega-cap technology and semiconductor leaders spearheaded the advance, propelling major indices to fresh milestone records.
Treasury yields dropped significantly across the curve in response to the weaker-than-expected jobs data. The 10-year Treasury yield slid down toward 4.64%, providing an immediate relief valve for borrowing costs and valuation multiples.
Crude oil staged a notable intraday reversal, trimming earlier weekly losses after fresh reports of localized naval skirmishes in the Middle East countered broader diplomatic optimism. Meanwhile, gold extended a solid weekly rebound, bolstered by falling yields and safe-haven demand.
Cryptocurrencies caught a firm risk-on bid alongside equities, breaking out of their mid-week consolidation pattern as broader liquidity expectations turned favorable.
- S&P 500: 7,757.64 (+0.62%)
- Nasdaq Composite: 26,690.62 (+1.28%)
Notable Earnings: Aug 10th-14th
The mid-August earnings docket features a diverse lineup spanning retail, technology, enterprise software, and industrial sectors. Highlights for the week include reports from major names like Home Depot and Cisco Systems, alongside prominent players in cloud infrastructure, semiconductors, and consumer health.
The actual earnings date may vary, so traders should confirm with their brokers. If a trader wishes to open a position to participate in earnings announcements, it is important to check whether the earnings are released BEFORE the markets open or AFTER the markets close on the date of earnings.
Monday, Aug 10th: ASTS / HIMS / PLUG / RKLB
Tuesday, Aug 11th: CAH / CRWV / HD / LITE / SMCI
Wednesday, Aug 12th: CAVA / CSCO / NBIS
Thursday, Aug 13th: AMAT / BABA / DE / ONDS / ROST / WMT
Friday, Aug 14th: JNJ / PFE / KSS / SHW / XOM
Economic Calendar: Aug 10th-14th
The focal point of this mid-August economic calendar is squarely on inflation data, with both consumer and producer price indices scheduled for release. Markets will closely scrutinize these reports for clues regarding the trajectory of future Federal Reserve monetary policy. Rounding out the domestic calendar are key updates on wholesale inflation, retail sales performance, and consumer sentiment.
Monday, Aug 10th
CB Employment Trends Index (July): Aggregates multiple labor-market indicators—including job openings, initial claims, and industrial production—to provide a comprehensive composite view of employment momentum.
Tuesday, Aug 11th
NFIB Small Business Optimism Index (July): Measures small business owner sentiment regarding economic conditions, hiring plans, and capital outlay expectations.
Wednesday, Aug 12th
Consumer Price Index (CPI) (July): Tracks changes in the cost of a broad basket of consumer goods and services as a primary gauge of consumer-level inflation.
Thursday, Aug 13th
Producer Price Index (PPI) (July): Measures average changes in prices received by domestic producers for their output, serving as a leading indicator for wholesale inflationary pressures.
Initial Jobless Claims (Week ending Aug 8): Tracks new filings for state unemployment benefits to gauge ongoing labor market tightness and layoff trends.
Friday, Aug 7th
Advance Monthly Retail Sales (July): Measures total receipts at retail and food service stores, offering a direct read on consumer spending strength.
University of Michigan Consumer Sentiment Index (Preliminary, August): Evaluates consumer attitudes toward personal finances, business conditions, and buying intentions for the short and long term.
Blue Sky Horizons
Introduction to Prediction Markets: Trading the Future
At their core, Prediction Markets are online platforms where people buy and sell contracts based on the outcome of real-world events. Instead of trading company shares or betting with a traditional sportsbook, participants trade on questions with binary answers. For example, "Will a specific event happen, or will it not?"
How the Mechanics Work
Every contract on a prediction market is designed to settle at one of two values when the event concludes:
$1.00 if the event happens (Yes) or $0.00 if it does not (No).
Because of this structure, the current price of a contract directly reflects the crowd's estimated probability of that event occurring.
- If a contract for a specific economic policy change trades at $0.70, the market implies a 70% probability that the event will take place.
- If new information emerges and traders rush to sell, that price might drop to $0.40 (a 40% probability).
Just like a stock exchange, prices are determined purely by supply and demand. There is no "house" setting odds or taking a fixed book; buyers and sellers meet in an open market, and prices fluctuate tick-by-tick as news breaks.
What Can You Trade?
The scope of what can be listed has expanded dramatically. While early versions focused heavily on niche political outcomes, today's platforms host liquid markets across several major categories:
- Macroeconomics & Policy: Interest rate decisions by the Federal Reserve, inflation prints, employment numbers, and legislative milestones.
- Geopolitics & Elections: Outcomes of domestic and international leadership races, policy implementations, and global treaties.
- Culture and Entertainment: Major awards shows, corporate milestones, and widespread technological adoption metrics.
- Sports: Game outcomes, tournament champions, and player awards. MetaMask
For everyday participants and professional analysts alike, prediction markets have become popular because they harness collective intelligence. When thousands of participants put real money behind their analytical models, information is digested and priced in rapidly—often outperforming traditional polling, expert commentary, or conventional forecasting models.
The prediction market ecosystem is anchored by a few prominent platforms that drive the vast majority of global volume, catering to everything from retail traders to institutional macro analysts. The industry is currently defined by these leading platforms:
- Polymarket: The world's largest decentralized prediction market. Built on blockchain architecture (specifically utilizing Polygon for fast, low-fee settlement), it handles billions in volume and offers liquidity on a vast array of global topics—ranging from geopolitical conflicts and macroeconomic indicators to pop culture and cryptocurrency milestones.
- Kalshi: A fully regulated financial exchange designated by the Commodity Futures Trading Commission (CFTC). Kalshi operates legally within the United States, allowing retail and institutional traders to trade event contracts on U.S. economic data (like inflation and interest rate decisions), congressional legislation, and weather patterns.
To see how these platforms translate real-world queries into binary outcomes, consider the following example:
The Question: Will OpenAI or Anthropic IPO first?
How it works: This binary contract asks traders to choose between two corporate milestones. If a trader buys the "Anthropic" contract, they are wagering that Anthropic will officially complete its initial public offering before OpenAI does.
Market Pricing: Because the contract specifies a binary outcome, the current price reflects the crowd's probability assessment—for instance, if Anthropic is trading at $0.86 (86%) and OpenAI is at $0.17 (17%), the market heavily favors Anthropic to ring the bell first.
Thank you for reading. Until next week's close,
Have a safe and productive Trading week!
Fauzia Timberlake
About the Author: Fauzia Timberlake is a professional options coach and financial strategist specializing in risk management and portfolio architecture for self-directed investors. She is Founder and Managing Partner of Option Engines.
Questions / Comments
We're here to serve IVolatility users and we welcome your questions or feedback about the option strategies discussed in this newsletter. If there is something you would like us to consider and/or analyze, we're always open to your suggestions. Use support@ivolatility.com.
Previous issues are located under the Trade Ideas tab on our website.