Summer Rally Momentum Burns Brighter
By Fauzia Timberlake, personal coach for trading options
August 17, 2026
Macro Overview of Markets
Major U.S. indices displayed resilient momentum, buoyed by favorable corporate earnings reports and subdued wholesale and consumer inflation prints. These data points tempered expectations for aggressive monetary tightening, helping the S&P 500, Nasdaq Composite, and Dow Jones Industrial Average maintain strong bids despite lingering geopolitical crosscurrents.
The S&P 500 closed the week out at 7,785.76, down 13.23 points for the session after pulling back slightly from its record high. Despite the Friday dip, the index gained over 0.4% overall for the week, marking its third consecutive weekly advance.
Treasury yields experienced upward pressure across the curve during the week, influenced by heavy sovereign debt supply—including a notable 30-year bond auction—and persistent fiscal deficit concerns. The benchmark 10-year Treasury yield edged upward to close out the week near 4.66%, while the 2-year note finished around 4.17%.
Crude oil rallied significantly, advancing over 4% on the week as escalating Middle Eastern supply concerns and naval tensions around the Strait of Hormuz drove risk premiums higher. Crude oil (WTI) closed out the week at $82.16 per barrel, capping off a solid weekly advance of over 4% amid heightened geopolitical supply tensions in the Middle East.
Gold pulled back slightly from its recent peaks due to profit-taking following a sharp prior rally, though the broader macroeconomic uptrend remains supported by central bank diversification and shifting rate-cut expectations. Spot gold pulled back into the $4,364.96 range (down about -0.64% on the day), while front-month futures settled near $4,387.40 as investors took profits following earlier multi-week highs.
Cryptocurrencies faced downward pressure as macroeconomic caution and geopolitical friction reduced risk appetite. Bitcoin (BTC/USD) drifted lower across the weekly session, mirroring choppy performance across broader risk-on digital asset classes. It finished lower by roughly 3.1% for the weekly session, remaining strictly contained within its familiar summer trading band between $62,000 and $66,000.
Strategy Corner
Based on this week's market movements, here are some trading ideas and option strategies for the readers' consideration. The positions can be scaled bigger (or smaller) to suit individual account size.
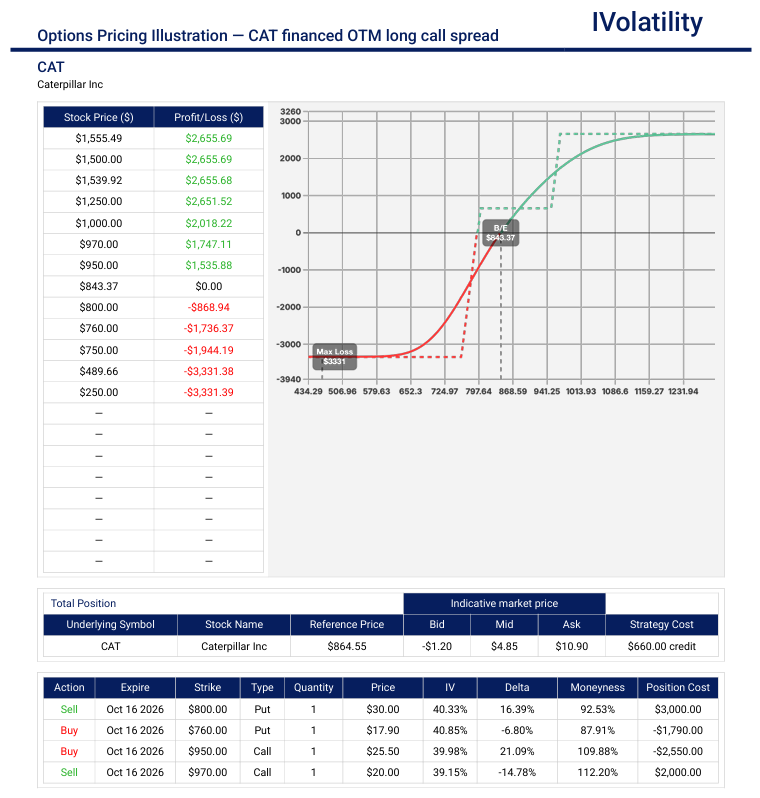
CAT (closed at 857.05 on Friday, Aug 14th)
As market momentum continues to offer selective opportunities across industrial bellwethers, traders could consider a defined-risk, credit-supported structure on this underlying. This strategy allows the trader to capture ongoing upside while maintaining a built-in safety buffer via a short credit spread funded underneath the market.
- Structure: In the Oct16 expiration, buy the 950/970 call spread and finance that purchase with the sale of the 760/800 put spread.
- Net Premium collected about $660
- Max Profit another $2000 if CAT expires above $970 at expiration
- Max Risk about $1240 (put spread less credit received)
- Downside Breakeven around $964
- No risk to the upside
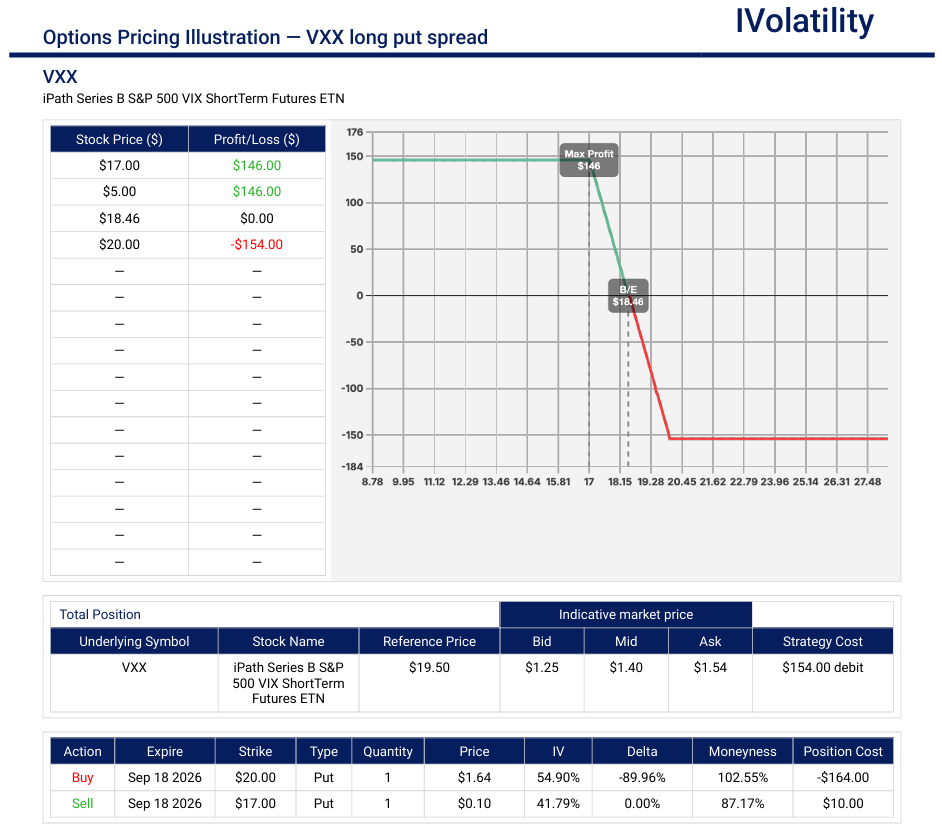
VXX (closed at 19.35 on Friday, Aug 14th)
As major equity indices grind higher and hover near all-time highs, market complacency typically drives implied volatility lower. For traders looking to capitalize on persistent calm, targeting a downside strategy in VXX could be a way to monetize this opinion.
- Structure: In the Sep18 expiration, buy the 20/18 long put spread
- Net Cost about $150
- Max Profit about $50 (if VXX expires below 18 at expiration)
Movement of the Major Market Indices:
| INDEX | UP | DOWN |
| SPY | 0.44% | |
| QQQ | 1.41% | |
| IWM | 1.52% | |
| DIA | -0.35% | |
| GLD | -0.17% | |
| BTC/USD | -3.13% | |
| 10-year yield | -0.84% | |
| Crude Oil | 4.27% | |
| VIX | -4.21% |
Movement of the Major Market Sectors:
| SECTOR | UP | DOWN |
| TECH (XLK) | 1.04% | |
| FINANCIALS (XL) | 1.08% | |
| INDUSTRIALS (XLI) | 0.92% | |
| ENERGY XLE | 6.39% | |
| HEALTHCARE (XLV) | 1.02% | |
| UTILITIES (XLU) | 0.68% | |
| MATERIALS (XLB) | 1.29% | |
| REAL ESTATE (XLRE) | 1.25% | |
| CONSUMER STAPLES (XLP) | 1.69% | |
| CONSUMER DISCRETIONARY (XLY) | -0.86% |
Notable Gainers Week of Aug 10th – 14th
The heavy outperformance concentrated in specific names pointed to several distinct underlying market dynamics for the week:
- Strategic M&A Speculation and Private Equity Interest
- Selective Analyst Upgrades and Cost Discipline Re-Pricing
- Broader Tech and Enterprise Software Resilience Amid Cooling Labor Data
Nebius Group N.V. (NBIS): Surged 47.7% to lead the broader market as heavy institutional accumulation and aggressive infrastructure expansion fueled massive momentum across high-growth cloud and AI-adjacent technology names.
Wayfair Inc. (W): Climbed 4.0% after Bernstein upgraded shares to outperform, highlighting disciplined cost structures and consistent revenue beats.
Wix.com Ltd. (WIX): Climbed 23.2% following strong user monetization trends and optimism regarding web-infrastructure resilience amidst shifting consumer demand patterns.
Workday, Inc. (WDAY): Advanced 17.8% following market reports regarding potential acquisition talks by private equity firm Silver Lake, driving a sharp valuation re-pricing across enterprise software names.
Notable Losers Week of Aug 10th – 14th
The sharp underperformance and pullbacks concentrated in specific names highlighted several shifting currents across the market tape for the week:
- Disappointing Clinical Trial Results and Binary Biotech Re-Pricing
- Aggressive Equity Dilution and Secondary Offering Overhangs
- Sector-Specific Profit-Taking Following Extended Run-Ups
Sionna Therapeutics, Inc. (SION): Dropped 91.2% following the release of topline data from its cystic fibrosis development programs, triggering an immediate and severe re-pricing across clinical-stage pipelines.
Tenax Therapeutics, Inc. (TENX): Slumped 89.8% after reporting disappointing topline results from its Phase 3 LEVEL clinical trial in patients with PH-HFpEF, driving heavy institutional liquidation.
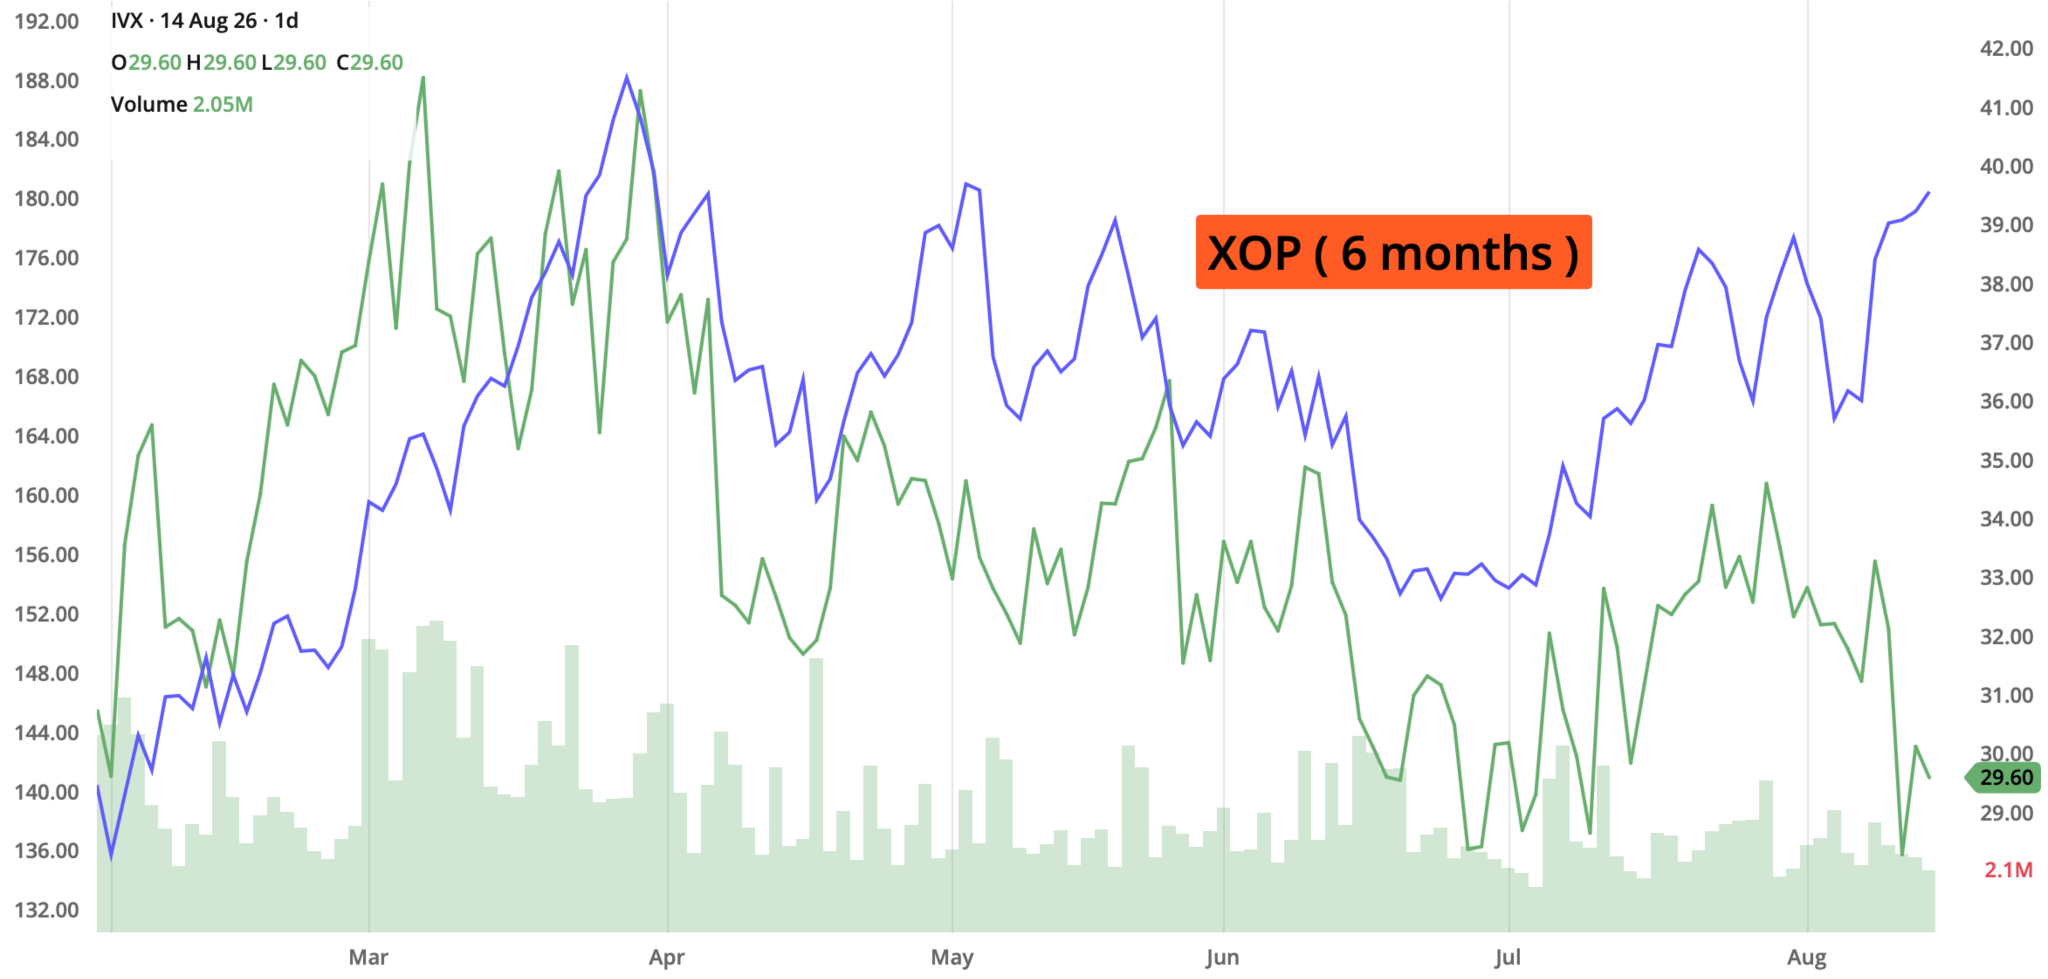
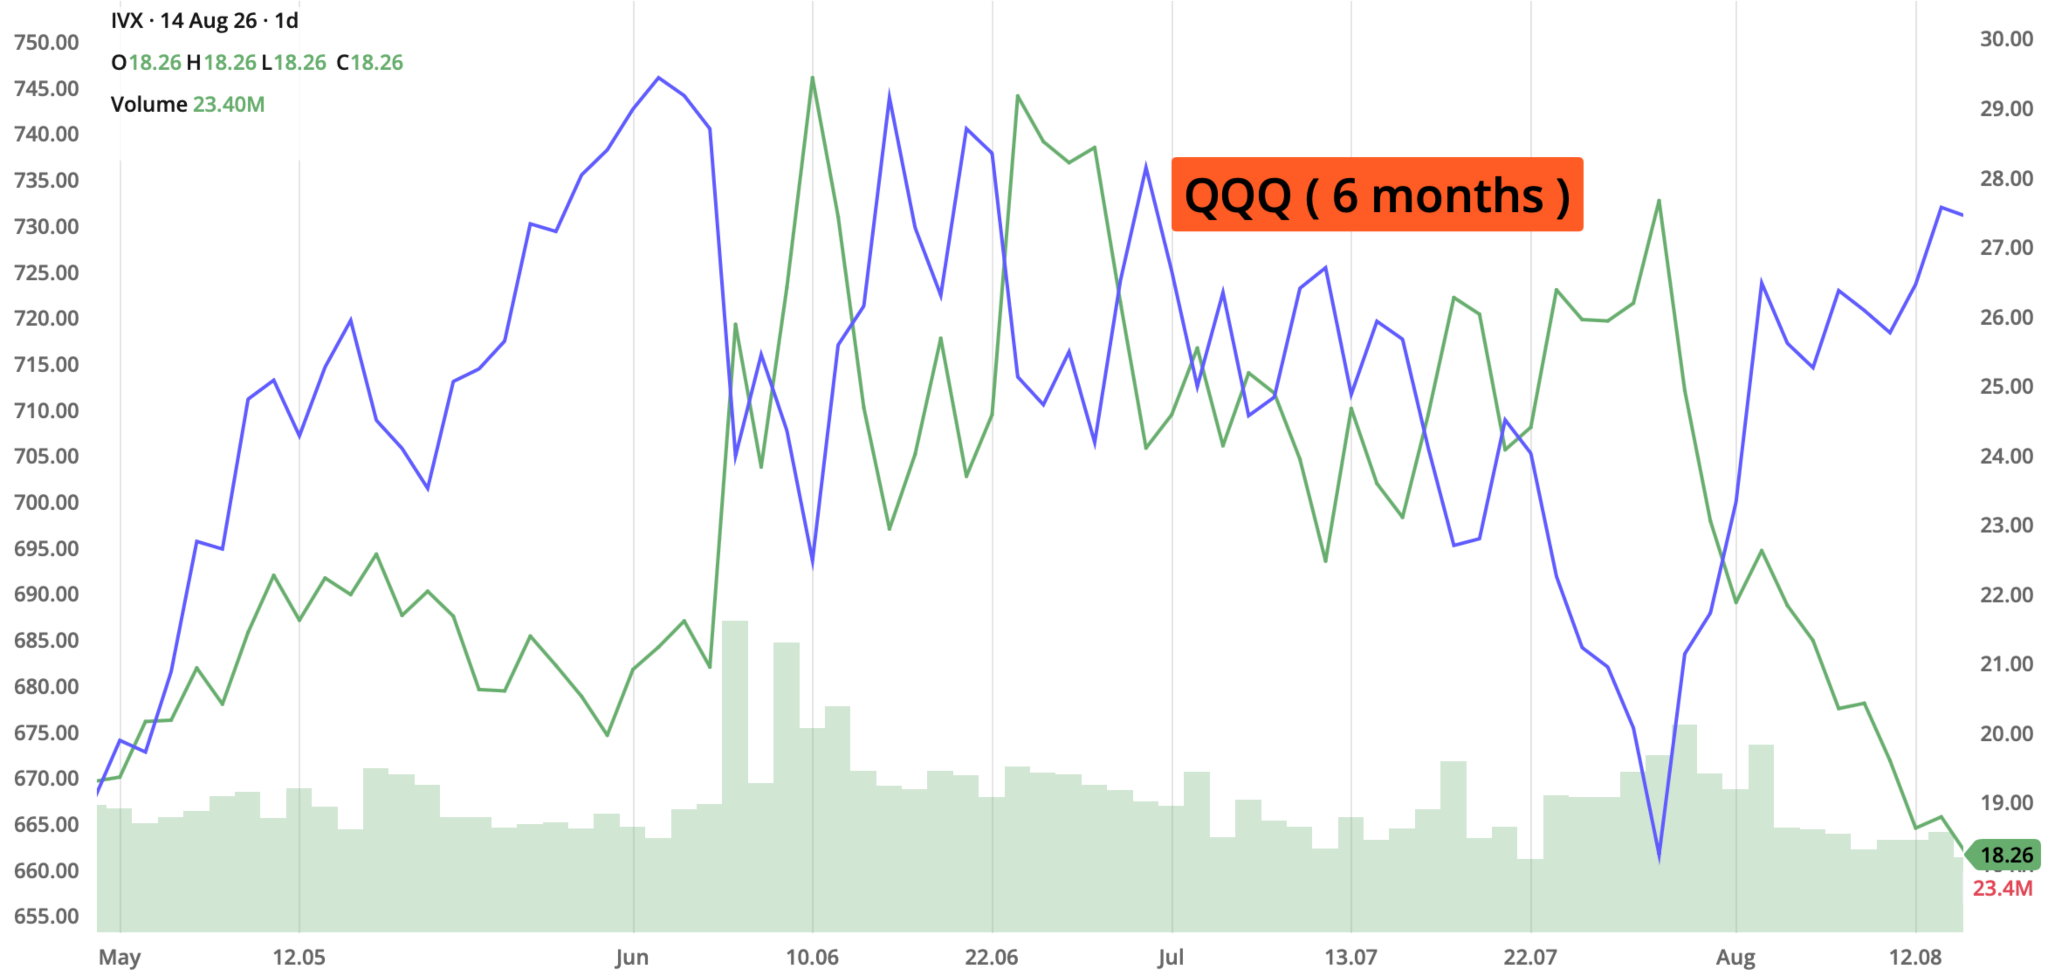
Review selected market indices below:
Daily Notable Market Action
Market Summary for Monday, Aug 10th
U.S. markets opened the week on a slightly cautious note, pulling back modestly from record territory as investors digested a mix of corporate headlines. Heavyweight technology stocks faced some downward pressure—notably weighed down by names like Intel following capital-raising announcements—though broader sentiment was supported by strong corporate results, including an upbeat report from Berkshire Hathaway.
Treasury yields experienced upward adjustments across the curve as heavy supply expectations and persistent fiscal concerns weighed on sovereign debt. The benchmark 10-year Treasury yield ticked higher to hover near 4.68% as traders positioned themselves ahead of upcoming mid-week inflation prints.
Crude oil pushed higher, with Brent and WTI extending gains as lingering uncertainties surrounding transit through the Strait of Hormuz kept geopolitical risk premiums elevated in the energy sector.
Gold traded with a firm underlying bid as investors balanced safe-haven demand against shifting macroeconomic expectations.
Cryptocurrencies moved in tandem with broader risk assets, seeing a relatively subdued start to the week as digital tokens consolidated within recent tight trading ranges while market participants awaited clearer macroeconomic catalysts.
- S&P 500: 7,489.72 (+0.85%)
- Nasdaq Composite: 25,373.85 (+1.00%)
Market Summary for Tuesday, Aug 11th
US stocks drifted lower for a second consecutive session on Tuesday, retreating further from record highs as volatile energy markets and ongoing geopolitical supply concerns kept inflation anxiety front and center. Major technology shares and growth issues faced notable downward pressure, overshadowing positive corporate earnings reports from firms like Aramark.
Treasury yields eased back across the curve following their recent climb, with the benchmark 10-year Treasury yield ticking down to 4.69% as bond investors repositioned cautiously ahead of the upcoming consumer price index report.
Crude oil prices swung wildly and extended their winning streak, with Brent crude briefly pushing above $90 a barrel before settling near $88.91 as persistent disruptions around the Strait of Hormuz fueled supply premium risks. Gold maintained a firm stance as market participants weighed safe-haven positioning against shifting rate expectations.
Digital assets traded rangebound, mirroring the cautious macro sentiment across broader risk-on sectors as participants avoided taking heavy directional bets ahead of mid-week inflation data.
- S&P 500: 7,728.20 (-0.32%)
- Nasdaq Composite: 26,445.45 (-0.60%)
Market Summary for Wednesday, Aug 12th
U.S. risk appetite received a welcome lift on Wednesday following the release of the July consumer price index (CPI) inflation report, which arrived cooler than anticipated and eased immediate market concerns regarding aggressive monetary tightening. Equities bounced back solidly as growth and technology issues led a broad-based market recovery.
Treasury yields drifted lower across the curve as bond investors cheered the tamer-than-feared inflation print, with the benchmark 10-year Treasury yield easing back toward 4.58% as rate-cut optimism found renewed footing.
Crude oil prices stabilized following their recent sharp climb, trading in a more contained range as traders balanced lingering supply concerns in the Middle East against the broader macroeconomic relief provided by the inflation data. Gold held firm near elevated levels, retaining its safe-haven appeal.
Digital assets experienced a modest bounce in correlation with broader risk-on sentiment, with major tokens recapturing lost ground as macro headwinds temporarily subsided.
- S&P 500: 7,748.50 (+0.26%)
- Nasdaq Composite: 26,588.49 (+0.54%)
Market Summary for Thursday, Aug 13th
Wall Street extended its advance on Thursday, pushing major benchmarks to new all-time record highs. Sentiment was strongly reinforced by a tamer-than-feared Producer Price Index (PPI) wholesale inflation reading, which provided fresh evidence that price pressures continued to cool. Equities rallied broadly, led by outperformance in technology and growth sectors.
Treasury yields drifted lower across the curve following the encouraging wholesale inflation data, with the benchmark 10-year Treasury yield easing back to approximately 4.65% as bond investors grew increasingly confident in a favorable monetary policy trajectory.
Crude oil prices pulled back significantly, with Brent crude falling over 2% toward $86.96 as immediate Middle East supply anxiety eased. Gold experienced a consolidation pullback, slipping from its recent record highs as broader risk appetite drew capital back into equities.
Digital assets held steady, with major tokens maintaining tight ranges as market participants largely looked past minor crypto fluctuations to focus on the broader macroeconomic relief sweeping through traditional risk assets.
- S&P 500: 7,798.99 (+0.65%)
- Nasdaq Composite: 26,803.03 (+0.80%)
Market Summary for Friday, Aug 14th
U.S. stocks edged back from their record highs on Friday as investors digested a surprisingly weak retail sales report showing consumer spending slipped last month, alongside a preliminary reading pointing to softening consumer sentiment. Major indices gave up earlier modest gains to finish the session slightly lower, though strong mid-week momentum ensured solid weekly gains overall.
Treasury yields drifted lower as the softer economic data reinforced expectations for future monetary policy adjustments, with the benchmark 10-year yield settling down toward 4.64%.
Crude oil prices swung higher during the session, maintaining underlying support amid lingering Middle East transit concerns. Gold traded lower as investors rotated capital back into traditional havens and weighed the shifting macroeconomic landscape.
Digital assets traded relatively flat, consolidating in a tight band as crypto markets awaited fresh catalysts after a largely macro-driven week.
- S&P 500: 7,785.76 (-0.17%)
- Nasdaq Composite: 26,729.16 (-0.28%)
Notable Earnings: Aug 17th – 21st
The earnings docket shifts toward key bellwethers in consumer retail, enterprise tech, cybersecurity, and home improvement, offering critical clues into consumer discretionary health and corporate IT spending momentum. The week belongs to the big-box giants, and all eyes are on Walmart, which sits atop the most-watched list as investors look for confirmation that the American shopper is still spending.
The actual earnings date may vary, so traders should confirm with their brokers. If a trader wishes to open a position to participate in earnings announcements, it is important to check whether the earnings are released BEFORE the markets open or AFTER the markets close on the date of earnings.
Monday, Aug 17th: BHP / EL / ZS
Tuesday, Aug 18th: BIDU / HD / HSAI / KLAR / M
Wednesday, Aug 19th: ADI / BABA / BILL / LOW / SNOW / TGT / TJX
Thursday, Aug 20th: ROST / NTAP / WMT
Friday, Aug 21st: BBY / DE / FLUT
Economic Calendar: Aug 17th – 21st
The upcoming week brings a crucial batch of mid-summer macroeconomic data, highlighted by housing metrics, regional manufacturing gauges, and the vital central bank insight from the July FOMC meeting minutes.
Monday, Aug 17th
- NY Empire State Manufacturing Index: Measures regional manufacturing health based on shipments, new orders, and inventories, offering an early read on industrial activity coming out of New York.
- NAHB Housing Market Index: Tracks builder confidence in the single-family housing market, providing a key gauge of real estate sector momentum and buyer demand.
- TIC Net Long-Term Transactions: Quantifies net cross-border purchases of U.S. long-term securities, illustrating foreign capital flows and demand for domestic financial assets.
Tuesday, Aug 11th
- Housing Starts: Measures the number of new privately-owned residential housing units started during the month, serving as a primary indicator of construction activity and economic expansion.
- Building Permits: Tracks authorized new housing construction, acting as a leading indicator for future real estate supply and broader economic confidence.
- Industrial Production & Capacity Utilization: Evaluates the output and operational efficiency of the nation's factories, mines, and utilities, gauging underlying manufacturing strength.
Wednesday, Aug 12th
- FOMC Meeting Minutes (July Session): Provides an in-depth transcript of the Federal Reserve's policy deliberations, offering crucial clues regarding central bank sentiment, inflation debates, and the future trajectory of interest rates.
Thursday, Aug 13th
- Philadelphia Fed Manufacturing Index: Surveys regional manufacturing business conditions, new orders, employment, and input prices to gauge mid-Atlantic industrial health.
- Conference Board Leading Economic Index (LEI): Combines ten forward-looking economic indicators—including stock prices, manufacturing hours, and credit conditions—to forecast directional changes in the business cycle over the medium term.
Friday, Aug 7th
- S&P Global Flash US Manufacturing PMI: Delivers a timely advance snapshot of business conditions, output, and incoming orders across the industrial and factory sectors.
- S&P Global Flash US Services PMI: Measures business activity and employment trends within the dominant service sector, offering vital insight into consumer demand and broader economic resilience.
Blue Sky Horizons
Introduction to Prediction Markets: Trading the Future (part 2)
Building on the introduction to prediction markets last week, the core mechanics of binary contracts, crowd-sourced probability pricing, and the distinct architectures of Polymarket and Kalshi was explored. The natural next step for curious traders is looking at how these instruments fit into a broader portfolio framework.
When binary event contracts transition from a novelty to a liquid alternative asset class, they begin to intersect directly with traditional risk management, macro hedging, and directional strategy.
For options traders, the mechanics of prediction markets feel conceptually familiar, yet structurally distinct. Understanding these parallels highlights where event contracts can complement—or substitute—traditional derivative plays:
- Defined Risk and Reward: Just like a long option position, your maximum loss in a prediction market is strictly capped at the premium paid to enter the contract. If you buy a "Yes" contract at $0.35, your risk is fixed at $0.35 per contract, with a potential binary payout of 1.00(0.65 profit). There is no underlying delta-hedging maintenance or sudden margin expansion overnight.
- The Decay Factor (Time vs. Probability): Standard options experience time decay (theta), changing value even if the underlying asset stays flat. Prediction markets, by contrast, experience price shifts driven almost entirely by information arrival and shifting probabilities. A contract can sit at $0.50 for weeks and jump to $0.95 in a matter of minutes if a single headline breaks.
- Leverage and Capital Efficiency: Because contracts trade between $0.01 and $0.99, participants do not need complex vertical spreads to manage capital outlay. You are buying a direct linear slice of a binary outcome, making position sizing mathematically transparent.
Beyond speculative wagers, institutional and advanced retail participants can use prediction markets as tactical overlays for real-world risk:
- Hedging Regulatory or Policy Exposure: If a macro portfolio is heavily positioned for a specific interest rate cut or sector-specific regulatory approval, event contracts on platforms like Kalshi allow traders to open inexpensive direct hedges. If the regulatory decision goes against your portfolio, the payout from the prediction contract may help cushion the broader market drawdown.
- Binary Earnings and Corporate Milestones: While options markets price implied volatility into earnings announcements via expensive straddles or strangles, prediction markets can offer alternative ways to express a view on binary corporate milestones (such as regulatory greenlights, product launch dates, or corporate structural changes).
As trading volumes in prediction markets scale dramatically, the ecosystem is hitting its institutional adolescence. The dividing line between jurisdictions is becoming sharper: regulated U.S. exchanges like Kalshi operate under direct Commodity Futures Trading Commission (CFTC) oversight, while decentralized global liquidity pools like Polymarket continue to navigate international regulatory frameworks and localized compliance probes.
It is clear that Prediction Markets are no longer just a sideshow for political junkies or crypto enthusiasts. They are functioning as real-time, high-speed probability engines. Treating them with the same analytical discipline applied to options Greeks and macro trends is the key to potentially turning crowd sentiment into a reliable edge.
Thank you for reading. Until next week's close,
Have a safe and productive Trading week!
Fauzia Timberlake
About the Author: Fauzia Timberlake is a professional options coach and financial strategist specializing in risk management and portfolio architecture for self-directed investors. She is Founder and Managing Partner of Option Engines.
Questions / Comments
We're here to serve IVolatility users and we welcome your questions or feedback about the option strategies discussed in this newsletter. If there is something you would like us to consider and/or analyze, we're always open to your suggestions. Use support@ivolatility.com.
Previous issues are located under the Trade Ideas tab on our website.