Tech Momentum Meets Macro Realities
By Fauzia Timberlake, personal coach for trading options
August 31, 2026
Macro Overview of Markets
Global financial markets navigated a high-stakes stretch dominated by the annual Jackson Hole Economic Policy Symposium, persistent energy supply shocks, and renewed volatility in long-duration borrowing costs. Risk sentiment turned defensive as investors digested a hawkish framing from Fed Chair Kevin Warsh alongside structural pressures across major asset classes.
Major equity indexes pulled back broadly, snapping prior winning streaks as elevated long-term yields and rising energy input costs squeezed risk appetite. Megacap technology and high-multiple growth sectors faced the heaviest downside pressure, weighed down by higher discount rate pressures, while defensive sectors provided relative shelter.
Sovereign bond markets experienced renewed turbulence, particularly at the long end of the curve. Long-term U.S. Treasury yields hovered near multi-decade highs, driven by stubborn energy-driven inflation fears, heavy debt issuance, and ongoing focus around the Treasury's long-dated debt buyback adjustments.
Crude oil posted strong gains, extending its robust summer rally. Prices advanced firmly on persistent supply concerns, Middle East geopolitical risk premiums, and robust physical demand dynamics that continued to keep inventories tight.
Precious metals staged a powerful surge, notching consecutive weeks of substantial gains. Gold rallied aggressively as investors increasingly sought a hedge against stagflationary cross-currents, sticky core inflation, and lingering uncertainty surrounding long-term monetary policy.
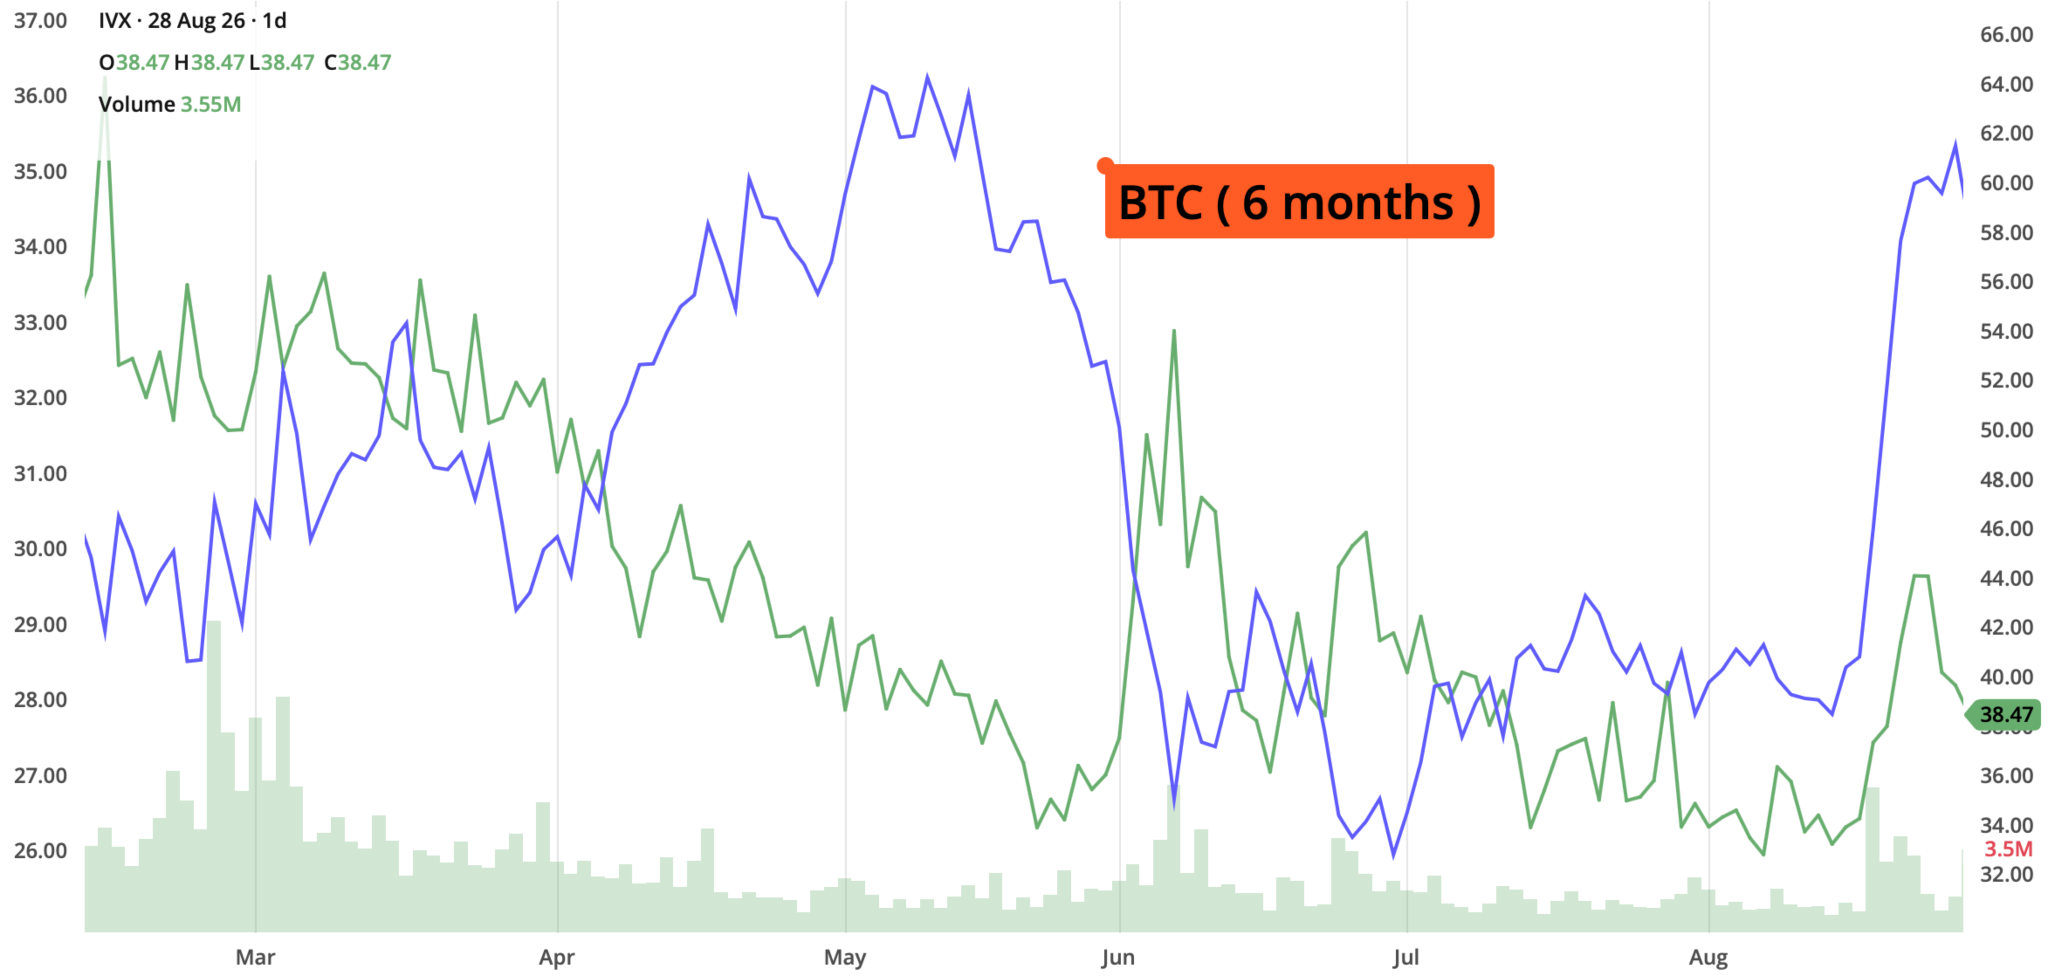
Cryptocurrencies traded with heightened sensitivity to the broader risk-off tone in equities and tightening macro liquidity conditions, consolidating recent ranges while market participants monitored upcoming macroeconomic catalysts.
Strategy Corner
Based on this week's market movements, here are some trading ideas and option strategies for the readers' consideration. The positions can be scaled bigger (or smaller) to suit individual account size.
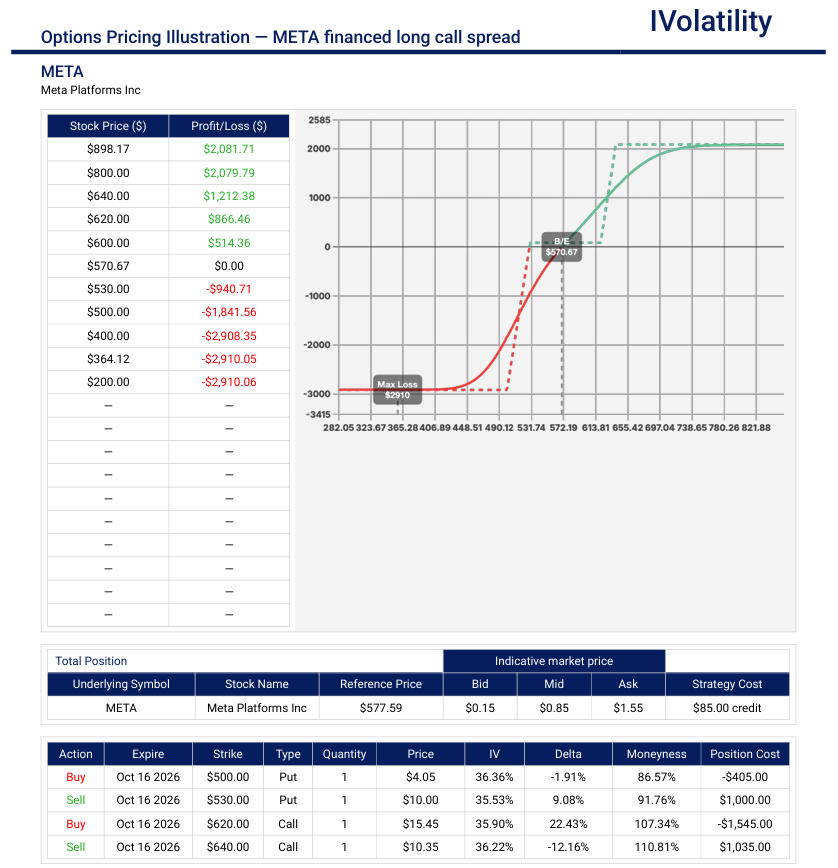
META (closed at 578.02 on Friday, Aug 28th)
Recent structural and headline developments—including youth-safety settlement resolutions—have been absorbed by the market with remarkable resilience, indicating that much of the regulatory overhang may already be priced into the stock. If a trader would like to get bullish on META, an OTM long call spread financed by the sale of an OTM put spread could be productive.
- Structure: In the Oct16 expiration, buy the OTM 620/640 call spread and sell the OTM 500/530 put spread to finance the purchase; all for a small net credit.
- Net credit collected $0.85
- Max Profit $2000 if META expires above 640 on expiration
- No upside breakeven; downside breakeven around 530 (22 delta)
MSFT (closed at 513.88 on Friday, Aug 28th)
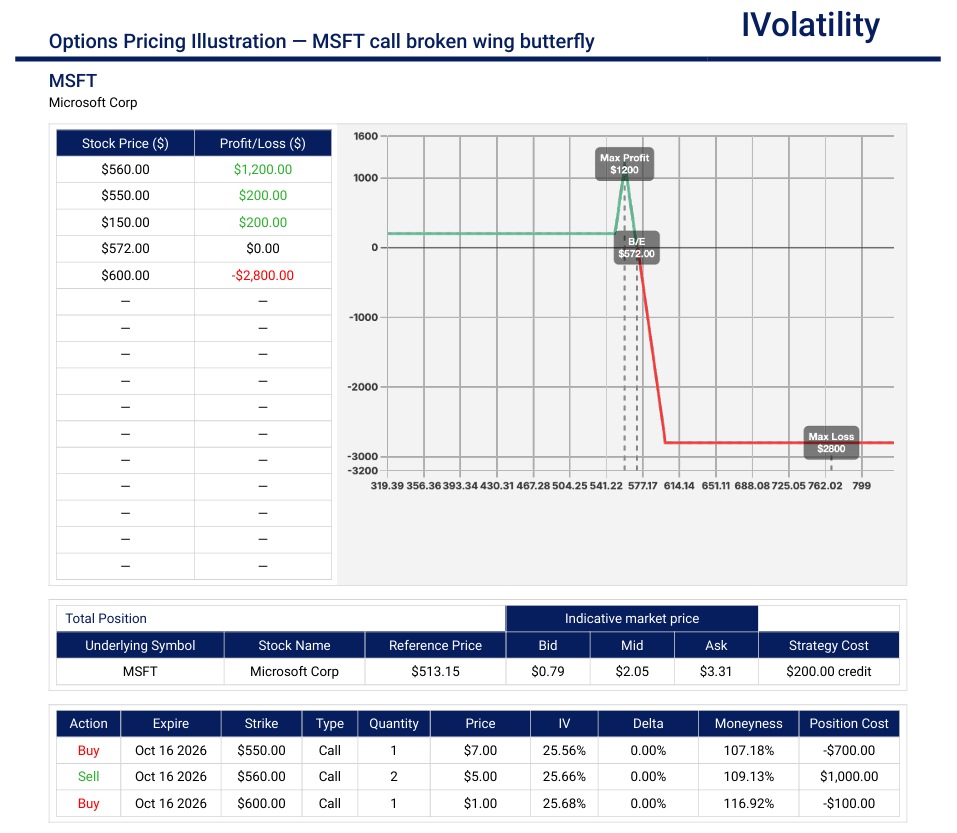
Mega-cap tech stocks rarely move in straight lines. After sharp upward re-pricings, they frequently hit short-term resistance levels. If a trader would like to fade the recent rally in MSFT, a call broken-wing-butterfly could be set up.
- Structure: In the Oct16 expiration, buy the 550/560/600 broken-wing butterfly
- Net Credit about $200
- Max Profit another $1000 (if MSFT expires pins 560 at expiration)
- No downside breakeven
- Upside breakeven around 572 (about 16delta)
Movement of the Major Market Indices:
| INDEX | UP | DOWN |
| SPY | 0.77% | |
| QQQ | 0.95% | |
| IWM | -1.27% | |
| DIA | 0.61% | |
| GLD | 1.60% | |
| BTC/USD | 2.69% | |
| 10-year yield | -1.27% | |
| Crude Oil | -1.59% | |
| VIX | -4.64% |
Movement of the Major Market Sectors:
| SECTOR | UP | DOWN |
| TECH (XLK) | 3.54% | |
| FINANCIALS (XL) | 1.09% | |
| INDUSTRIALS (XLI) | -1.02% | |
| ENERGY XLE | 0.32% | |
| HEALTHCARE (XLV) | -1.21% | |
| UTILITIES (XLU) | -1.03% | |
| MATERIALS (XLB) | -0.37% | |
| REAL ESTATE (XLRE) | -0.89% | |
| CONSUMER STAPLES (XLP) | -0.87% | |
| CONSUMER DISCRETIONARY (XLY) | 0.81% |
Notable Gainers Week of Aug 24th – 28th
The week's positive price action featured concentrated momentum and sharp re-pricings, driven by several key underlying catalysts:
- Strong quarterly results and upbeat institutional forecasts sparked aggressive buying in software and cybersecurity leaders.
- Renewed industrial interest and supply chain positioning fueled sharp upward moves across advanced materials and niche tech hardware.
- Select retail favorites saw heavy institutional accumulation as bargain hunting and improving margin outlooks drove short-term buying pressure.
Okta Inc. (OKTA): Surged 23.0% as stellar quarterly metrics and accelerated identity-management demand prompted aggressive short-covering and institutional upgrades.
Salesforce Inc. (CRM): Advanced 22.4% following an exceptionally well-received earnings report that highlighted accelerating adoption across its enterprise cloud and AI suites.
Gap Inc. (GPS): Climbed 18.6% as strong inventory control and margin expansion beat expectations, triggering heavy momentum buying.
CrowdStrike Holdings Inc. (CRWD): Gained 13.8% as cybersecurity spending resilience continued to draw aggressive institutional capital inflows.
Notable Losers Week of Aug 24th – 28th
Underlying sectoral rotations and specific downward earnings revisions drove notable downside pressure across several high-profile names:
- Major consumer-facing names faced steep pullbacks as soft guidance and inventory adjustments spooked investors.
- Select high-beta digital infrastructure and fintech names experienced aggressive corrections following extended multi-month rallies.
- Regulatory scrutiny and pipeline updates weighed heavily on select large-cap healthcare components.
Dick's Sporting Goods Inc. (DKS): Plunged 26.3% after disappointing forward guidance and tightening operating margins triggered heavy institutional selling.
PayPal Holdings Inc. (PYPL): Declined 12.8% amid intensifying competition concerns and compressed transaction margin forecasts.
Eli Lilly and Company (LLY): Fell 6.9% as profit-taking hit the pharma heavyweight following valuation concerns and mixed trial updates.
Tesla Inc. (TSLA): Dropped 3.5% pressured by broader consumer discretionary softness and ongoing vehicle pricing pressures.
Nike Inc. (NKE): Slipped 3.4% as sluggish international demand metrics weighed on footwear retail sentiment.
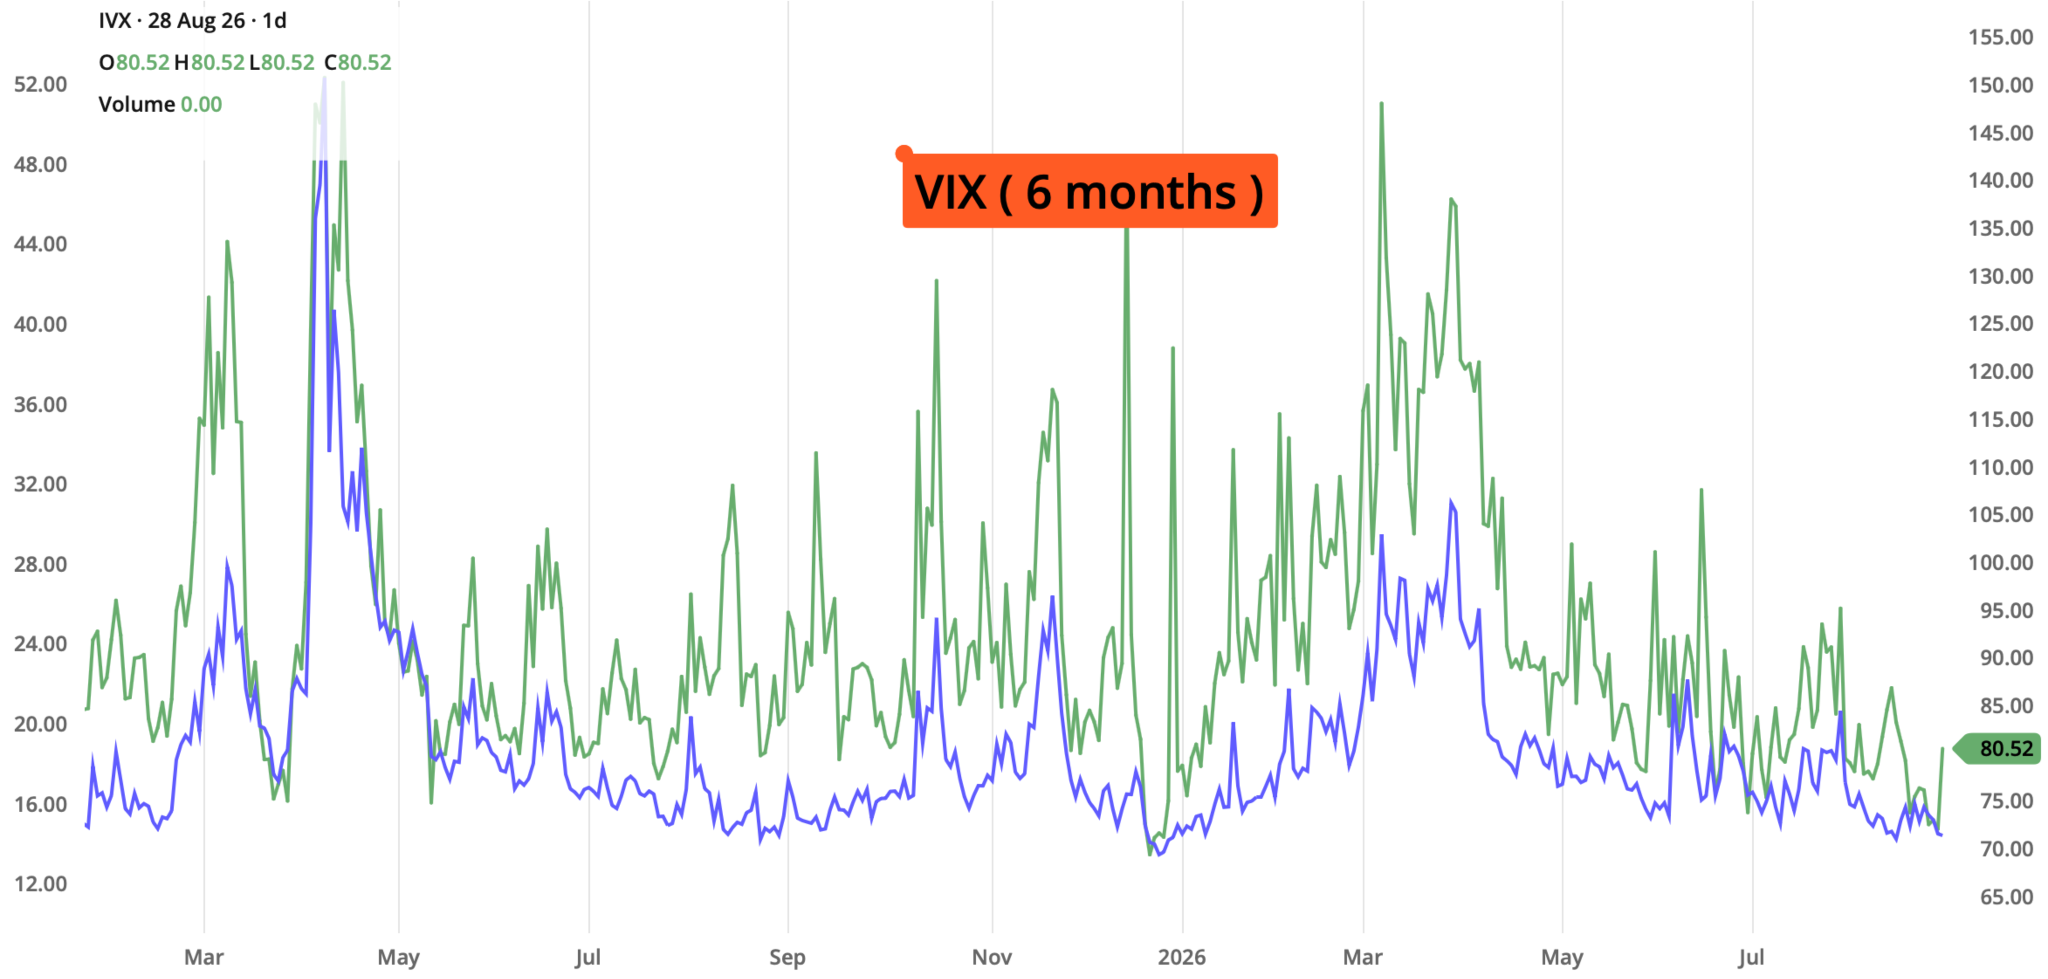
Review selected market indices below:
Daily Notable Market Action
Market Summary for Monday, Aug 24th
Equities drifted to a mixed finish as major indices pulled back from recent highs. The S&P 500 slipped and the Nasdaq composite underweight from a retreat in semiconductor and high-flying tech stocks, while the Dow Jones Industrial Average managed a small gain due to defensive blue-chip rotation.
Treasury yields eased modestly across the curve as early session volatility cooled and bond markets caught a reprieve, awaiting upcoming central bank commentary and tier-one economic prints
Oil drifted lower, shedding early momentum as global demand questions and shifting geopolitical risk sentiment weighed on near-term crude pricing.
Gold opened the week on firm ground with a steady upward bias, holding near multi-week highs as institutional investors leaned into safe-haven assets amid ongoing sovereign debt and Treasury market anxiety.
Digital assets traded sideways with a calm, stable tone following prior explosive moves, with market participants evaluating whether recent macro-driven gains could hold ahead of a heavy event-risk week.
Market Summary for Tuesday, Aug 25th
Equities advanced broadly as major indices pushed higher, Relief from falling oil prices and a cooling bond market lifted risk appetite, helping offset steep individual pullbacks like a sharp post-earnings slump in retail names.
Treasury yields fell notably across the curve. The drop was driven by lower crude prices relieving near-term inflation anxieties and ongoing structural support from Treasury buyback expectations.
Oil experienced a sharp secondary decline with the pullback coming despite newly announced U.S. sanctions on Iran, as easing transport-choke fears and diplomatic mediation efforts helped calm persistent supply-shock premiums.
Gold maintained a resilient structural bid, consolidating near multi-month highs. Although spot prices gave back a portion of their earlier peak push amid mild profit-taking, ongoing sovereign debt concerns and the broader debasement trade kept institutional buyers actively accumulating on the dip.
Digital assets danced alongside broader risk-on sentiment, tracking positive momentum in alternative stores of value as market participants capitalized on the mid-week relief across broader macroeconomic pressures.
Market Summary for Wednesday, Aug 26th
Equities drifted through a quiet, range-bound session with minor losses across the board Trading remained highly cautious as investors paused near all-time highs to digest a consumer inflation report that came in slightly hotter than anticipated, all while holding breath ahead of Nvidia's major post-close earnings release.
Treasury yields ticked higher across the curve. The upward pressure on yields was directly catalyzed by the slightly firmer-than-expected monthly inflation data, which reinforced expectations that the Federal Reserve could keep interest rates restrictive through the back half of the year.
Oil extended a sharp downward trend, sliding deeper as news regarding discussions between Iran and Oman over a potential maritime de-escalation corridor in the Strait of Hormuz helped alleviate supply-shock anxiety.
Gold experienced a modest, tight-range consolidation, dipping slightly below recent peaks as steady inflation prints and stable real yields prompted minimal profit-taking while foundational safe-haven demand remained intact.
Digital assets traded essentially flat to slightly lower in a low-conviction pattern, tracking the broader macro "holding pattern" as crypto participants awaited definitive directional triggers from upcoming economic data.
Market Summary for Thursday, Aug 27th
Equities surged significantly as blockbuster earnings reports and upbeat revenue forecasts from tech heavyweights like Nvidia and Salesforce swept across Wall Street. The Nasdaq composite climbed 1.6% and the S&P 500 rose 0.7% to pull closer to record highs, successfully overriding lingering macroeconomic caution.
Treasury yields ticked slightly higher across the curve (with the 10-year yield settling near 4.67%) as strong corporate growth data and persistent fiscal deficit pressures challenged aggressive near-term rate-cut assumptions.
Oil stabilized and modestly reversed previous losses, with WTI crude inching up near $82.38 a barrel as markets digested recent supply corridor headlines and found a temporary technical floor following earlier mid-week volatility.
Gold rebounded slightly following mid-week profit-taking, stabilizing as institutional buyers resumed accumulation of hard assets to hedge against long-term sovereign debt expansion and structural fiscal pressures.
Digital assets experienced a solid rebound, tracking parallel risk-on sentiment in high-beta tech assets and capturing fresh speculative capital inflows as crypto markets broke out of their mid-week consolidation.
Market Summary for Friday, Aug 28th
Equities slipped in a cautious end-of-week session as investors locked in profits following the prior day's explosive tech rally. The S&P 500 fell 0.2% to 7,711.76, the Nasdaq Composite dropped 0.5% to 26,402.42, and the Dow dipped fractionally. Small-caps (Russell 2000) bore the brunt of the selling, sliding 1.4% as markets digested post-symposium policy remarks and weighed elevated valuations.
The bond market experienced noticeable curve flattening as the short end of the Treasury yield curve led a move higher. Yields pushed upward as traders built fresh bets that the Federal Reserve may eventually need to consider rate hikes to combat stubborn inflation, compounding ongoing structural debt and deficit supply concerns.
Oil consolidated lower at the end of a volatile week, crude benchmarks stayed under pressure as traders weighed ongoing supply-corridor developments against lingering global demand deceleration worries.
Gold maintained a firm structural bid, cementing a strong weekly advance as institutional capital continued to flow into precious metals as an ultimate safe-haven hedge against persistent fiscal expansion and debt-debasement risks.
Digital assets held steady near the upper end of their weekly recovery range, reflecting resilient speculative participation and ongoing parallel rotation into non-fiat, decentralized stores of value.
Notable Earnings Due for week of Aug 31st–Sep 4th
The corporate earnings docket shifts its primary focus toward enterprise technology, high-end semiconductor hardware, cybersecurity resilience, and discretionary consumer health. Following previous heavyweights, the upcoming week provides a crucial secondary pulse on artificial intelligence network infrastructure, custom silicon momentum, and corporate software spending. Key results from major server manufacturers, networking leaders, and retail bellwethers will offer critical cross-currents on enterprise IT budgets and consumer durability as summer transitions into autumn.
The actual earnings date may vary, so traders should confirm with their brokers. If a trader wishes to open a position to participate in earnings announcements, it is important to check whether the earnings are released BEFORE the markets open or AFTER the markets close on the date of earnings.
Mon, Aug 31st: SAIC
Tue, Sep 1st: CRDO / DELL / MDB / MDT / NIO / PANW
Wedn, Sep 2nd: AVGO / FIVE / HPE / NTAP / SNOW
Thu, Sep 3rd: DOCU / CIEN / LULU / ZS
Fri, Sep 4th: No major noteworthy announcements scheduled
Economic Calendar Due for week of Aug 31st–Sep 4th
The opening week of September brings the densest and most critical U.S. data week of the quarter, arriving with markets closely parsing the path forward for monetary policy following recent central bank commentary. Anchored heavily by vital labor market indicators—culminating in the August Nonfarm Payrolls report—the calendar also features crucial manufacturing and services ISM prints, the Federal Reserve's Beige Book, and the final stretch of Fed speak ahead of the upcoming policy blackout.
Monday, Aug 31st:
- Chicago PMI / Regional Activity: A regional barometer tracking business activity and manufacturing conditions, offering initial sentiment reads heading into the heavy core data stretch of the week.
Tuesday, Sep 1st:
- ISM Manufacturing PMI: A key health check on the manufacturing sector measuring new orders, production, and employment, closely watched for signs of industrial resilience or contraction.
- JOLTS Job Openings: A comprehensive reading on labor demand and job vacancies that highlights whether employer recruitment appetite is holding steady or softening.
- Atlanta Fed GDPNow (Q3 Update): An updated real-time tracking estimate providing algorithmic visibility into third-quarter economic growth trajectories.
Wednesday, Sep 2nd:
- ADP Employment Report: Private-sector employment change providing an early preview of labor market momentum ahead of the official government payrolls release.
- Fed Beige Book: A summary of commentary on current economic conditions across the twelve Federal Reserve districts, offering localized insights on business sentiment and wage pressures.
Thursday, Sep 3rd:
- ISM Services PMI: Evaluates expansion or contraction in the dominant services sector, tracking business activity, order backlogs, and price paid components.
- Revised Q2 Nonfarm Productivity & Costs: Provides an updated assessment of worker output per hour and unit labor costs, vital metrics for evaluating long-term inflationary potential.
Friday, Sep 4th:
- August Employment Report (Nonfarm Payrolls & Unemployment Rate): The marquee macroeconomic release of the month detailing headline job creation, the unemployment rate, and average hourly earnings growth, serving as the definitive labor market print prior to the mid-September FOMC decision.
Blue Sky Horizons
The Power-Grid & Nuclear Renaissance for AI Infrastructure (part 2)
As artificial intelligence infrastructure scales from experimental clusters to multi-gigawatt enterprise footprints, power availability has definitively overtaken silicon and land constraints as the primary bottleneck for technological growth. The intersection of big tech and heavy energy is no longer a peripheral theme—it has transformed into a trillion-dollar structural pivot reshaping both the utilities and data center sectors.
- The Baseload Imperative: Unlike traditional cloud workloads that tolerate intermittent renewable energy swings, next-generation AI model training and inference demand absolute, 24/7 continuous baseload power. With national grid interconnections facing multi-year queues, hyperscalers are bypassing traditional delivery models entirely.
- The Hyperscale Nuclear Playbook: Major technology giants have committed billions of dollars across the energy ecosystem, locking in massive multi-gigawatt Power Purchase Agreements (PPAs):
- Microsoft anchored its long-term strategy with a 20-year pact to support the restart of the retired reactor unit at Three Mile Island (Crane Clean Energy Center).
- Amazon expanded its co-location footprint with Talen Energy, securing up to 1.9 gigawatts of nuclear capacity adjacent to its Pennsylvania data center campus through 2042.
- Meta and Alphabet (Google) have diversified their strategies by partnering with traditional utility operators like Vistra Corp. and Constellation Energy, while placing forward bets on advanced Generation IV reactors and Small Modular Reactors (SMRs) from developers like Oklo, TerraPower, and Kairos Power.
- Investment Takeaway: The nuclear renaissance offers a structural tailwind for regulated utilities, nuclear asset owners, and specialized power-infrastructure developers. As the line between Big Tech and energy companies continues to blur, investors should monitor how behind-the-meter generation and SMR commercialization timelines intersect with utility capital expenditures over the remainder of the decade.
Thank you for reading. Until next week's close,
Have a safe and productive Trading week!
Fauzia Timberlake
About the Author: Fauzia Timberlake is a professional options coach and financial strategist specializing in risk management and portfolio architecture for self-directed investors. She is Founder and Managing Partner of Option Engines.
Questions / Comments
We're here to serve IVolatility users and we welcome your questions or feedback about the option strategies discussed in this newsletter. If there is something you would like us to consider and/or analyze, we're always open to your suggestions. Use support@ivolatility.com.
Previous issues are located under the Trade Ideas tab on our website.