Analyzing Bull diagonal spreads in Goldman Sachs |
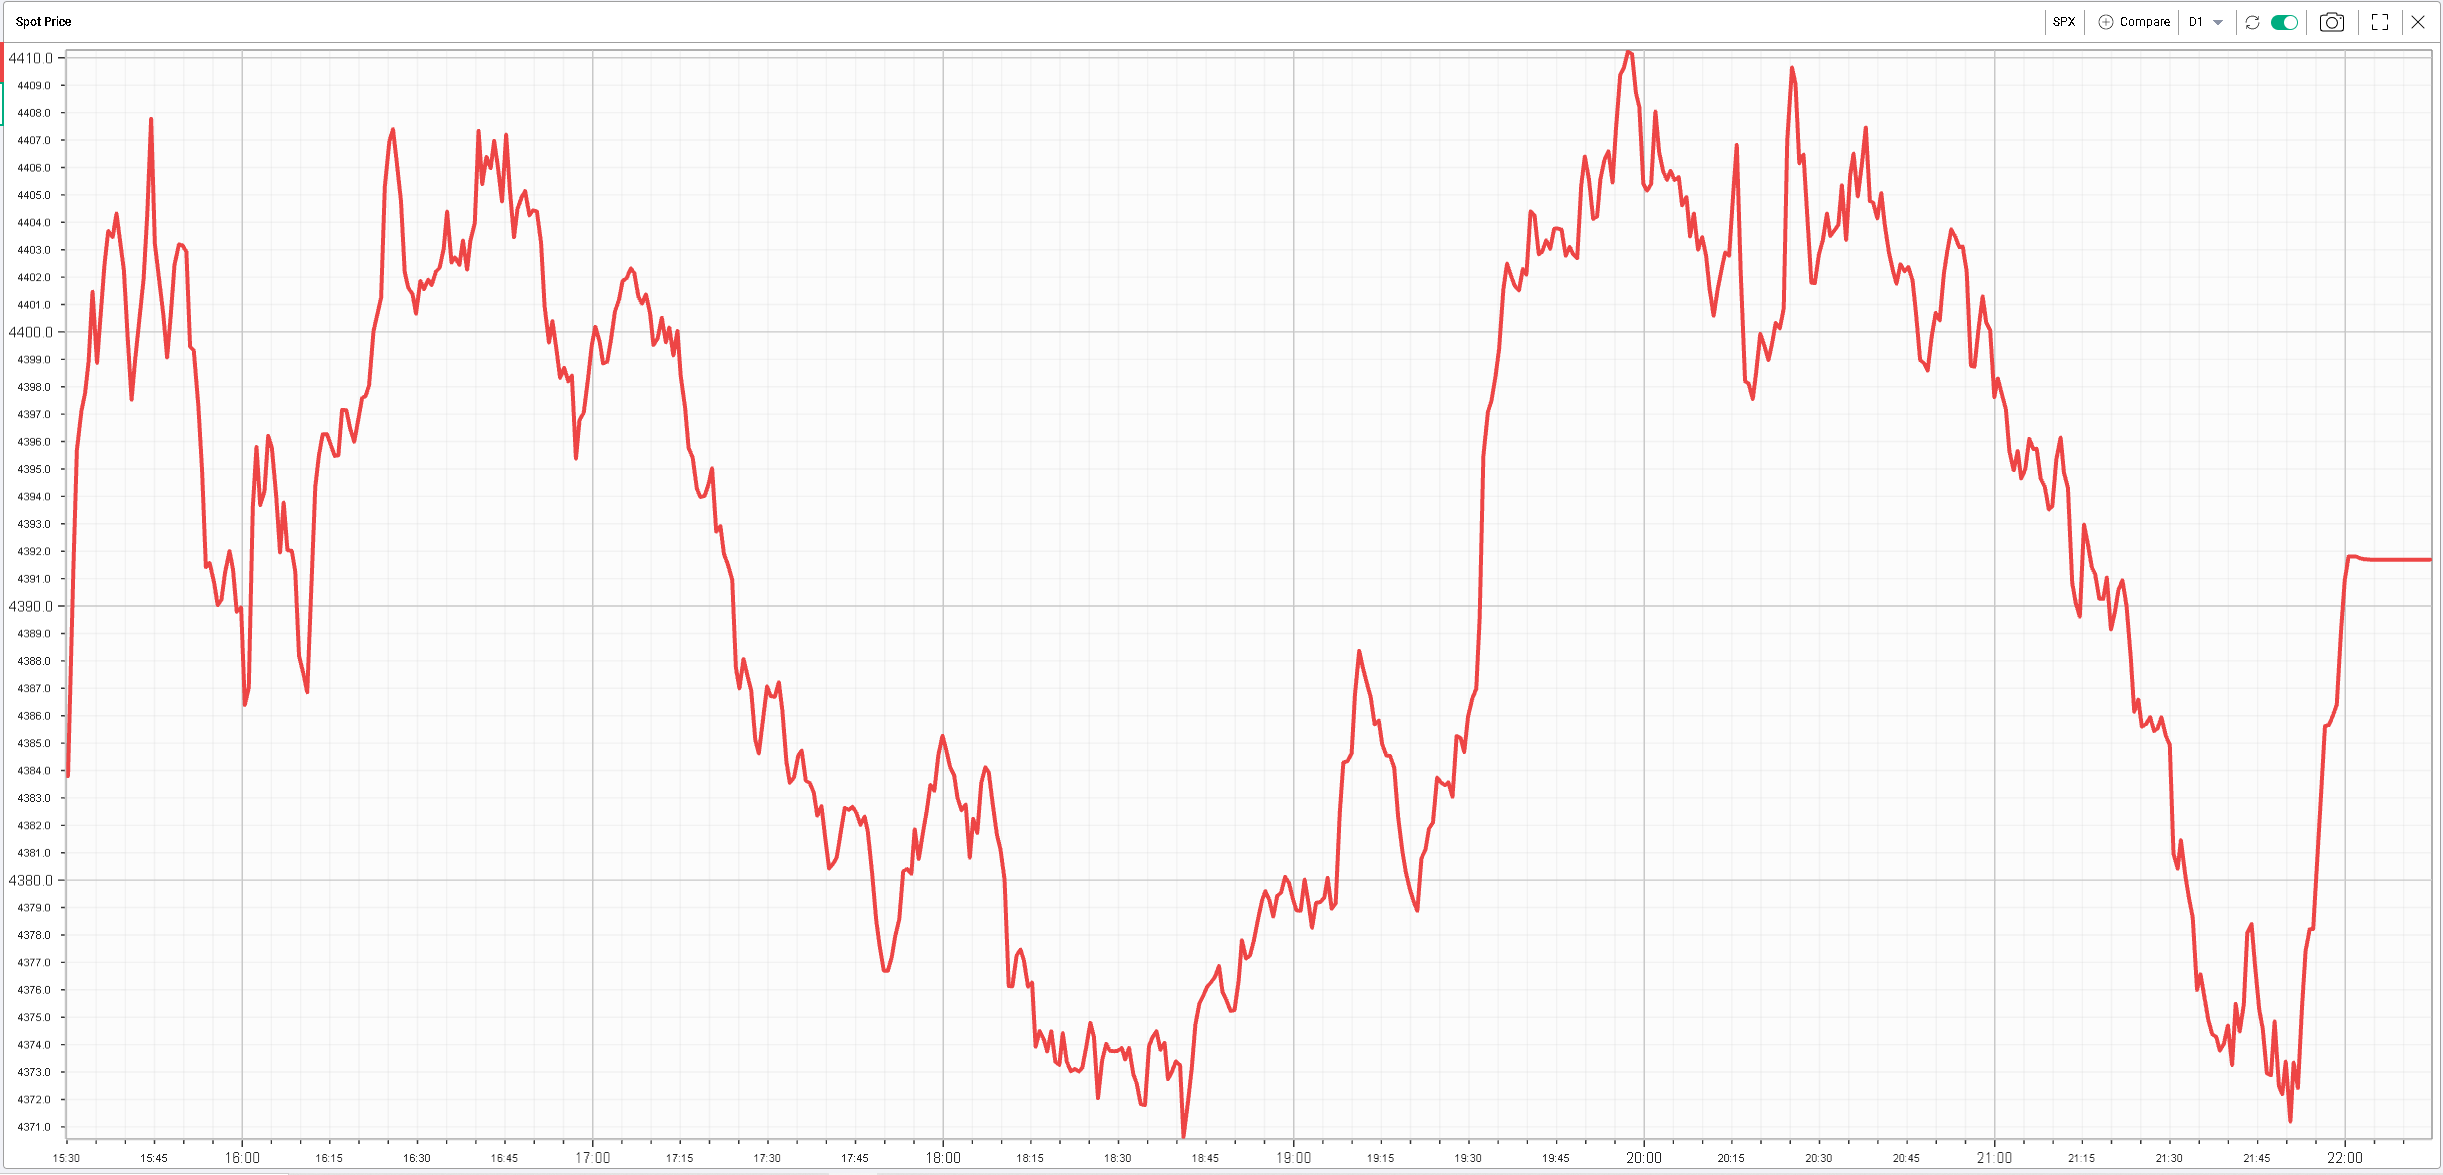
An overall fairly quiet day yesterday with Europe closed and a fairly light session in the US. The below chart recaps yesterday’s session in the SPX which in a 40 points range and closed pretty much in the middle at 4391.7 unchanged on the day. |
|
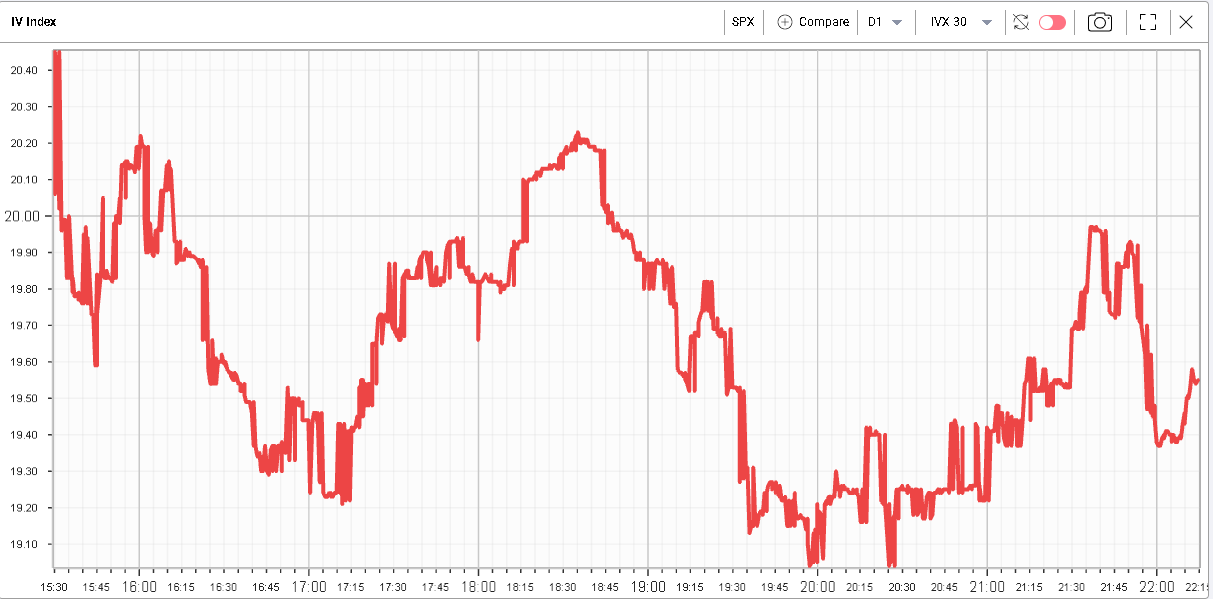
The lack of excitement in spot translated into a lack of interest in volatility with the 30d IVX trading sideways for the best part of the day. |
|
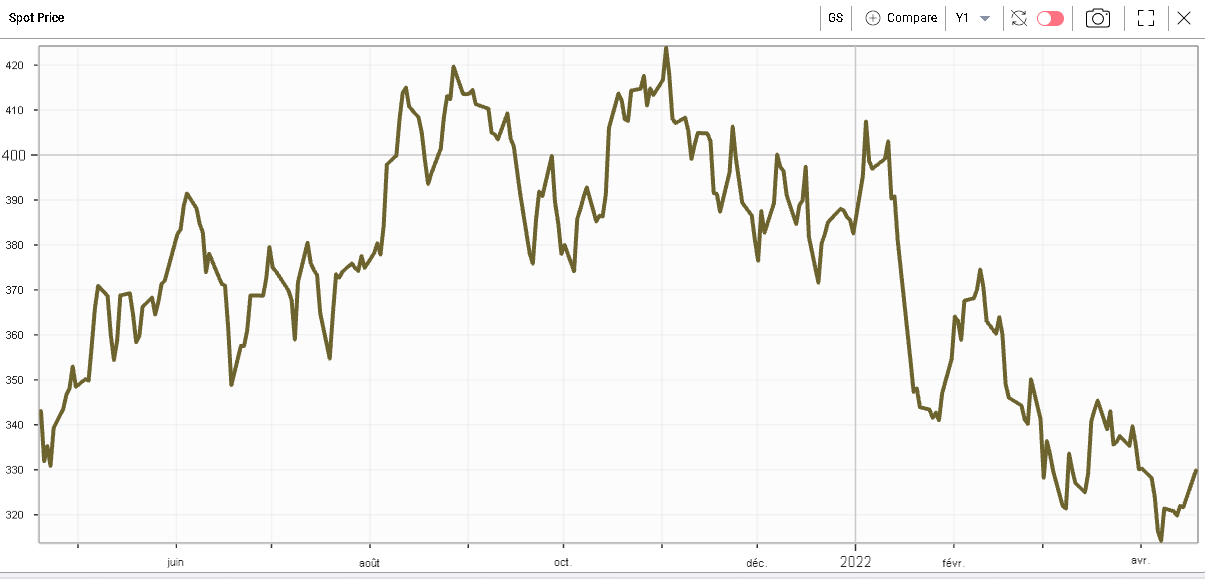
The day was not a complete write-off for stocks in particular in the Financials. Goldman Sachs was up about 2.6% on the day while JPM gained almost 2%. |
With an average net margin of around 20% over the past 5 years, Goldman Sachs may start to look attractive for some investors as the name is down 16.6% on the year so far. |
|
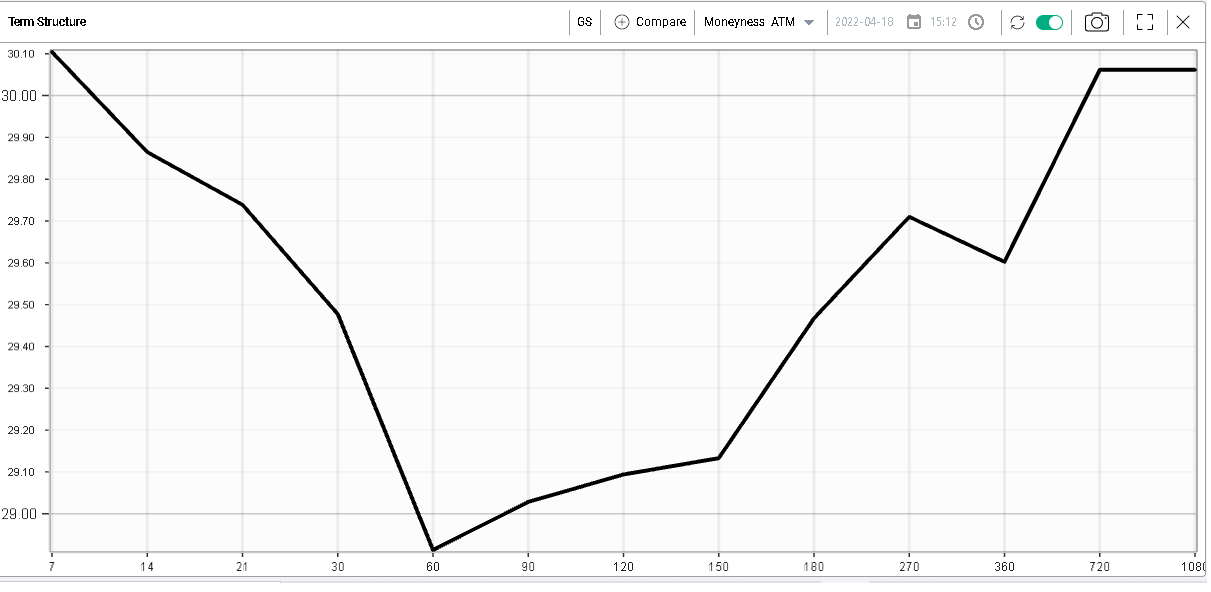
Looking at volatility in the name, the term structure looks inverted in the front before turning upward slopping again further out. |
|
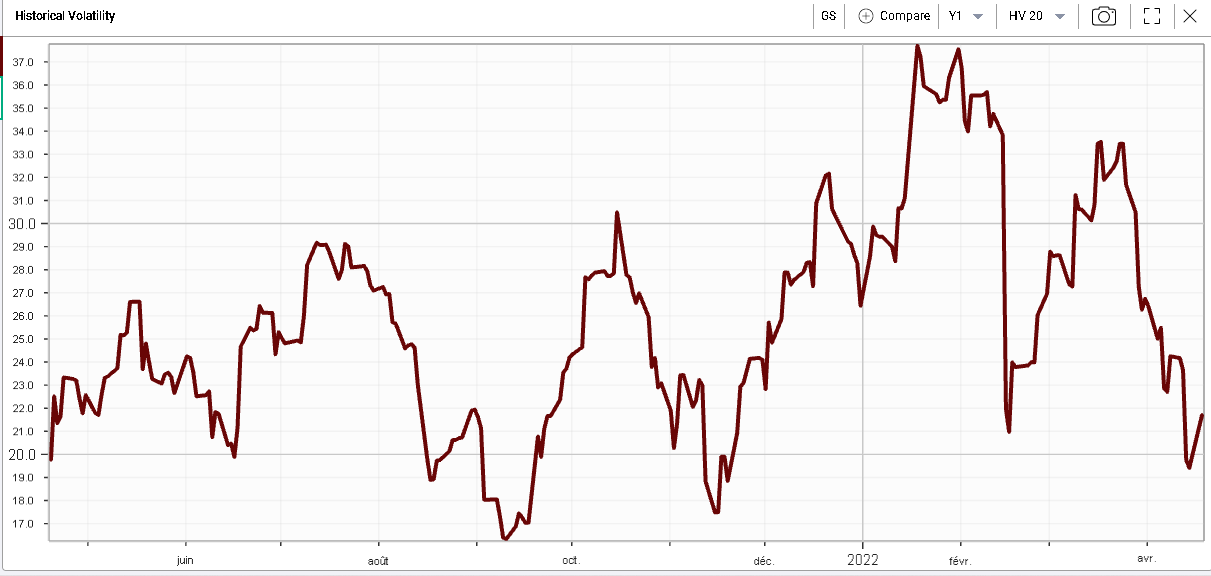
Short dated implied volatility is above 30 while 20 days realized volatility is around 20. Looking at the IVX premium 30d/20d, we can see that the implied is trading at pretty much its highest level relative to realized off the last 12 months. |
|
|
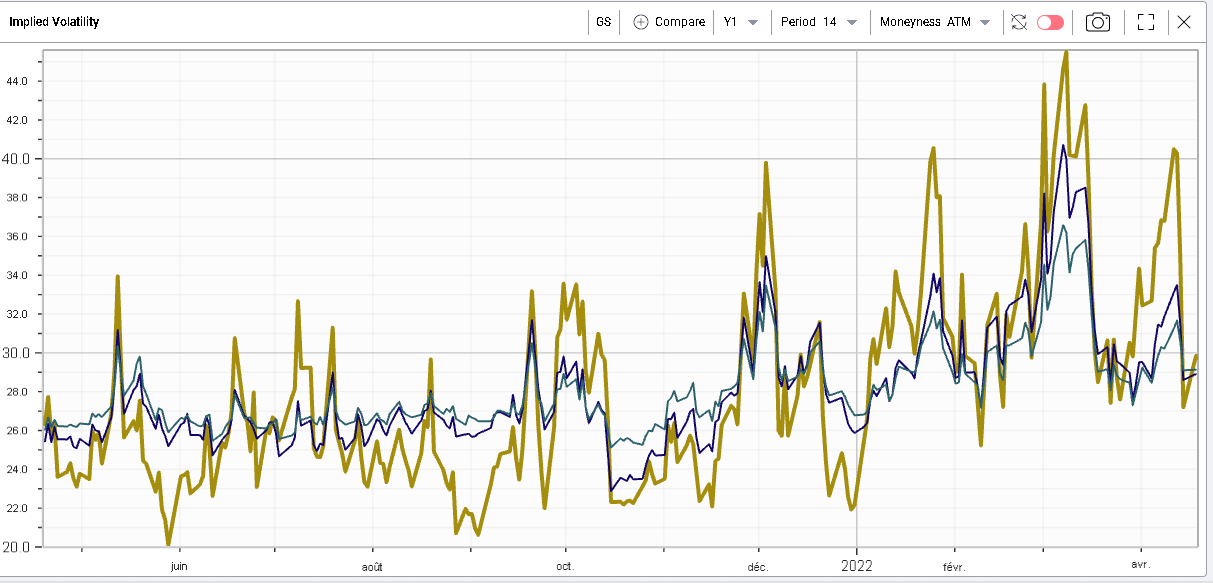
The below chart may look complicated to read at first sight but provides some interesting information. In yellow we show 14 days atm implied volatility, in dark blue we have 60d atm implied volatility and in light blue we find 150d atm implied volatility. |
|
All three vols are currently trading very closely to each other which is not often the case historically. Looking at the RT Spread Scanner, we can locate some attractive bull diagonal spreads that would try to take advantage of short dated implied volatilities looking elevated against realized while 2/3 months implied volatilities seem to be the low point of the curve. |
|
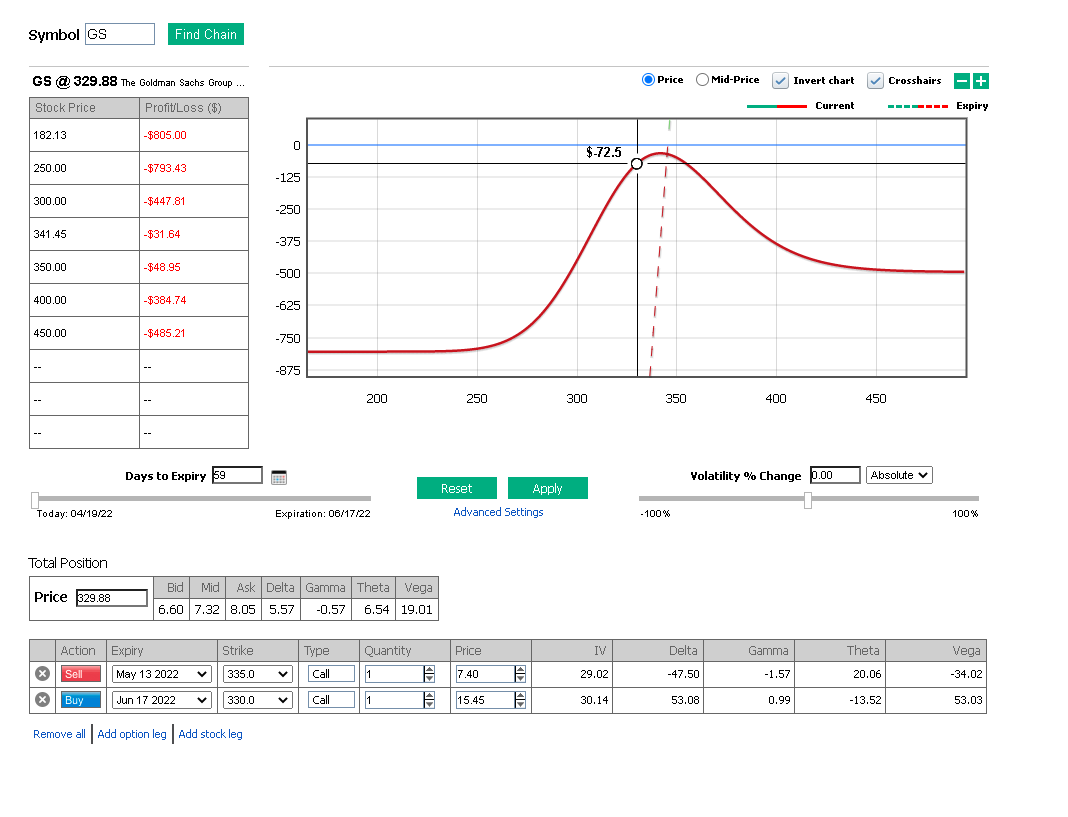
Turning to the PnL Calculator in order to better understand our exposures, we find the following: |
|
Looking at the top right payoff, we can see that our best-case scenario is one where the stock does very little in the short run. If we start to move substantially from the current level this would not be favorable for us. In exchange for that position, we can see that we will be receiving theta. |
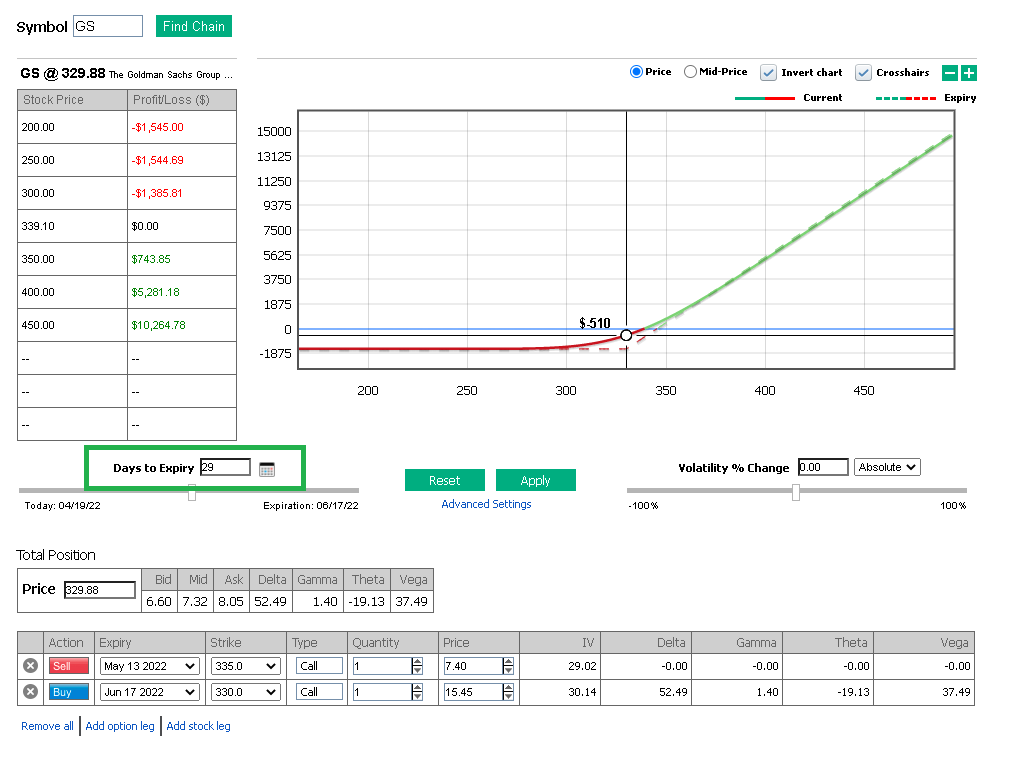
Zooming in 30 days past the 13th May expiration, we can see that the position will then move into a standard long call which will partly have been financed by the short leg (assuming that not much has happened by the expiration). |
|
Disclaimer - This information is provided for general information and marketing purposes only. The content of the presentation does not constitute investment advice or a recommendation. IVolatility.com and its partners do not guarantee that this information is error free. The data shown in this presentation are not necessarily real time data. IVolatility.com and its partners will not be liable for any loss or damage, including without limitation, any loss of profit, which may arise directly or indirectly from the use or reliance on the information. When trading, you should consider whether you can afford to take the high risk of losing your money. You should not make decisions that are only based on the information provided in this video. Please be aware that information and research based on historical data or performance do not guarantee future performance or results. Past performance is not necessarily indicative of future results, and any person acting on this information does so entirely at their own risk. |
