Market News & Research July 5, 2022 Bounce Update |
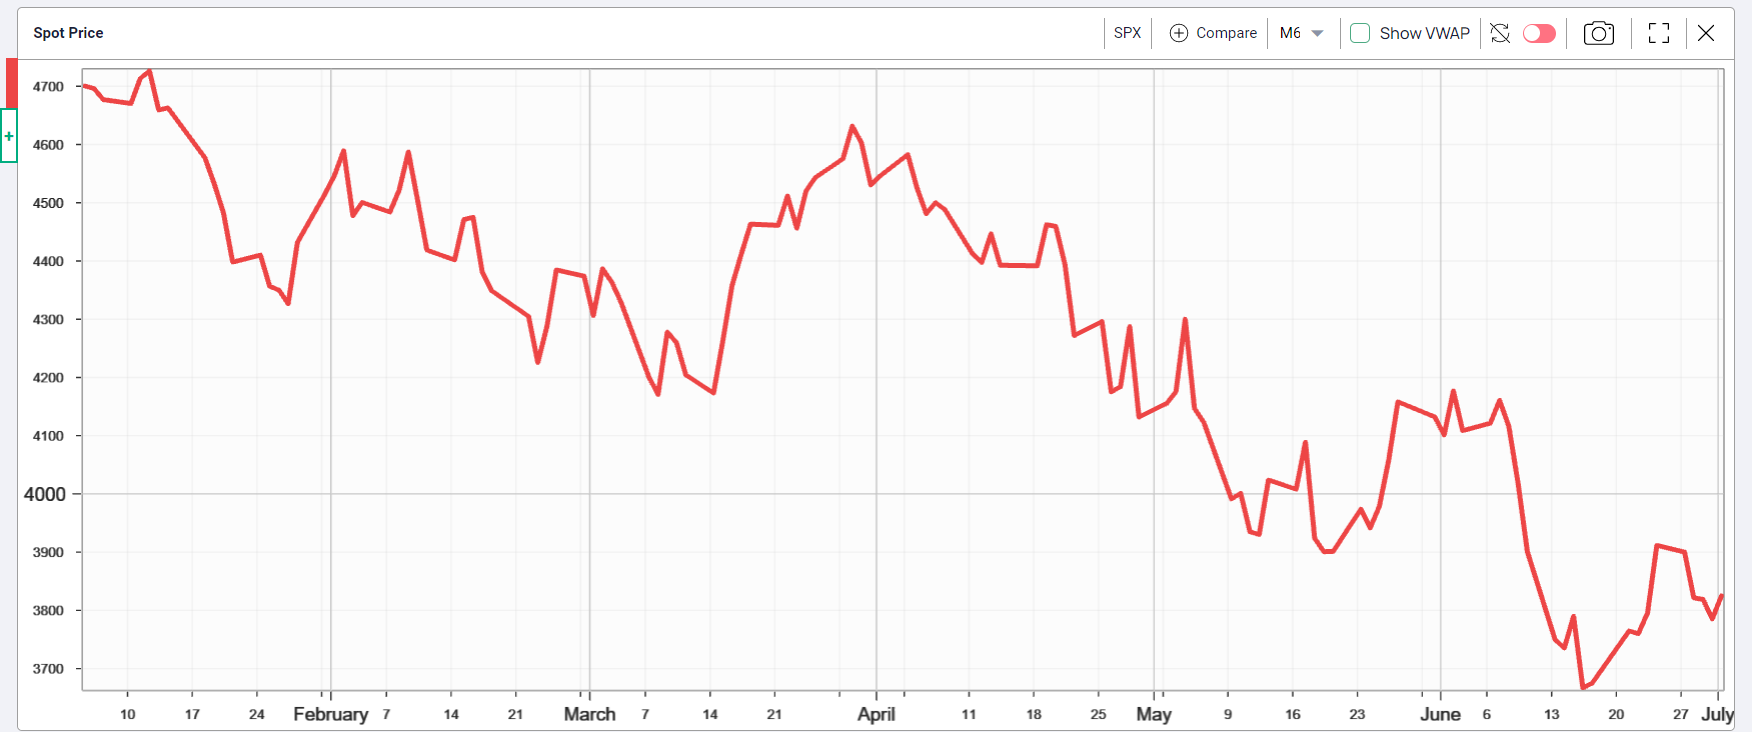
While the S&P 500 Index advance that started on June 21, after making an intraday low on June 17 at 3636.17, still carries a bounce label, a few other signs suggest something more could be going on. For example, market breadth began improving on June 23, while interest rates declined for the second week. More on both below. |
S&P 500 Index (SPX) 3825.33 lower by 86.41 points or -2.21% last week after running into trouble on Tuesday by declining 78.58 on increased recession chatter and news of earnings estimate cuts. Thursday's further decline of 33.45 points could become the retest of the June 17 low at 3636.17, after Friday's advance. However, it may just reflect some short covering ahead of the long holiday weekend in case of unexpected positive news. |
Assuming Friday's advance continues watch the 50-day Moving Average at 4005.82, the next bounce objective. Then a close back above 4017.17 would fill the second gap made on June 10 made on the way down, now the second bounce objective. |
Finally, the third bounce target becomes the June 2 high at 4177.51 since a close above this level would begin confirming the end of the downtrend from March 29 high at 4637.30. The 200-day Moving Average along with the downward sloping trendline from the January 4 intraday high at 48.18.62 then becomes the next challenge at ending the bear market and discourage any remaining sell-the-rippers. Oh, while on the subject of sell-the- rippers here's a quote. |
"... a bear market is one that doesn't stay up long enough for you to sell. Mike O'Rourke - Jones Trading. |
Previous comments that the low made on June 17 at 3636.87 may mark the low for this bear cycle needs some help from interest rates. So last week's decline in yield on the U.S. 10-Year Treasury Note yield by 25 basis points to end at 2.88%, in addition to 12 basis points the week before, certainly helped although attributed to recession calls from almost every corner especially last Wednesday when the recession siren began whaling and the yield dropped 10 basis points. Rates continue below, first the SPX chart. |
|
At the ECB Forum in Sintra, Portugal last week, everybody except Japan agreed rates need to continue rising in a global push to control inflation regardless of increased recession risk. Accordingly analysts need to continue lowering GDP growth and earnings estimates that some claim are the sine qua non (essential condition) for a market bottom. Indeed, the Atlanta Fed's GDPNow model released on Friday estimated second quarter GDP at -2.1%. |
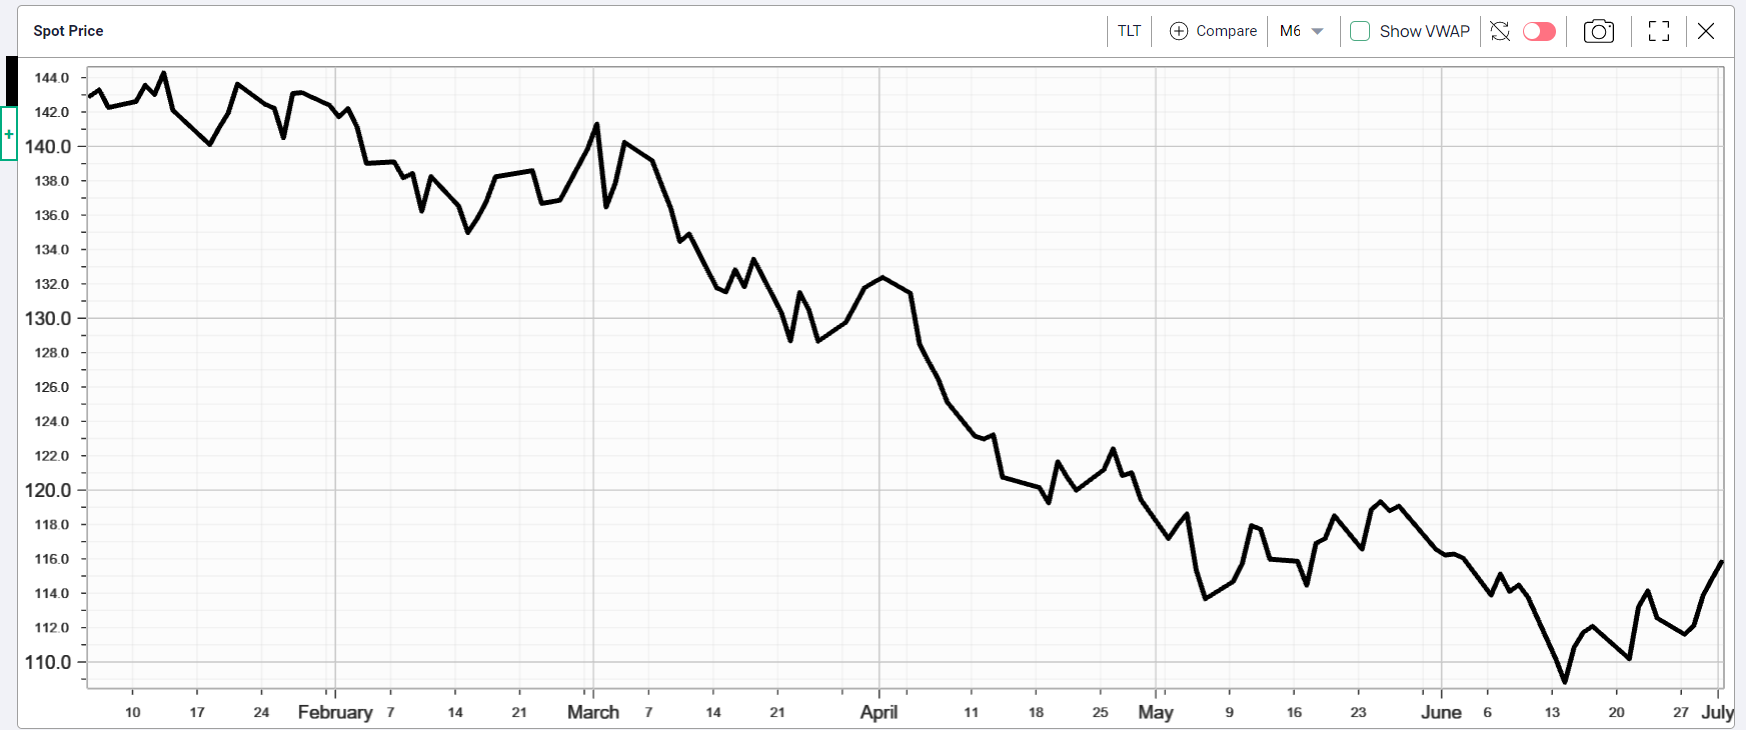
iShares 20+ Year Treasury Bond ETF (TLT) 115.82 gained 3.48 points or +3.10% last week and closed above the downward sloping trendline from the March 1, 2022 intraday high at 141.34 with the early look of a potential Head & Shoulders Bottom pattern. |
|
Market Breadth as measured by our preferred gauge, the NYSE ratio adjusted Summation Index that considers the number of issues traded, and reported by McClellan Financial Publications gained 68.48 points last week to end at -466.50 and closed back above its 50-day Moving Average at -527.26. Improving breadth supports the view of slowing downward equity momentum. At important turning points breadth often gives early signals. |
Implied Volatility |
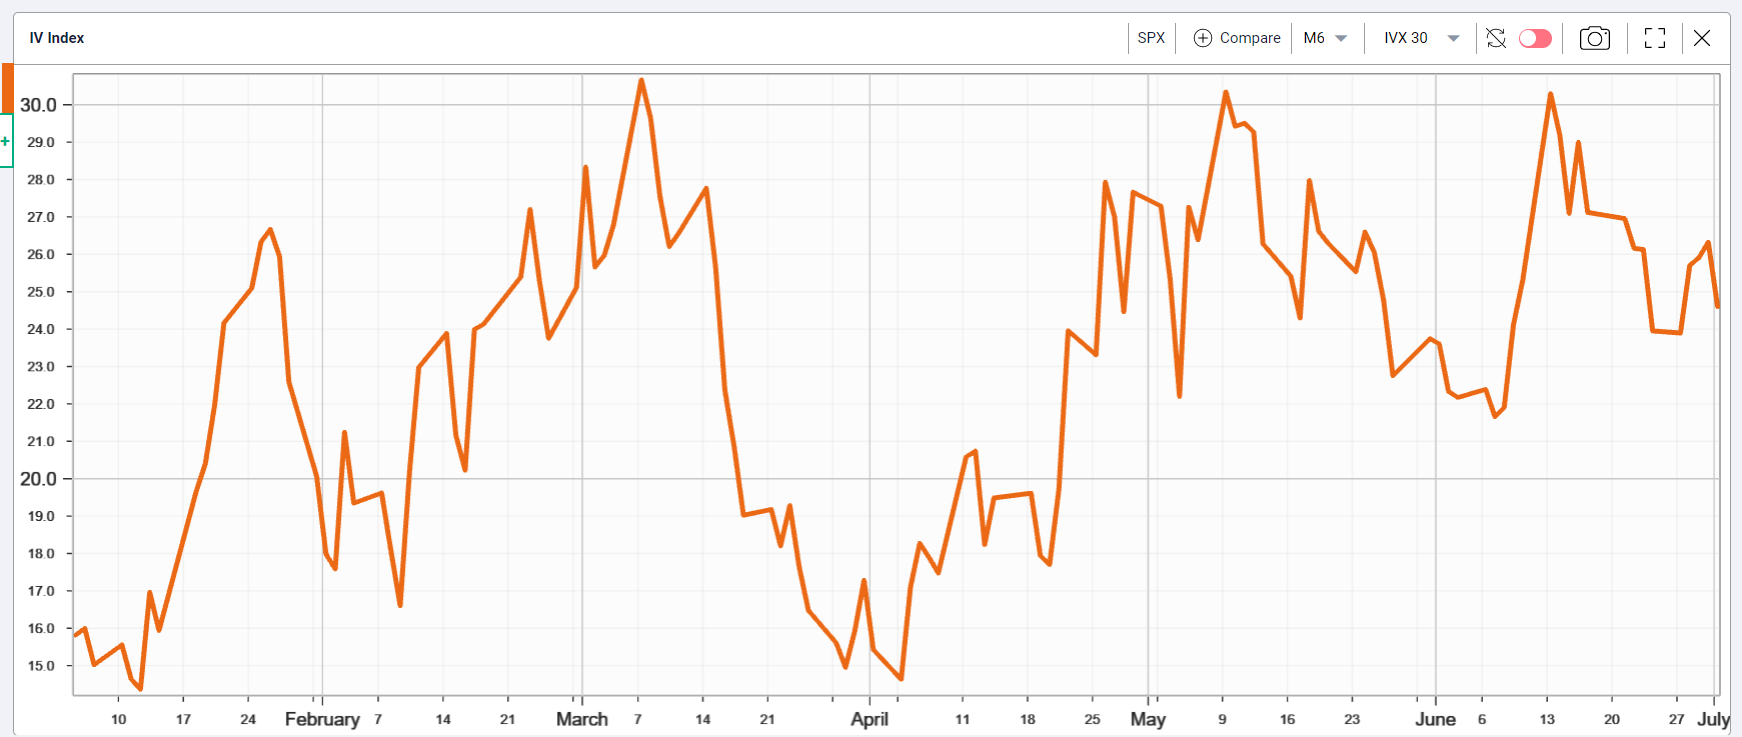
The SPX options implied volatility , IVX advanced slightly up .65 points or +2.71% ending Friday at 24.60% , just above the mean from August 27, 2021 at 19.08% after declining 3.17 points or -11.69% to end at 23.95% for the week ending June 24. |
|
Summing Up |
While it may be premature to claim the June 17 low at 3636.17 as the cyclical bottom just as it may be premature to claim interest rates have peaked, the bottom isn't a place it's a process and the process now seems underway. On the other hand, some claim equities won't bottom before a dramatic capitulating decline on extremely high volume. They may be right, in the meanwhile, trade what you see not what others say. |


