Market News & Research July 11, 2022 Bounce Momentum Faded |
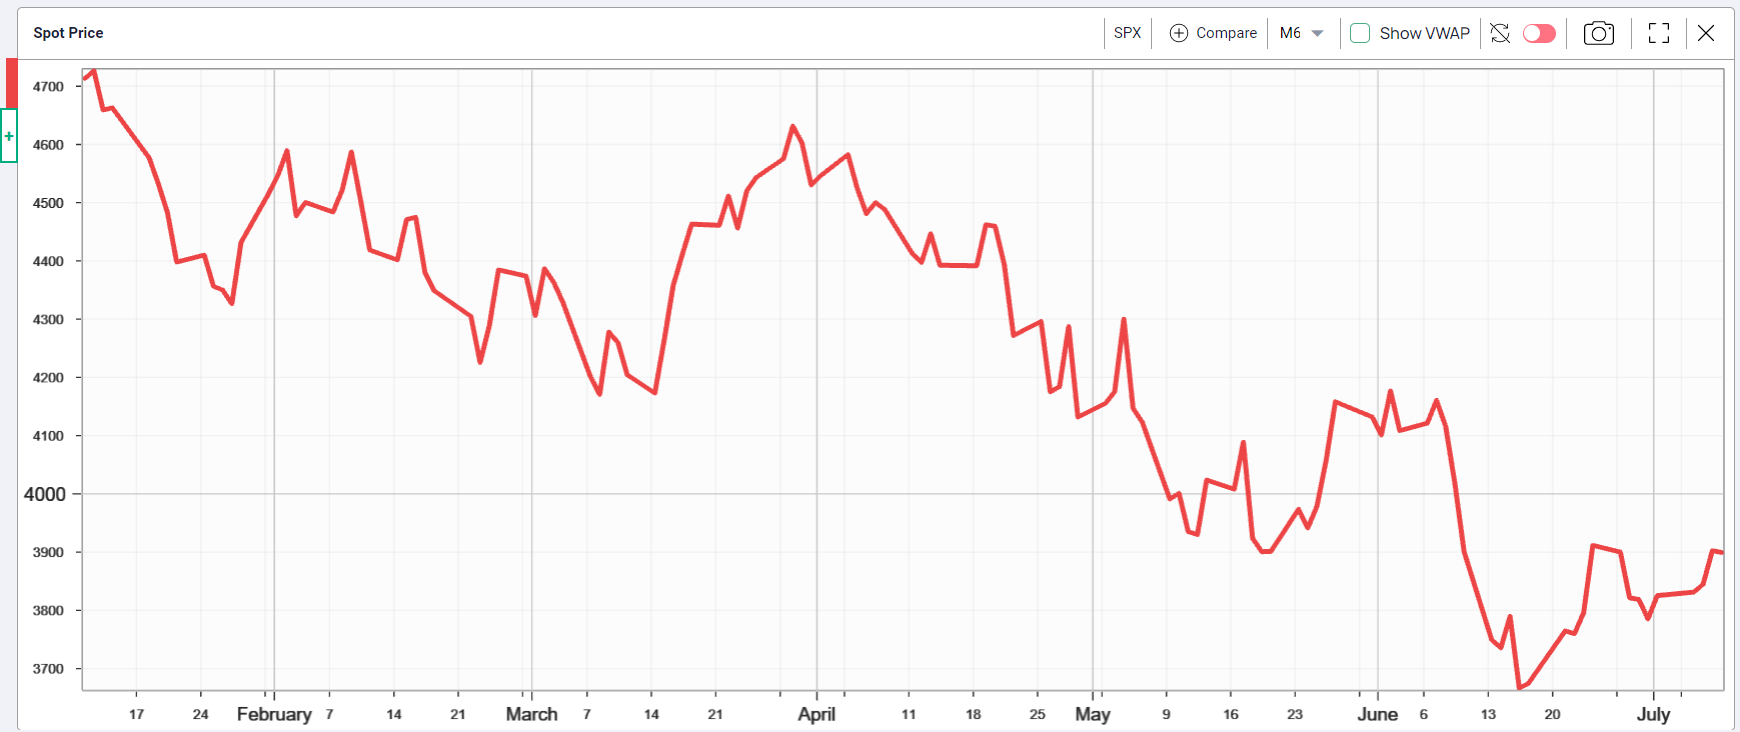
Just when it looked as if easier interest rates would help the advance that started on June 21, despite the setback that occurred on June 28, when it abruptly turned lower on recession worries, last week bond traders sold the bounce underway pushing rates back up again. As a result, the S&P 500 Index momentum seemed to fade and struggle to continue moving higher by the end of the week. Details follow. |
S&P 500 Index (SPX) 3899.38 advanced 74.05 points or +1.94 last week mostly attributed the 57.54 point gain made on Thursday before release of the employment data on Friday. In addition to the Consumer Price Index scheduled for release on Wednesday along with Q2 earnings reporting begging with the big banks on Thursday and Friday that likely include some earnings estimate cuts already underway in some sectors. |
The objectives useful for measuring the strength of the bounce - all represent resistance; noted last week in Bounce Update, remain in place. The first at the 50-day Moving Average now 3972.65 and sloping downward followed by 4017.17 needed to fill the remaining open gap made on June 10 made on the way down. |
The third target is the June 2 high at 4177.51. A close above this level would likely confirm the end of the downtrend from March 29 high at 4637.30. Then a close above the 200-day Moving Average now 4379.56, would confirm an end to the bear market. |
While a potential Head & Shoulders Bottom could be forming, a reversal from any resistance point indentified above, or any other point, could set off another leg down should it close below the June 17 low at 3636.87. |
First, the Consumer Price Index on Wednesday and the first round of Q2 reporting that start this week. |
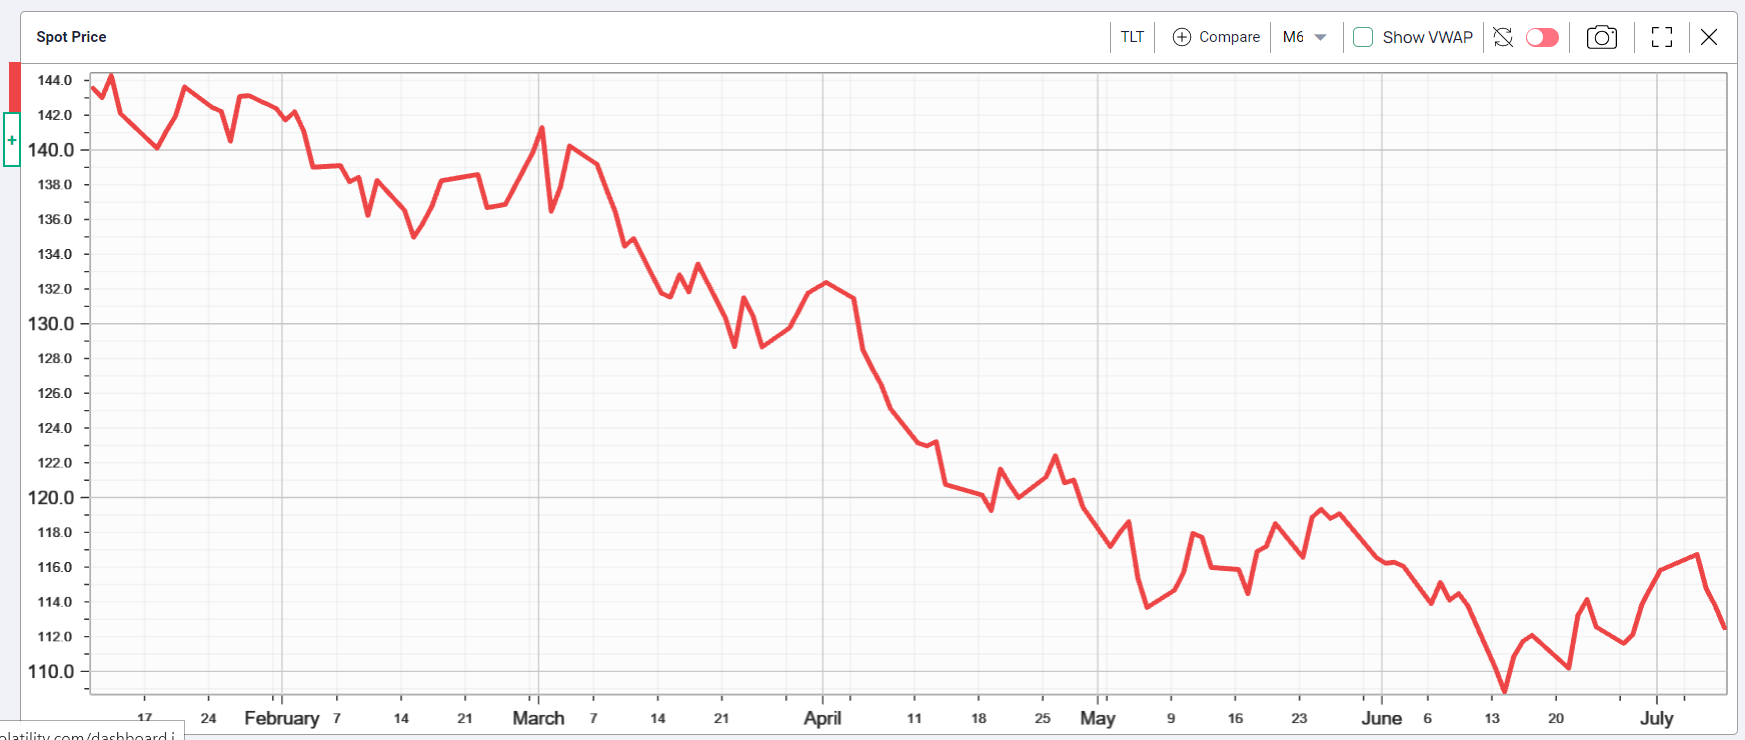
Referring to the lack of support from interest rates last week, the yield on the U.S. 10-Year Treasury Note gained 21 basis points to end at 3.09% offsetting the previous week's decline of 25 basis points due to recession chatter and speculation that the Fed may pause raising rates sooner than previously expected. That all changed last week. Interestingly, the yield on the 20-Year Bond gained 18 basis points for a yield of 3.53% as the curve flattened (see the TLT chart below). |
The SPX chart. |
|
iShares 20+ Year Treasury Bond ETF (TLT) 112.50 declined 3.32 points or -2.87% last week closing still above the downward sloping trendline from the March 1, 2022 intraday high at 141.34, but below the 50-day Moving Average. Although a convenient way to track interest rates, be aware when short term rates increase faster and the yield curve inverts. For example, the spread between the 10-Year and 2-Year Notes inverted last Wednesday by 4 basis points and ended Friday inverted by 3 basis points. |
|
Market Breadth as measured by our preferred gauge, the NYSE ratio adjusted Summation Index that considers the number of issues traded, and reported by McClellan Financial Publications gained another 77.58 points last week to end at -388.92; slowly trending higher above its 50-day Moving Average at -539.09. |
Implied Volatility |
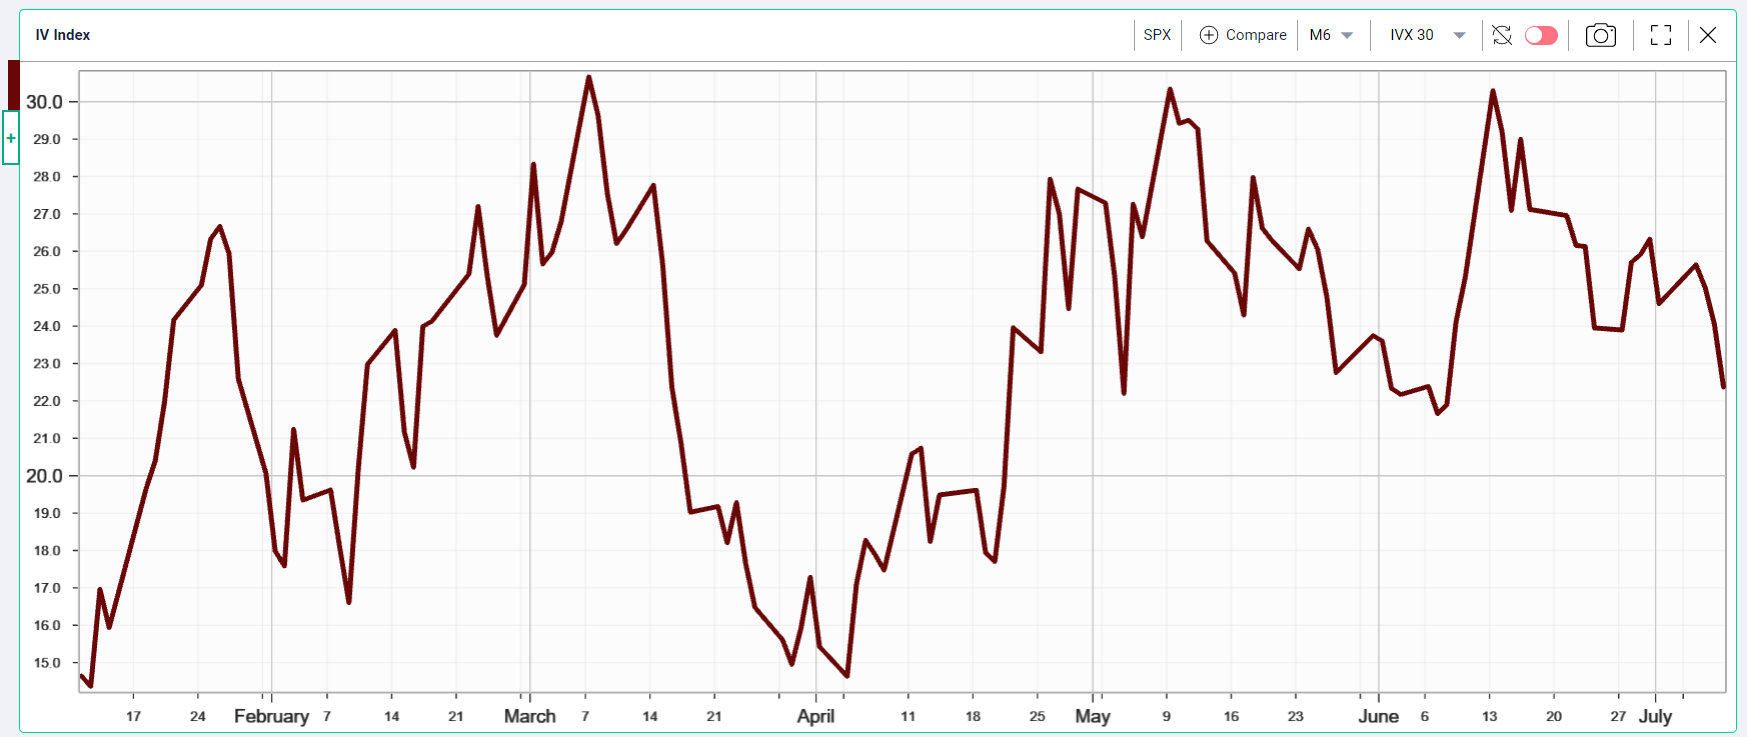
IVX Compared to July 1 at 24.60%, SPX options implied volatility declined 2.23% to 22.37% confirming less hedging and bear market positioning activity last week. Lower than usual sum total of individual stock volume last week most likely reflects waiting for the June CPI report and Q2 earnings reporting to begin this week. |
|
Summing Up |
Bond traders took advantage of recent gains to sell the bounce pushing rates back up again supporting the view that rates have not peaked. Equities continue higher without conviction or noticeable reaction to Friday's June employment report. Three upside targets provide an objective way to measure any remaining strength in the bounce that began from the June 21 low. In addition to Q2 earnings getting underway on Tuesday, the June CPI data on Wednesday should be the main event. |


