Market News & Research - Yield Curve Inversion
July 18, 2022
Understandably, an increase of 1.3% or 9.1% year-over-year for the June Consumer Price Index released on Wednesday rightfully attracted considerable media commentary. Fewer paid attention to the yield curve inversion as the yield on the 2-Year Treasury Notes increased and yield on the 10-Year Notes decreased. Historically sustained inverted yield curves precede recessions by several months or in some cases like January 2006, almost two years or June 1998, just under three years. However, it does signal for markets to continue preparing for a recession
Wednesday the yield on the 2-Year Note gained 10 basis points (bps) while the 10-Year yield declined 5 bps ending with a 22 basis point inversion. Friday it narrowed slightly to 20 bps inverted.
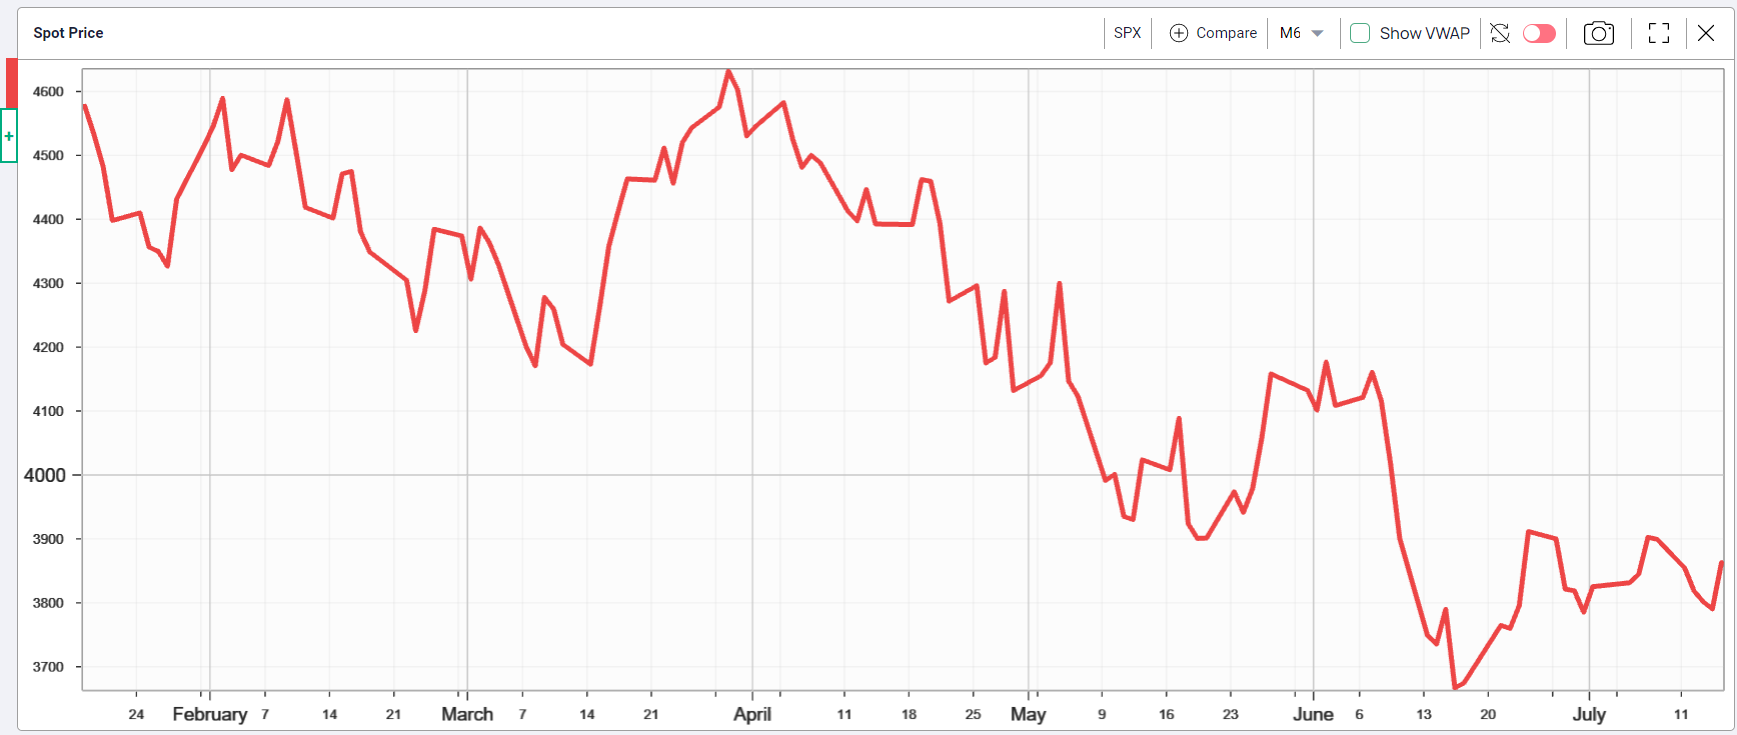
S&P 500 Index (SPX) 3863.16 slipped 36.22 points or -.93% last week declining every day making lower highs and lower lows except Friday when it opened gap higher then closed up 72.78 points. While it's easy to attribute Friday's reversal to the June retail sales report of +1% along with the July University of Michigan consumer sentiment at 51.5, both slightly better than expected, the July monthly options expirations on Friday likely also played an important role as market makers attempted to reduce their assignment exposure to in-the-money short puts.
Fridays' gap up open bounce created a new small double bottom technical pattern from the July 5 and July 14 lows. Should the advance continue and close above the July 8 high of 3,915.50, it would activate the pattern with an upside measuring objective at 4105. Before reaching that objective it would need to overcome resistance from the 50-day Moving Average at 3936.54 now sloping downward. The next objective would be the still open gap at 4017.17 made on June 10 on the way down.
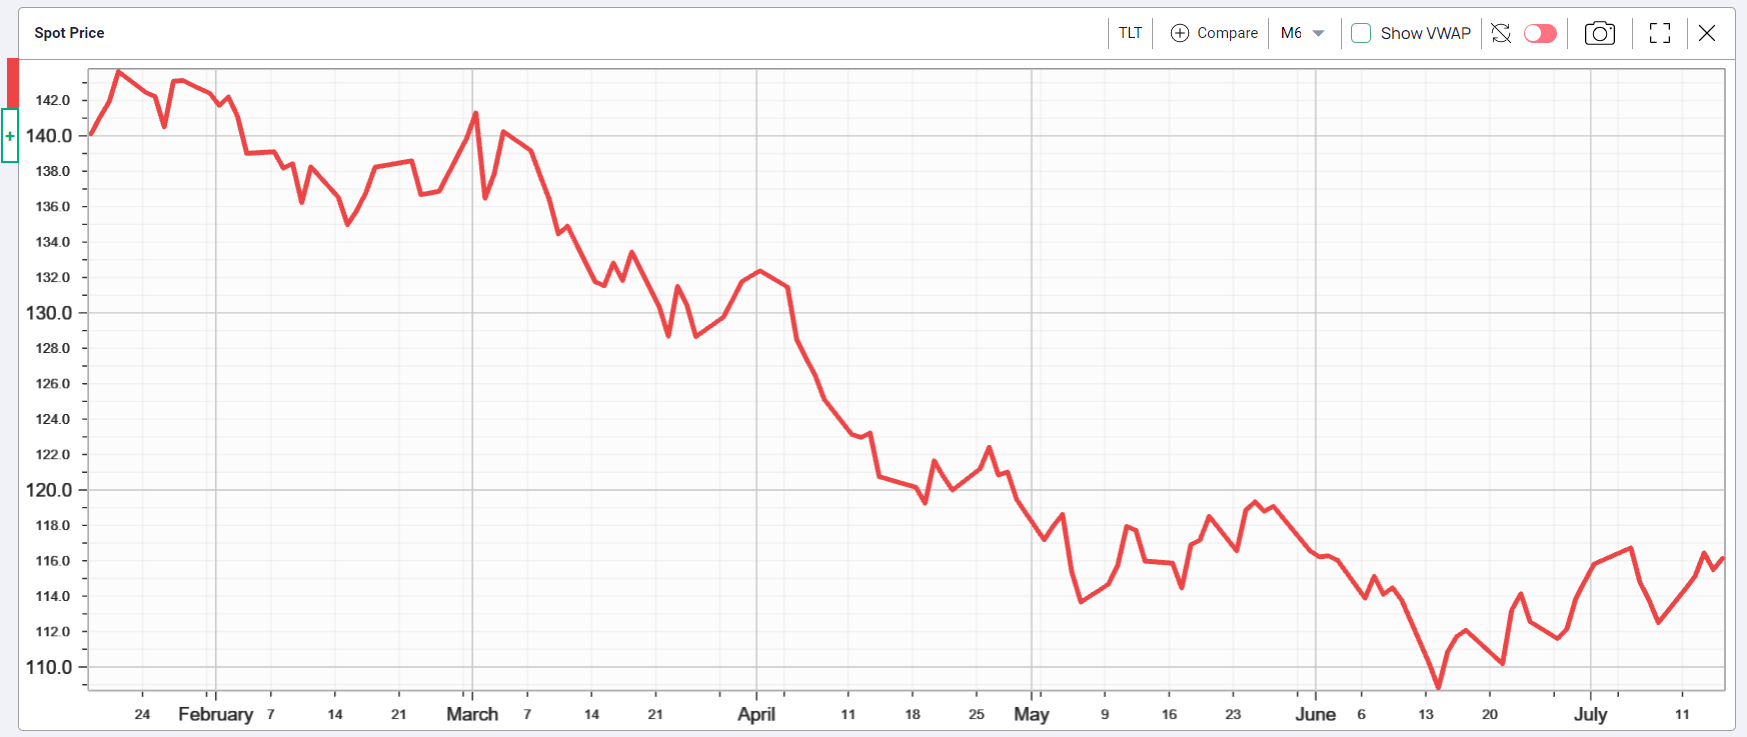
Increased recession chatter as short-term rates increase and long rates decline reflects the bond market beginning to speculate that the Fed may pause raising rates in a year or perhaps a bit longer. Last week the yield on the U.S. 10-Year Treasury Note declined 16 bps last week to end at 2.93% as the curve inverted. The yield on the 20-Year Bond dropped 19 bps to end with a yield of 3.34% (See the TLT chart below).
The SPX chart.

iShares 20+ Year Treasury Bond ETF (TLT) 116.14 advanced 3.64 points or +3.24% last week closing on the downward sloping trendline from the March 1, 2022 intraday high at 141.34, and well above the 50-day Moving Average at 114.72. While a convenient way to track long-term interest rates and bond market recession expectations, the inversion of the 10-Year and 2-Year Notes receives the most attention and concern.

Implied Volatility
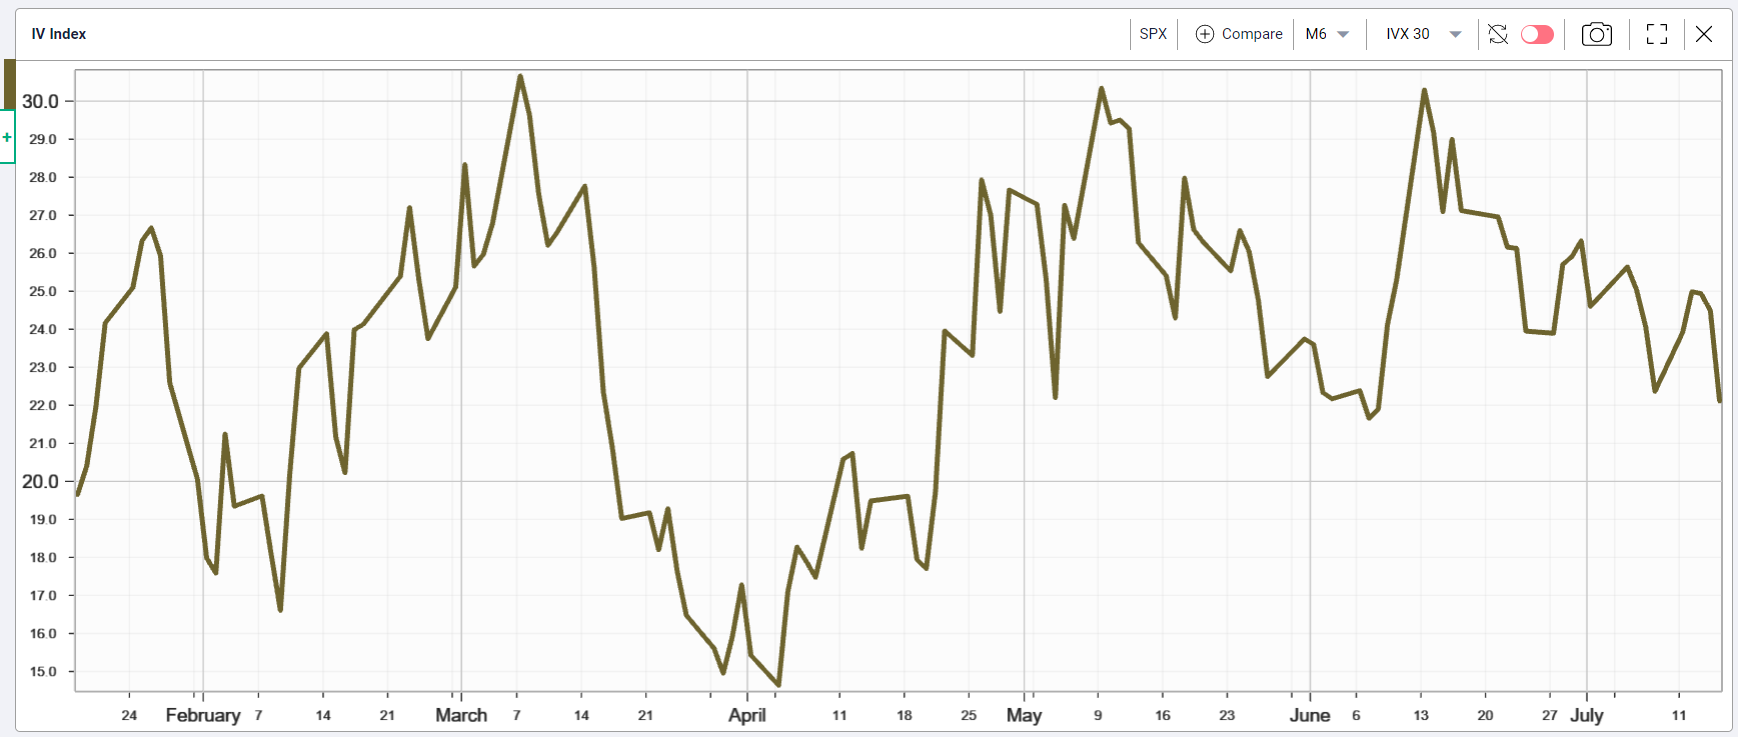
SPX options implied volatility index IVX declined .26% to 22.11% last week reflecting Friday's gap up and higher close, while down 2.38% from 24.49% on Thursday before Friday monthly options expiration. However, total combined SPX volume of 2.3 bn shares diminishes the argument that gains were due to unusual put option activity.

Summing Up
Bond buyers responded to the CPI report by buying the short end of the curve while selling the long creating an unmistakable yield curve inversion and signaling increasing recession odds. Friday's advance created a potential small double bottom pattern with a new measuring objective above resistance from the 50-day Moving Average.
Presuming the market can't bottom until estimates are cut, this week should all be about earnings reports along with cuts as analysts rush to include a recession in their estimates and catch up to the declining market.
Consider this market adage. "Never buy anything until the whole market demonstrates its ability to ignore bad news."