Core Inflation Shocker
September 19, 2022
Starting Wednesday September 7, the S&P 500 Index rocketed higher as if somebody had inside information that the upcoming CPI report would be weaker than expected. Barron's wrote Monday "A soft inflation reading Tuesday could encourage a slower pace of increases in the months ahead."
Momentum based upon that rosy scenario ended abruptly when the CPI report revealed a much larger than expected increase in the core inflation rate. Equities opened with a gap lower and dropped straight off the cliff signaling the end for dip buyers who may now be living on borrowed time.
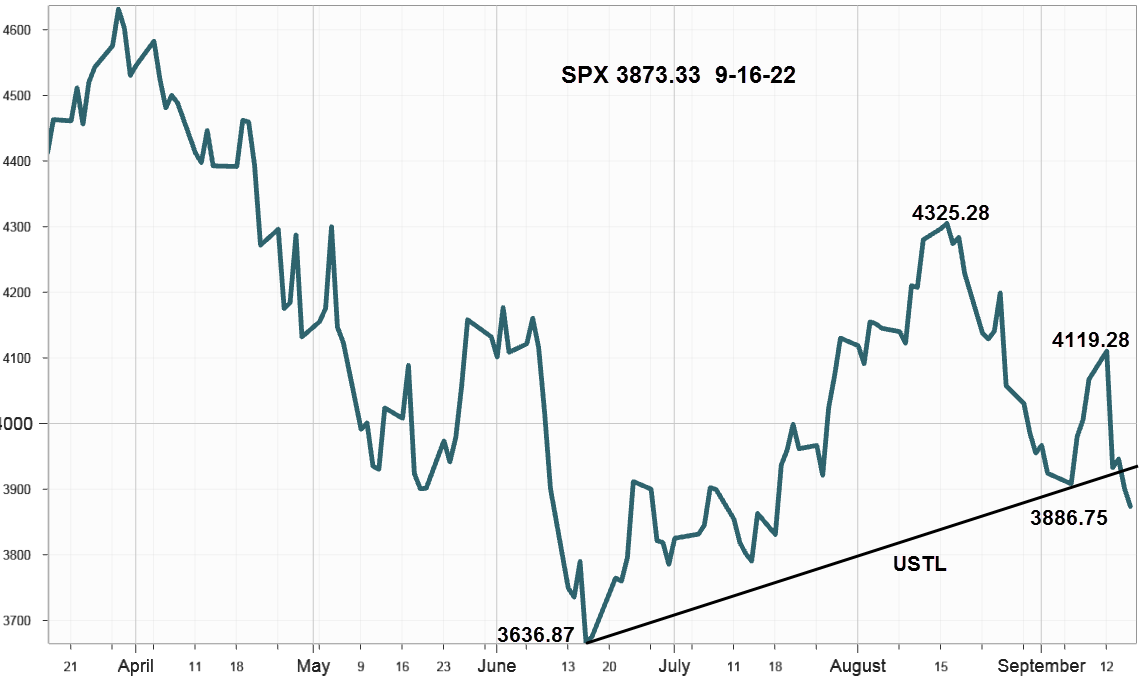
S&P 500 Index (SPX) 3873.33 dropped 194.03 points or -4.77% for the week closing below the newly created upward sloping trendline, USTL on Thursday (see chart) generating another sell signal. Now the odds favor closing the gap made between the July 14 high at 3,796.41 and the July 15 opening low at 3,817.18. Then continue lower to the bottom of the July 14 range at 3,721.56. After that it's the June 17 low at 3,636.87 in about a month, say mid October, perhaps sooner.

With the upcoming FOMC meeting followed by Jay Powell's usual comments and question session on Wednesday afternoon, the markets will have already priced in a 75 basis points (bps) hike
Interest Rates
Once again, rates increased across the entire curve with the 10-Year Treasury Note ending at 3.45% up 12 bps. The 2-Year Note increased 29 bps to 3.85% for a 10-2 inversion spread of -40 bps compared to -23 bps on September 9 with the 3 month bill at 3.20% up 12 bps that's starting to challenge the equity dividend yield at 1.56% based upon the SPDR S&P 500 ETF (SPY). At this level some money will likely move from equities into short-term paper to replace maturing Treasury bills on the Fed's balance sheet pursuant to the quantitive tightening plan or QT.
Market Breadth as measured by our preferred gauge, the NYSE ratio adjusted Summation Index that considers the number of issues traded, and reported by McClellan Financial Publications continued lower last week declining 100.86 points to end at -134.92, well below the 50-day Moving Average up at 206.53.
Implied Volatility
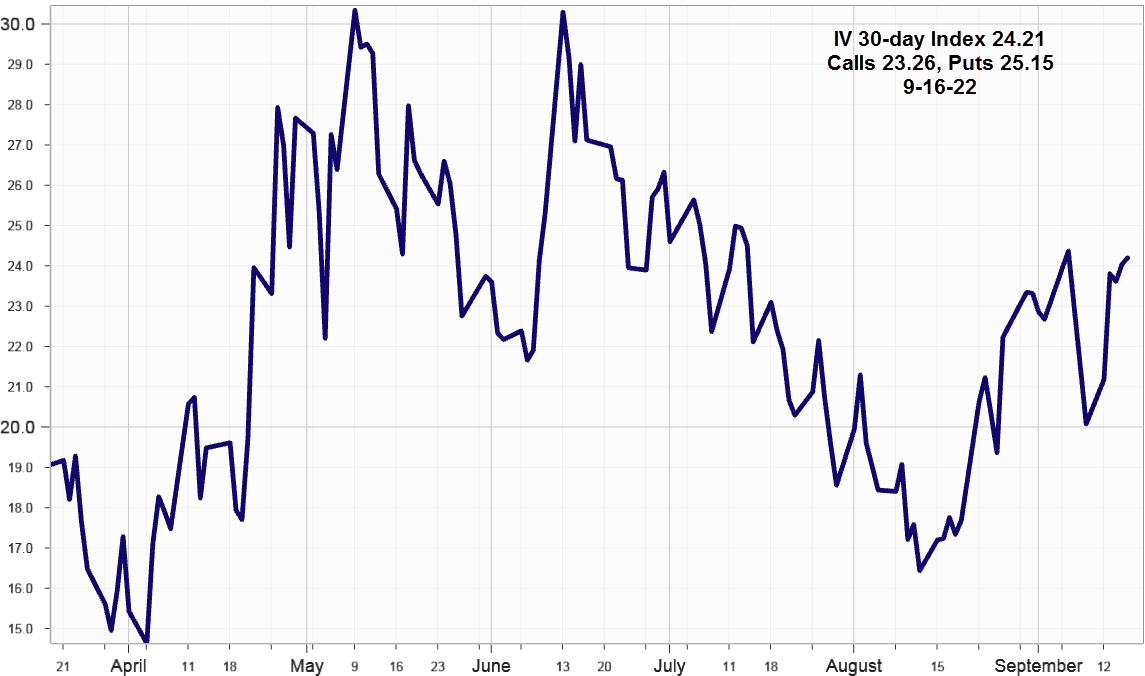
SPX options implied volatility index, IVX jumped up 3.33% to 24.21% from 20.88% on September 92 with the Calls at 23.26% and Puts at 25.15% still skewed.

The equity only put call ratio ended Friday at .81 approaching the September 1, peak at .84. On Tuesday when the SPX declined 177.72 points after the CPI report, the ratio increased to .73 from the day before at .57. Friday's high ratio also reflects increased September monthly options expiration activity confirmed by SPX combined volume increasing to 4.4bn shares from 2.5bn on Thursday.
Summing Up
Last week's early plan for the SPX to continue higher and test the 200-day Moving Average based on a weaker than expected CPI report, ended suddenly and dramatically after the release of a higher than expected core inflation report.
The SPX broke support from the newly established USTL thereby greatly increasing the probability it will soon retest the June 17 low at 3,636.87. First Jay Powell will announce another likely 75 bps hike to the fed funds rate, which will already be reflected in the prices. Every word of his answers to questions will be pored over like scientist looking through a microscope hoping to divine the exact future day the Fed stops raising rates.
In the meanwhile, rates continue to rise and the yield curve inversion increases, i.e. more negative, an indicator with a reliable recession forecasting record but with variable time lags.