A market for the nimble trader
October 7, 2022
We are now firmly into the wait and see period ahead of the release of today’s Non-Farm Payrolls. Consensus seems to be looking for around 250k job creations, compared with last month’s 315k.
Average hourly earnings are expected to slow to 5.1% YoY compared with 5.2% last month with the unemployment rate staying around 3.7%.
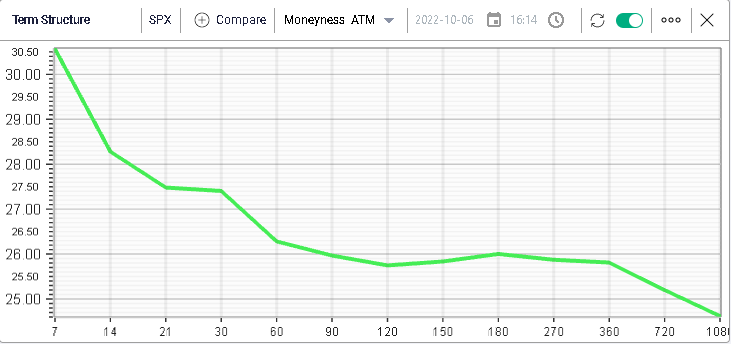
As usual, those numbers are highly anticipated with short dated options priced with an IV above 30% on the SPX.

Looking back at yesterday’s price action, we note that the SPX lost around 1% over the session while the NDX dropped 0.75%.
Implied volatilities went up, driven by short-dated options as shown on the above term structure chart.
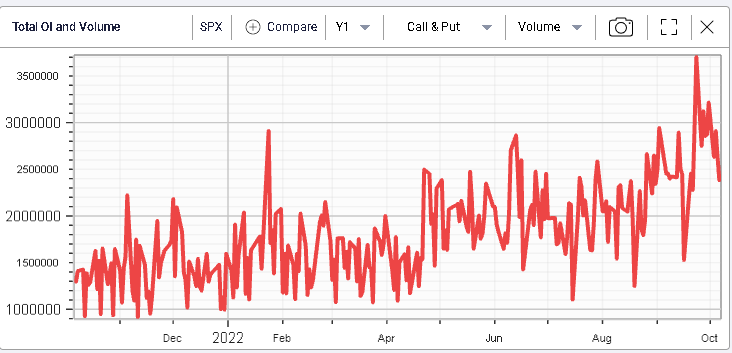
Options volumes remain elevated with around 2.5 million contracts trading over the day on the SPX.

Looking at yesterday’s volume, we continue to see very elevated short dated options volumes with almost 600k calls trading over the day and 620k puts representing respectively 56% and 47% of total call and put volumes.
Furthermore, looking at options expiring in October 2022, they represent 86% of the total call volume and 83% of the total put volumes.
The market’s focus on short dated options thus remains intact for now.
Over long timeframes, we note that around 18.8k of the Dec’22 4400 calls and 18k of the 30th Nov’22 4500 calls traded.
On the put side, the most active options (outside of very short dated ones) were the 30th Oct’22 3000 puts that printed 11.6k.
This type of options volume confirms a phenomenon we have pointed out in previous market updates which is that this type of market seems to favor short term traders over medium to long term investors. Themes change rapidly and the elevated volatility opens up the possibility of monetizing more frequent short-term dislocations.
This is also why today’s numbers receive a lot of attention.