Trading around in Indices but some stocks moved!
November 8, 2022
Equity indices continued to drift higher yesterday prior to the release of the US election results. The DJIA gained 1.4% despite concerns in crypto markets. European assets also performed nicely with the German DAX gaining 1.15% over the session.
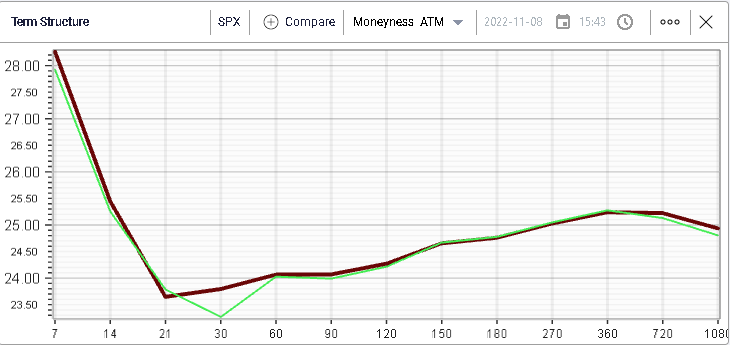
Implied volatilities were largely unchanged as the market awaited the results of the US midterm elections. Below we can see that implied volatility for the SPX remained fairly stable.
Outside of US elections, the market’s attention will most likely be on US CPI due on Thursday where consensus is looking for a 6.5% YoY increase for October following 6.6% in September.
At the sector level, materials were fairly supported gaining 1.7% over the day. Technology stocks also performed well gaining around 1% by the close.
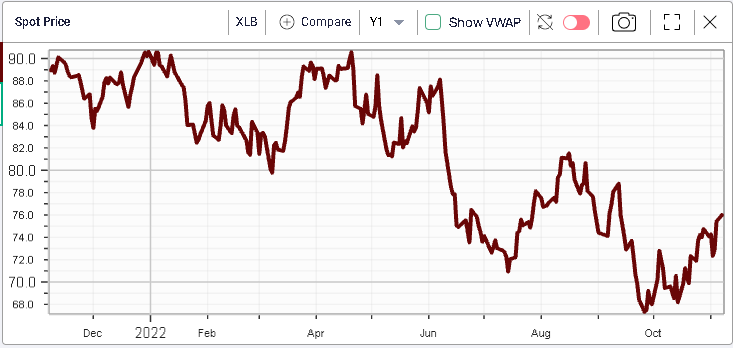
The chart above shows the bounce in materials which have lost around 13.5% YTD following a strong bounce from the October lows.
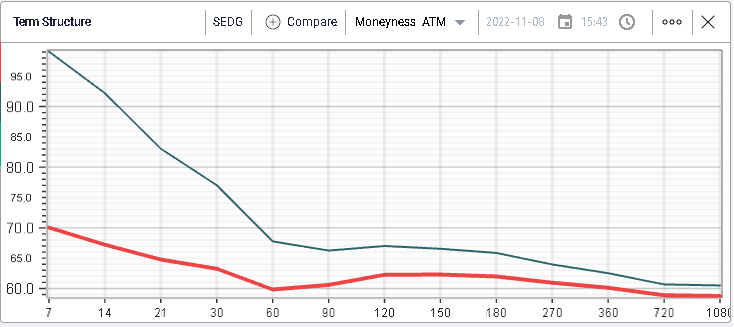
Looking at single stocks, SEDG gained 19% over the session as the company reported a strong set of earnings while guidance also came slightly higher than generally anticipated by market participants according to media reports (Investors.com).
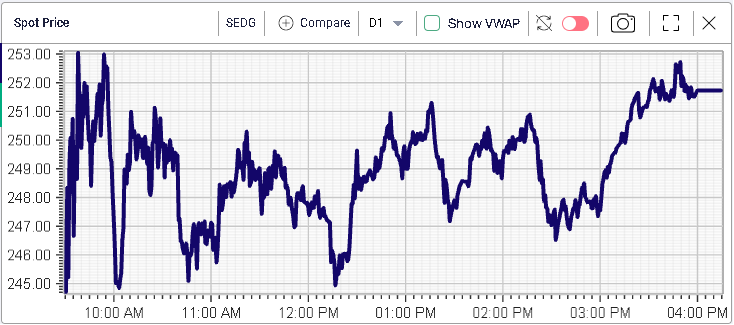
Implied volatility moved significantly lower following the earnings and not only in the front-end but also for longer dated options, a possible sign that this piece of news has been well received by options traders.
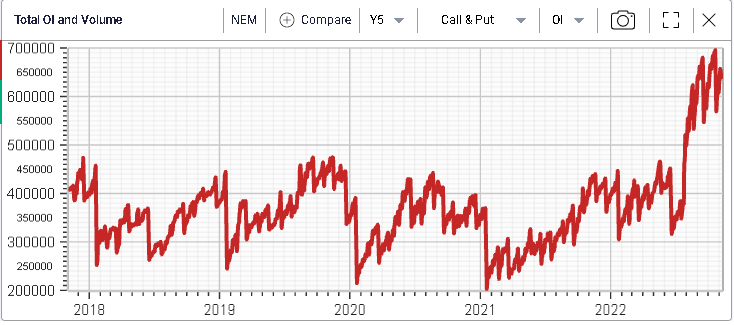
Another name that performed well on Tuesday was NEM with a daily performance of around 5.9%. The stock is still trading 28% lower YTD.
It deserves a mention as it has recently seen a large jump in options open interest which has remained elevated since the Jun’22 expiry.
The spot price has remained fairly correlated with the underlying gold market which has been under pressure in 2022. GLD shown below has lost around 5.3% YTD.

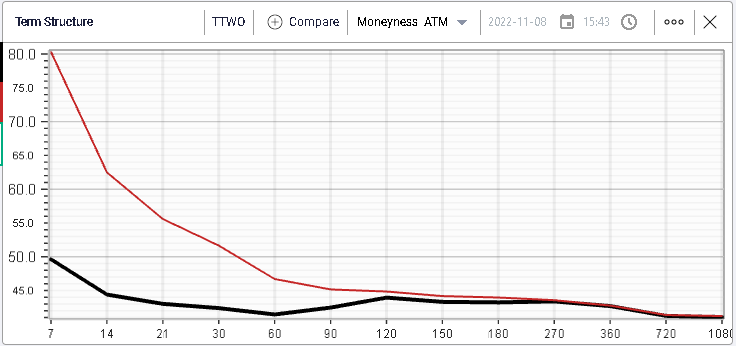
On the downside today, we must highlight the performance of TTWO which dropped almost 14% during the session. According to media reports (Investor Place) the company reported a disappointing set of numbers and a guidance that was badly received by investors.
The stock has lost around 48% YTD. Below we show the intraday price action with an opening print around $91 which was the low point of the day.

Nonetheless, implied volatilities dropped across the curve as earnings have now passed.
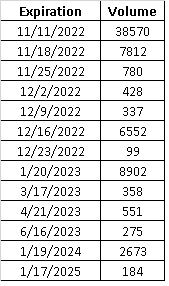
Today also saw a decent pickup in options volumes on the name as shown below with slightly more than 30,000 contracts exchanging hands.
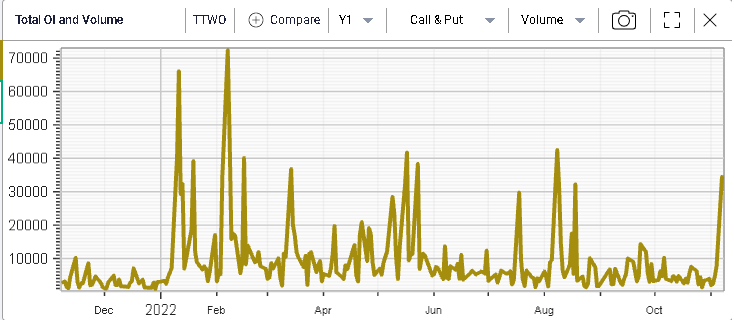
We note the volume on the following options:
- 4,319 of the 11th Nov’22 $100 calls
- 2,251 of the 16th Dec’22 $105 calls
- 1,940 of the 11th Nov’22 $97 calls
- 2,801 of the 11th Nov’22 $95 puts
- 2,478 of the 11th Nov’22 $90 puts
- 2,068 of the 11th Nov’22 $92 puts
In fact, using the data download functionality, we can construct the following table showing the volumes per maturity for TTWO showing how most of the activity was centered in November, either for the 11th or the 18th.
