Treasury Bonds & Dollar Redux
December 5, 2022
Last week the spotlight swung back around to refocus on Treasury Bonds and the U.S. Dollar while the S&P 500 Index stalled at the 200-day Moving Average. Two weeks ago, Treasury Bonds Higher Dollar Lower documented the end of the downtrend in Treasury Bonds. Upside enthusiasm then pushed them into overbought territory.
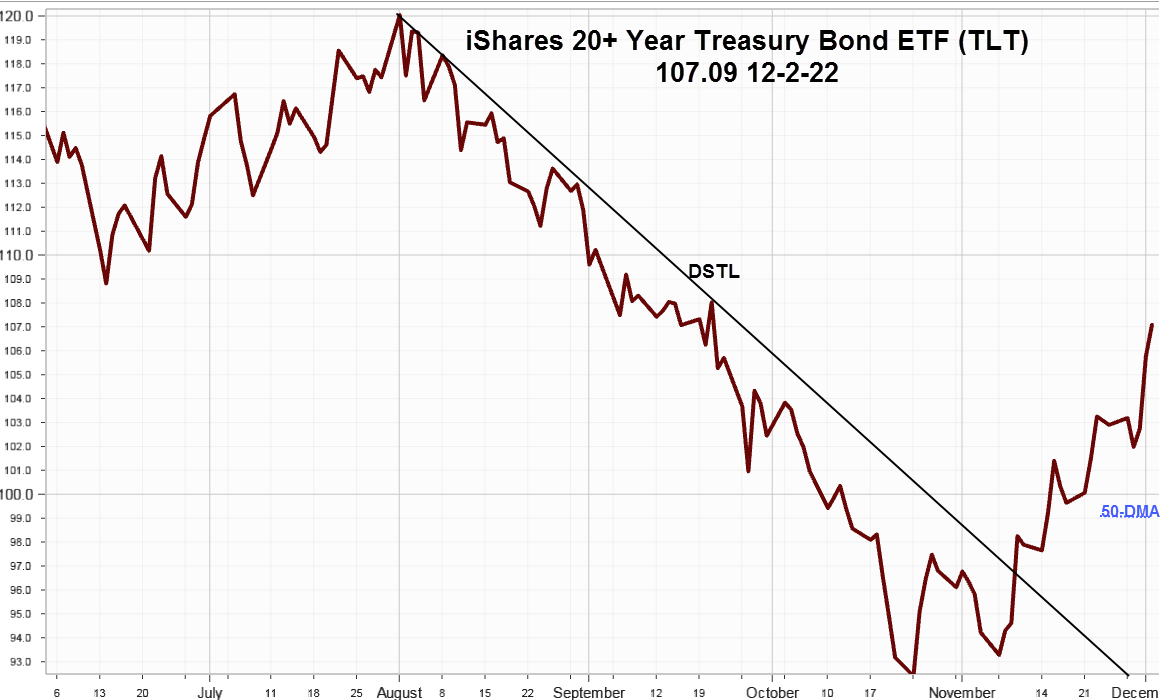
iShares 20+ Treasury Bond ETF (TLT) 107.09 soared 4.43 points or +4.32% last week closing well above the 50-day Moving Average down at 99.11 with 3.27 points of the gain occurring on Thursday after Fed Chairman Jerome Powell spoke on Wednesday about moderating the pace of rate increases thereby confirming expectations for a 50 basis point rise at the December 14 FOMC meeting. The chart below shows the gains made Thursday and Friday on the far right along with the downward sloping trendline (DSTL) from the August 2 high.

Thursday's volume of 53.2 million shares exceeded the November 10 volume on the breakout above the DSTL at 45.5 million. Friday's indicated yield of 2.39% compares to 3.79% for 20-Year Treasury Bonds. A quick look at the chart suggests it's overbought confirmed by the traditional 14-day RSI at 70.88 at the highest level in the last year. Expect a pullback to correct last week's entire advance before the December 14 FOMC meeting.
The 2-Year Treasury declined 14 bps to 4.28%, the 10-Year lower by 17 bps to 3.51%, for a 10-2 inversion of -77 bps. The 20-Year dropped 18 bps to end at 3.79%.
On to the second part of last week's story.
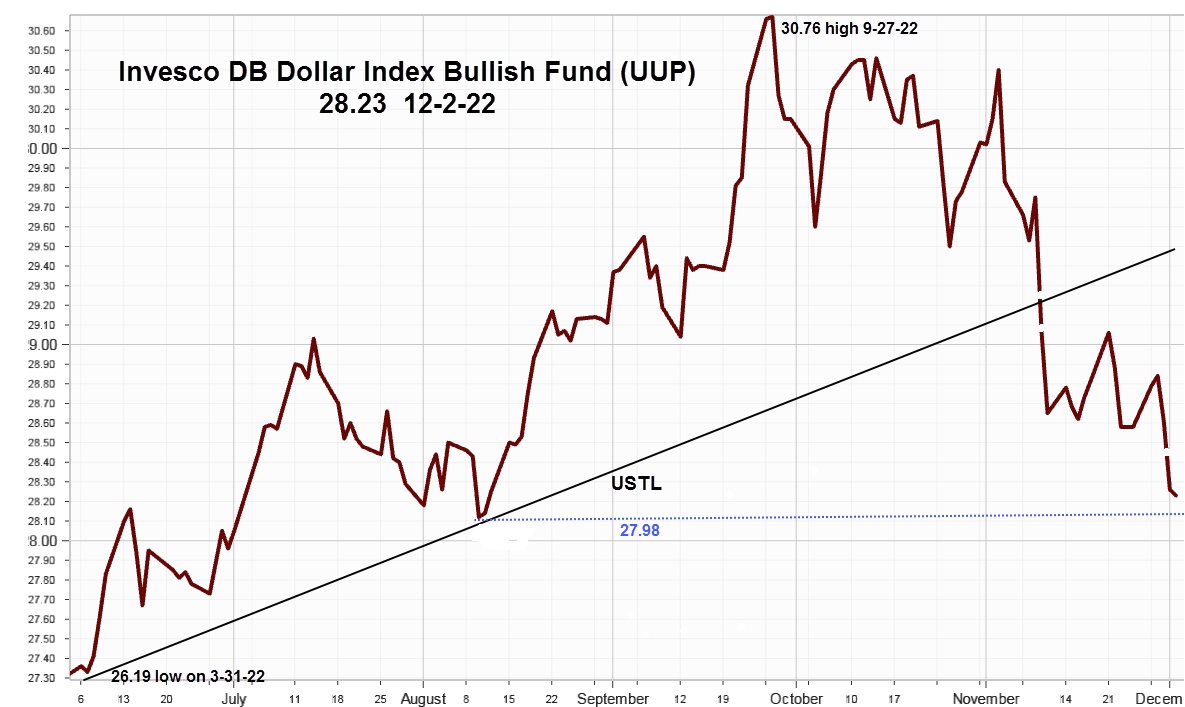
Invesco DB Dollar Index Bullish Fund (UUP) 28.23 lower by .35 points or -1.22% after opening with a gap lower on Thursday. The line on close chart below doesn't show the many gaps it creates, but does show the two important ones as it broke below the upward sloping trendline (USTL). The first on November 10 as it declined .68 points or -2.29% and then next day November 11, as it declined another .42 points or -1.45%. Then finally, last Thursday's opening gap. On Friday, it held support from the 200-day Moving Average at 28.21 and the prior low at 27.98 made on August 11 (blue line) both should offer support. With 14-day RSI in oversold territory at 33.15 odds, favor a rebound.

Summing Up
The market's expectations that the Fed will only increase the Funds rate by another 50 basis points at the FOMC meeting on December 14 was confirmed by Chairman Powell's comments last Wednesday.
With the S&P 500 Index struggling at the 200-day Moving Average trading attention shifted to long Treasury Bonds and the UUP representing the U.S. Dollar Index (DX) pushing bonds into overbought territory and the dollar into oversold territory. Both are likely to reverse direction before the December 14 FOMC meeting.
Apparently, the consensus among bond traders is the Fed will keep raising rates at the short-end of the curve until something breaks such as a recession that will force the Fed to pivot, speculating it will happen by the middle of next year. In the meanwhile, seasonal strength in the last half of the month, after the FOMC meeting, will likely favor the bulls and help the S&P 500 Index overcome resistance at the 200-day Moving Average.