Last Week’s Highlights at IVolLive:
- Don't forget to register for our next live webinar on Tuesday, August 22nd 2023 Webinar Topic: Calculate the Potential Profit and Loss and Become Your Own "Market Maker" with Options Calculators HERE
- Get a free IVolLive Trial HERE.
A Tale of Two Retailers
August 17, 2023

Two earnings releases, two polar opposite reactions:


We've spent a lot of time covering charts over the past few weeks in these pages. And the earnings reactions above are a perfect continuation of that theme...
In the first, we show a three-month chart of Walmart (WMT). The king of retail announced sales and earnings that exceeded Wall Street's estimates. Thus, its share price continues marching higher. But as price has marched higher, so too has Implied Volatility (green line). This means option prices remain expensive.
This means if you plan to buy options, be sure to run the math on your costs basis versus potential profit. If you plan to sell options, inflated premiums will be helpful
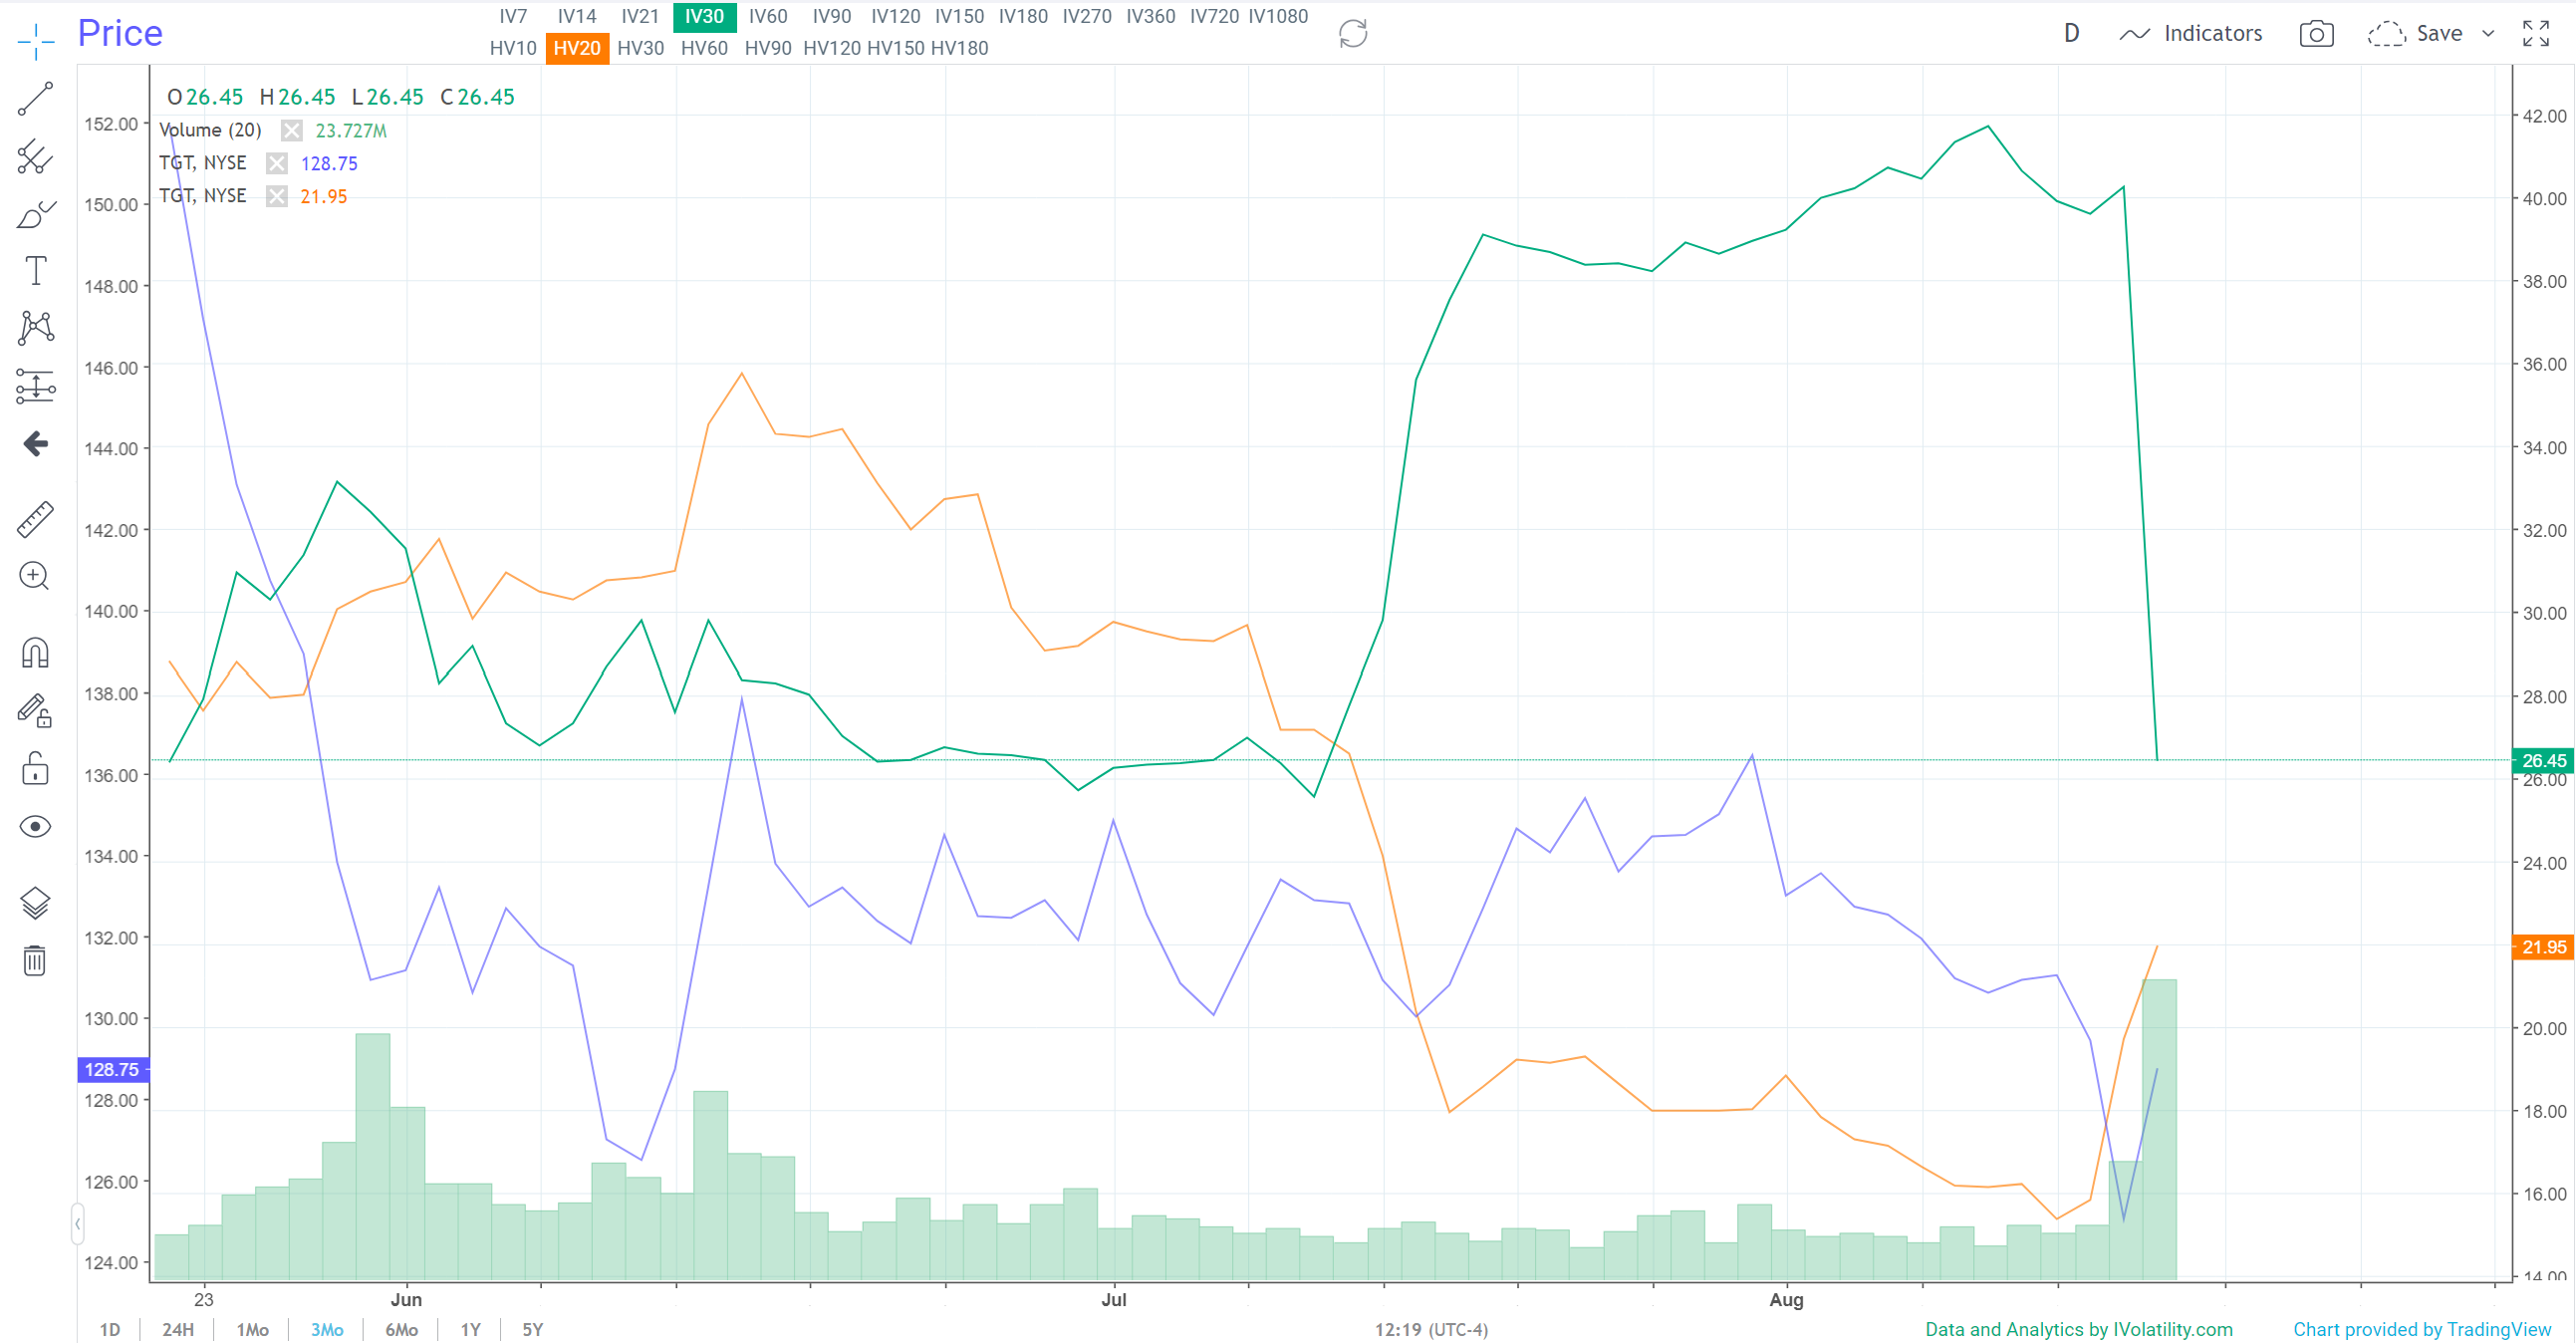
Meanwhile, in the second chart, we see a three-month chart of Target (TGT). As you can see, Target reported earnings this week that Wall Street abhorred. Sending shares (the blue line) lower as the IV line (green line) continued rising.
This is a great teachable moment as well. Take another look at the green IV line in the target chart. There's a massive gap between the blue line (share price) and the green line (IV). This shows that the market was expecting a wide swing leading up to earnings. As usual, IV was not wrong.
In this case, the move turned out to be a move lower. But prior to the earnings release, we could have designed a Straddle or Strange trade using the IVolLive Real Time Spread Scanner.
After inserting a few inputs, this powerful tool automatically scans and runs the numbers for spread trades on targets, pun intended.
With a Spread and a Strangle, your goal is to cash in on a large move in either direction. The main risk is that the stock goes nowhere.
In Target's case, its steady rise and divergence in IV versus the underlying stock price was our clue to explore a potential spread trade.
How to Play It
With earnings season in full swing, analyze some of your favorite stocks using the same methodology. Pull up the stock's chart in IVolLive, then run the stock through the RT Spread Scanner.
ow, you ask?
Well, fortunately we've recently edited and posted our demo videos on these topics here:
Charting and Technical Analysis Part I
Charting and Technical Analysis Part II
Charting and Technical Analysis Part III
Real Time Spread Scanner Part I
Real Time Spread Scanner Part II
Real Time Spread Scanner Part III
Previous issues are located under the News tab on our website.