Tug of War Between Macro Inputs
By Fauzia Timberlake,
personal coach for trading options
June 15, 2026
Market Roundup & The Week in Review
Following the violent, macro-driven growth shakeout that shattered early June's goldilocks narrative, the trading week ending Friday, June 12th, 2026, was defined by an apparent stabilization process. While the initial shock of the previous Friday's blowout non-farm payroll data had abruptly erased hopes for near-term rate cuts and reignited fears of a "higher-for-longer" path from the Federal Reserve, the market spent this past week proving it could find its footing under a more restrictive macro regime.
The bond market remained the primary anchor for equity valuations. Interest rate futures markets continued to price out any near-term monetary easing, accepting the reality that a highly resilient labor market grants the Fed maximum flexibility to keep policy restrictive. Yet, instead of triggering a second wave of systemic liquidations, the stabilization of yields provided a baseline for equity buyers to re-emerge.
The tech-heavy benchmarks staged a calculated recovery. After the PHLX Semiconductor Index (SOX) suffered an 8.5% single-day collapse, buyers stepped back into the semiconductor and AI infrastructure trades, treating the multi-trillion-dollar valuation flush as a temporary clearing event rather than a structural top. However, the bounce lacked the aggressive, uncritical momentum seen in earlier months, signaling a more disciplined approach to mega-cap growth multiples.
Underneath the hood, the highly calculated internal sector rotation continued to mature. Institutional capital appears to be split: keeping a foot in core tech leaders while actively feeding cash-flowing value, energy, and defensive pockets.
Outside of equities, risk assets mirror this broad stabilization. After breaking beneath the critical 60,000 psychological floor during the payrolls shock, the cryptocurrency complex steadied, attempting to carve out a defensive base as the market adapts to the reality of higher risk-free yields.
By Friday's closing bell on June 12th, the broad-market indices successfully arrested the downward technical breakdown, logging a positive week and proving that while the market structure remains fractured by macro realities, it is resilient enough to handle them.
Strategy Corner
Based on this week's market movements, here are some trading ideas and option strategies for the readers' consideration. The positions can be scaled bigger (or smaller) to suit individual account size.
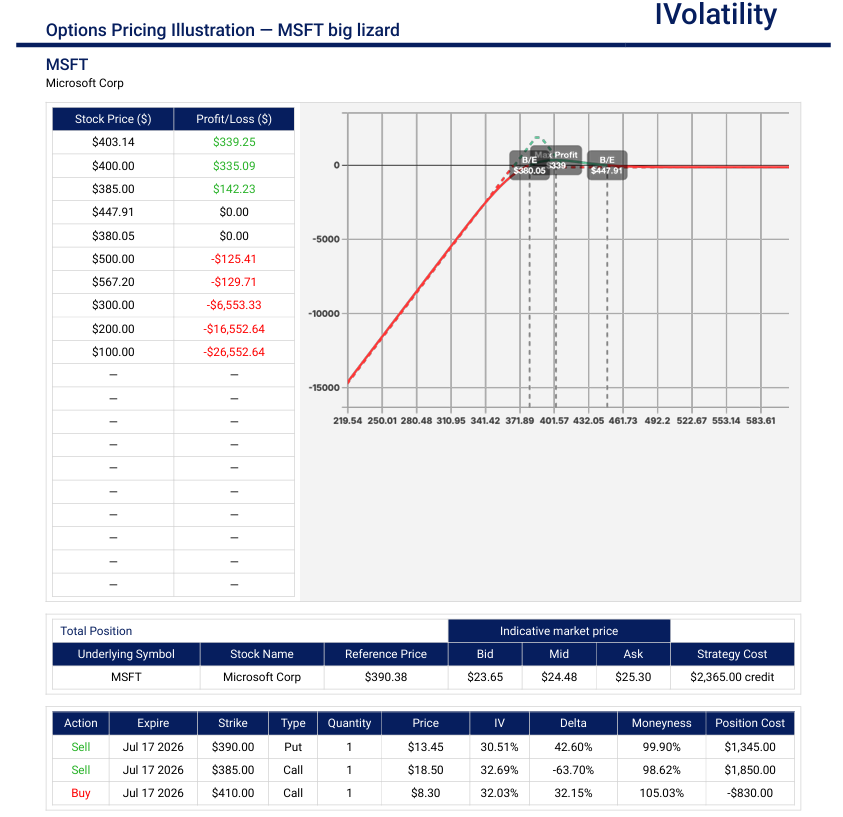
MSFT (closed at 390.69 on Friday, June 12th)
Microsoft has undergone a healthy, high-volume consolidation block over the last two weeks. This price action could be interpreted to provide a powerful structural floor around the $390 mark. MSFT may be structurally positioned for an accumulation phase.
Outlook: bullish
Strategy: Big Lizard
In the July monthly expiration, sell the 390 straddle and buy the 410call
Premium collected: about $2365/contract
Net Position Delta around +27
No risk to the upside (because the $20 wide call spread is covered by the credit received); downside BE is around 360 (19delta)
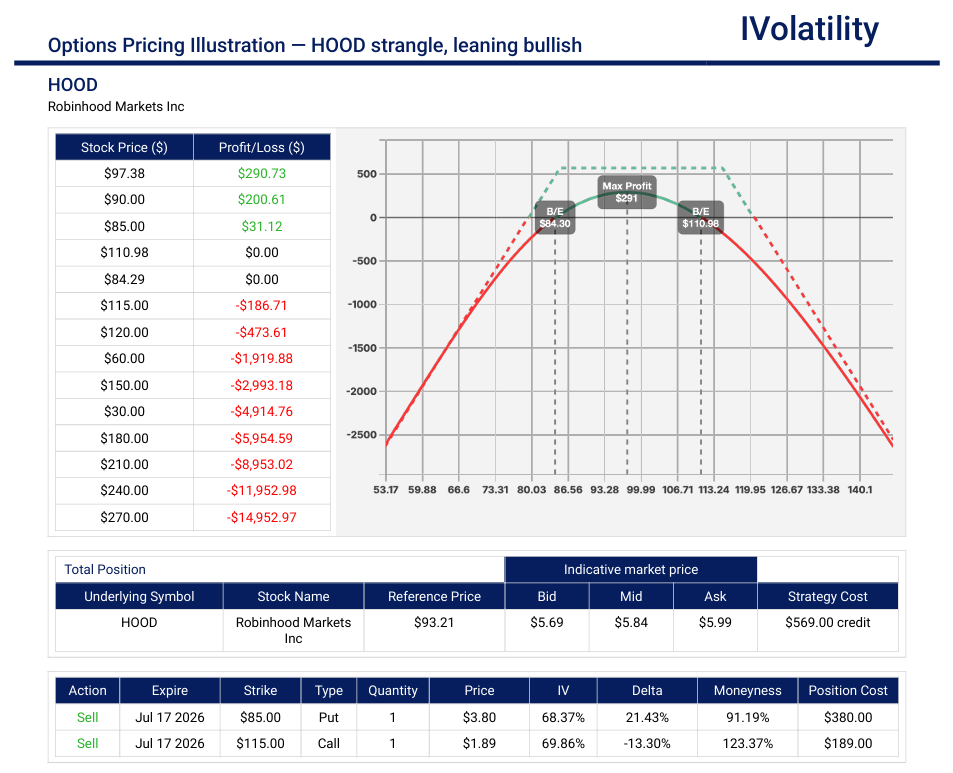
HOOD (closed at 93.16 on Friday, June 12th)
Technically, HOOD appears to have put in a definitive, higher structural low near the $82–$85 zone. Friday's strong institutional volume and a break past short-term resistance could be a signal that the distribution phase stemming from early-year crypto trading volatility has cleanly exhausted itself.
With high retail engagement persisting in traditional equities and options volumes hitting steady milestones, HOOD's non-crypto revenue lines (such as Gold subscriptions and net interest margin on cash balances) provide a highly resilient fundamental backstop.
Outlook: neutral, leaning bullish
Strategy: Strangle
Sell the July 85/115 strangle
Premium collected: about $559/contract
Net position delta about +11
Breakevens around 80 and 120
Movement of the Major Market Indices:
| INDEX | UP | DOWN |
| SPY | -0.22% | |
| QQQ | 0.52% | |
| IWM | 2.61% | |
| DIA | 0.45% | |
| GLD | -2.45% | |
| BTC/USD | 0.37% | |
| 10-year yield | -0.039% | |
| Crude Oil | -4.68% | |
| VIX | -17.58% |
The primary theme for the trading week ending June 12th, 2026, was a broad and calculated stabilization as capital flows adjusted to the prior week's massive macro shock. A clear dispersion among major indexes, asset classes, and risk categories was apparent.
The notable takeaway is that while the growth-centric Nasdaq 100 (QQQ) and broad S&P 500 (SPY) managed to claw back a portion of their previous losses, traditional value sectors and small-caps showed localized pockets of relative strength. This bifurcation reflects an ongoing structural repricing where equity investors are gingerly buying the dips in premium secular growth names while continuing to tilt toward cash-flowing, defensive value plays.
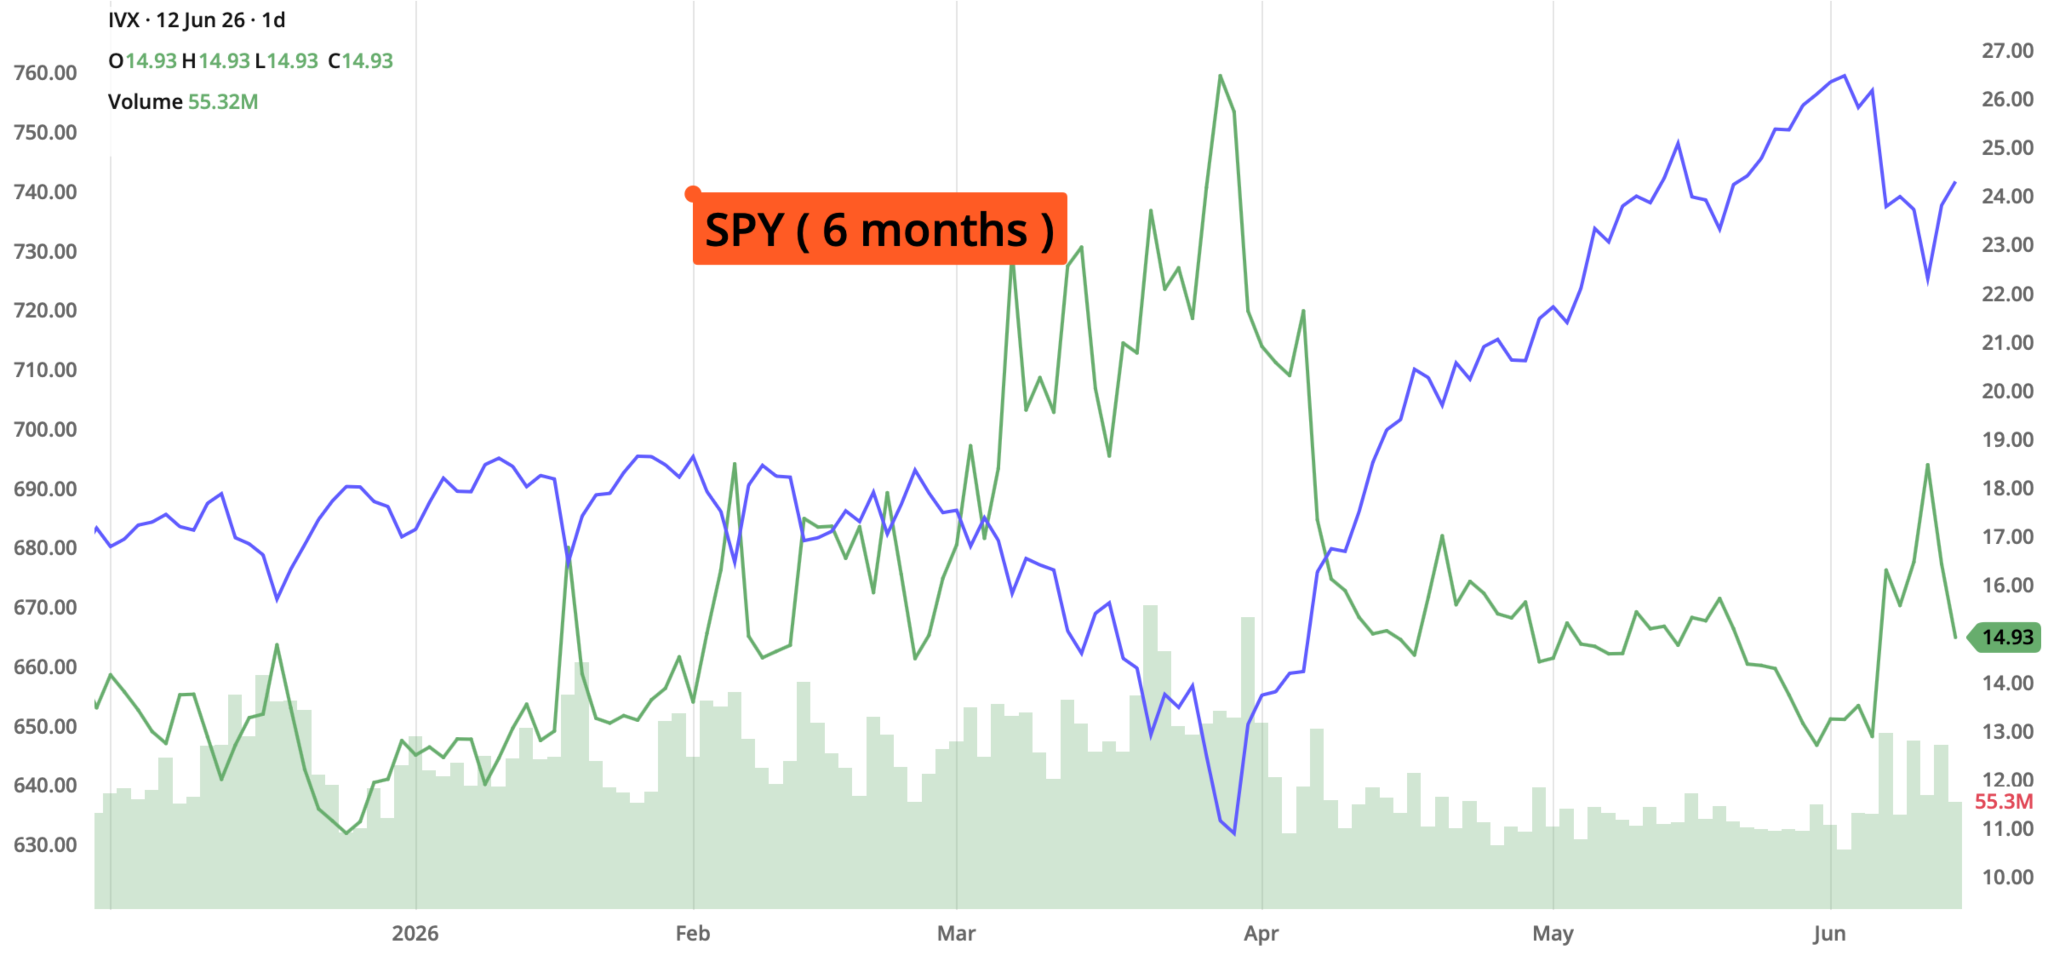
The striking feature of the week was the orderly contraction in volatility and fixed-income yields. After spiking violently above the 40% psychological barrier during the payrolls panic, the CBOE Volatility Index (VIX) collapsed back down toward the 17.68 level by Friday's close, signaling a sharp reduction in short-term market fear. Simultaneously, the benchmark 10-year Treasury yield drifted down from its recent 4.55% high to settle near 4.48%. This parallel easing of both equity and bond market volatility allowed the broader indices to arrest their downward technical breakdowns and establish a tentative baseline.
In commodities and alternative assets, the price action remained highly idiosyncratic. Crude oil prices slid lower by the end of the week, with West Texas Intermediate settling near 84.88 dollars per barrel as market participants balanced summer demand projections against a potential easing of geopolitical friction. Meanwhile, the cryptocurrency complex tried to forge a structural base; after breaking beneath its 60,000 floor in the prior session, Bitcoin futures spent the week carving out a tight, defensive range to stabilize the broad digital asset complex.
Movement of the Major Market Sectors:
| SECTOR | UP | DOWN |
| TECH (XLK) | -0.23% | |
| FINANCIALS (XL) | 2.11% | |
| INDUSTRIALS (XLI) | 0.61% | |
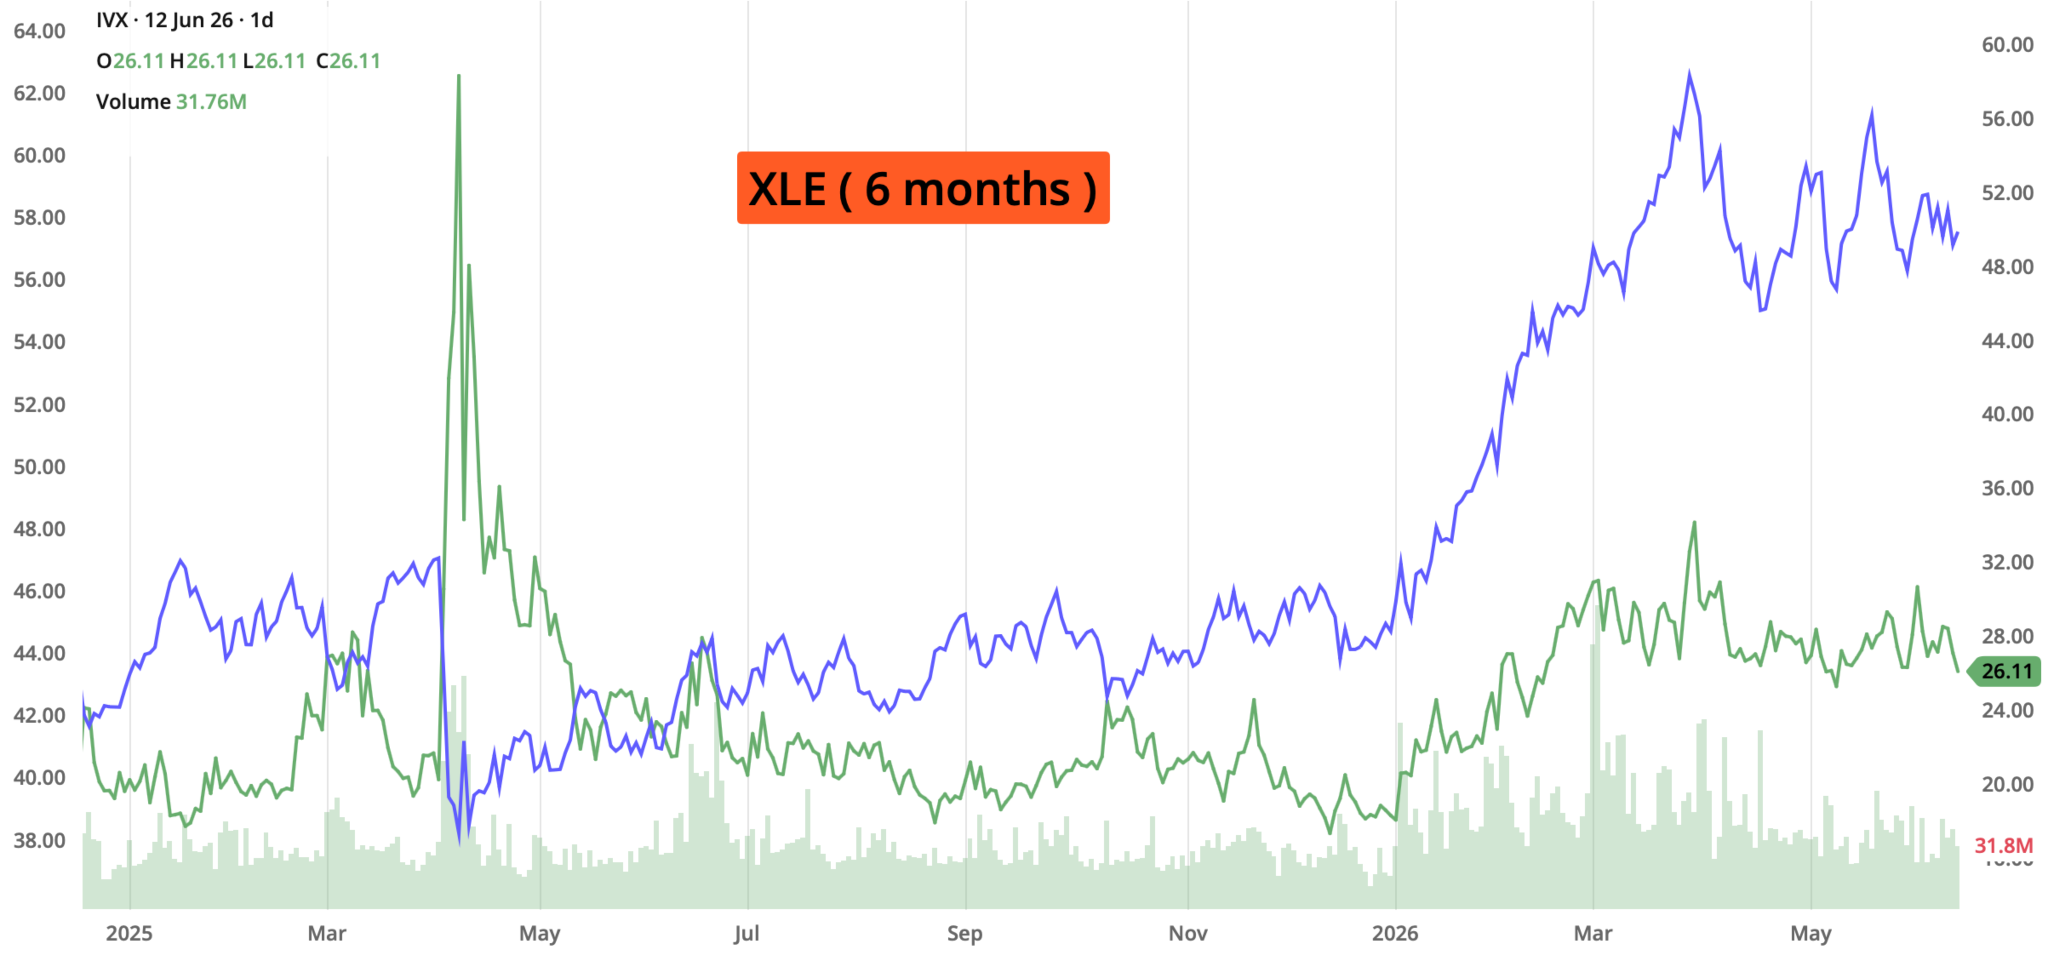
| ENERGY XLE | -3.37% | |
| HEALTHCARE (XLV) | 0.76% | |
| UTILITIES (XLU) | 2.28% | |
| MATERIALS (XLB) | 1.60% | |
| REAL ESTATE (XLRE) | 1.50% | |
| CONSUMER STAPLES (XLP) | 3.44% | |
| CONSUMER DISCRETIONARY (XLY) | 1.59% |
The defensive triage and calculated sector rotations that characterized the early June jobs shock shifted into a sophisticated stabilization process during the trading week ending June 12th, 2026. Rather than a continuation of the blind, multi-asset growth liquidation, institutional flows this week reflected an orderly multi-speed market. Capital did not completely abandon mega-cap growth tech, but it strictly enforced valuation discipline while continuing to feed inflation-resilient and value-oriented segments.
The primary divergence across the key sectors revealed a market appearing to aggressively balancing strong underlying domestic growth against a structurally higher interest rate path. Performance across the major sector trackers followed a distinct pattern of stabilization, short-covering, and selective accumulation.
Notable gainers for the week of June 8th – June 12th
As equity benchmarks successfully arrested their downward technical breakdowns and appeared to transition into an orderly consolidation, several prominent large-cap entities emerged as clear leaders. The dominant theme among the week's notable gainers was a powerful post-flush recovery in semiconductor and capital equipment providers, alongside robust event-driven momentum in select tech and infrastructure plays.
The primary gainers reflected intense institutional dip-buying and structural index updates:
KLA CORPORATION (KLAC, +31.90%) The wide-moat semiconductor equipment manufacturer topped the large-cap leaderboard. Capital aggressively flooded back into the chip-processing and inspection space as institutional desks recognized that the previous week's systematic valuation flush did not alter the long-term capital expenditure runway for advanced AI hardware nodes.
INTEL CORPORATION (INTC, +25.86%) Intel experienced a massive short-covering and accumulation rally, serving as a primary focal point for opportunistic tech buyers. The stock found absolute structural support early in the week as broader market participants rebalanced tech portfolios, looking for value-driven catch-up plays within the stabilizing semiconductor ecosystem.
APPLIED MATERIALS (AMAT, +25.18%) The semiconductor manufacturing equipment giant advanced sharply alongside its peers. The price action was driven by strong underlying factory tool demand and structural short-covering, proving that Tier-1 institutional desks remain highly committed to funding core chip infrastructure builders during broader market consolidations.
LAM RESEARCH CORPORATION (LRCX, +20.93%) Lam Research completed the major semiconductor sweep, capitalizing on a sharp reversal in wafer-fabrication spending sentiment. Easing fixed-income volatility and slightly cooler Producer Price Index data provided a constructive macro tailwind for high-multiple capital equipment names to recapture lost technical ground.
Casey's General Stores (CASY, +20.33%) Shot higher following a blockbuster quarterly earnings report featuring massive margin expansion on inside-store sales, which triggered a wave of defensive safety inflows into the Consumer Staples sector.
SpaceX (SPCX, +19.22%) Staged a historic public market debut on Friday. Originally priced at $135, it opened on the Nasdaq at $150 and closed its first official session at $160.95, locking in a record-breaking valuation.
Notable losers for the week of June 8th – June 12th
While the broader equity indices engineered a stabilizing bounce, the internal market mechanics exposed significant undercurrents of stress. The primary damage concentrated in enterprise software, cybersecurity, and cloud platforms. As institutional desks rotated capital back into semiconductor equipment and traditional value plays, high-multiple software architectures experienced a sharp, delayed liquidation, as investors actively de-risked companies with premium valuations and exposed margins.
The notable losers from market open on June 8th to market close on June 12th revealed concentrated distribution across enterprise growth and speculative tech structures:
CIENA CORPORATION (CIEN, -18.10%) The networking systems and software provider suffered heavy selling pressure, leading large-cap decliners. Institutional flows turned sharply negative as participants grew highly sensitive to corporate capital expenditure budgets, showing a distinct preference for direct hardware nodes over cloud and network optimization layers.
DATADOG (DDOG, -16.50%) The prominent cloud monitoring and security platform experienced institutional distribution. The stock faced major multi-variable headwinds as desks reduced exposure to high-beta, long-duration cloud multiples, prioritizing near-term balance-sheet cash flows over distant growth targets.
THE TRADE DESK (TTD, -16.30%) The digital advertising tech leader fell victim to a sharp structural de-risking move. Even with resilient macro spending patterns, investors aggressively compressed premium multiples across consumer-sensitive digital ad spaces, forcing a rapid technical breakdown through recent support zones.
SERVICENOW (NOW, -16.00%) The enterprise software giant was hit by systematic institutional rotation. Despite strong historical execution, its high-multiple growth premium acted as a magnet for sellers under a higher-for-longer Fed rate regime, making it a primary source of capital to fund chip equipment dip-buying.
CROWDSTRIKE HOLDINGS (CRWD, -15.80%) The premier cybersecurity operator rounded out the major software liquidation sweep. Elevated corporate evaluations came under intense scrutiny, proving that even mission-critical tech sectors face steep multiple compression when institutional capital rapidly shifts toward deep value and core hardware structures.
Review selected market indices below:
Daily Notable Market Action
Markets and News for Monday, June 8th
Wall Street delivered a mixed and highly volatile performance on Monday as a powerful afternoon rebound in technology and artificial intelligence-linked semiconductor stocks managed to offset overnight global market anxieties. At the final bell, the tech-heavy Nasdaq composite and the benchmark S&P 500 closed firmly in positive territory, while cyclical and industrial shares dragged the blue-chip Dow Jones Industrial Average slightly into the red.
The primary catalyst behind Monday's domestic trading action was a strong wave of opportunistic institutional dip-buying targeting computer chip and hardware manufacturers, which had plummeted during the previous Friday's severe macro-driven growth flush.
Market breadth was somewhat narrow, however, with leadership concentrated heavily in technology, while traditional cyclical and defensive sectors faced mild distribution as institutional desks rebalanced portfolios to fund the high-conviction tech dip-buying.
Outside of large-cap equities, small-cap stocks showed exceptional relative strength. The Russell 2000 index outpaced the broader market by gaining 0.8 percent to close at 2,855.42, benefiting from localized short-covering and an intraday easing of short-term volatility.
Treasury prices fell and yields remained elevated as bond markets continued to digest the structural implications of the previous week's blowout nonfarm payrolls report.
In commodities, crude oil and gold moved into a calculated holding pattern. While localized geopolitical frictions and supply-chain anxieties kept a structural floor under energy markets, West Texas Intermediate crude futures settled near 91.69 dollars per barrel. Concurrently, gold futures faced modest multiple compression as elevated risk-free Treasury yields and a firmer U.S. dollar reduced the near-term appeal of traditional non-yielding safe-haven assets, prompting investors to favor liquid equities instead.
- S&P 500: 7,405.73 (+0.30%)
- Nasdaq Composite: 25,929.66 (+0.86%)
Markets and News for Tuesday, June 9th
Wall Street experienced severe intraday volatility on Tuesday as an early, optimistic technology rally collapsed into a sharp afternoon sell-off. Major equity benchmarks spent the first half of the session pushing firmly into positive territory, only to careen wildly into the red by the closing bell as intense distribution slammed high-flying artificial intelligence and semiconductor structures.
The dominant theme of the session was a bruising reversal in the primary building blocks of the AI hardware boom. After opening the day with robust gains, marquee chipmakers and equipment providers fell victim to sudden and aggressive institutional profit-taking.
While the high-beta growth space dragged the broader market lower, internal breadth metrics revealed pockets of underlying stability. The blue-chip Dow Jones Industrial Average managed to buck the broader negative trend, edging higher by 0.2 percent as defensive, cash-flowing value sectors captured a meaningful portion of the capital rotating out of premium tech.
Treasury prices rose slightly and yields eased in the fixed-income market. The downward drift in yields was largely driven by a cooling of short-term inflation fears as commodity markets adjusted to a sharp retreat in energy prices.
In commodities, crude oil provided the biggest relief of the day. The pullback developed as energy traders monitored ongoing efforts to stabilize commercial maritime traffic and restore oil flows through the Strait of Hormuz, easing immediate supply-chain anxieties.
- S&P 500: 7,386.65 (-0.30%)
- Nasdaq Composite: 25,678.82 (-1.00%)
Markets and News for Wednesday, June 10th
A renewed and heavy wave of selling across artificial intelligence and semiconductor standard-bearers knocked Wall Street sharply lower. The major equity benchmarks suffered a severe afternoon breakdown, erasing recent stabilizing gains and dragging the broad market back to levels not seen since early May. The intense distribution was further amplified by localized capital-raising activities and persistent geopolitical overhangs.
The primary epicenter of Wednesday's market decline was a steep liquidation across former high-flying technology leaders. Market participants aggressively re-evaluated premium growth evaluations, prompting a sharp rotation out of long-duration tech multiples. The selling pressure quickly spread across the entire AI hardware complex to NVDA, AVGO and MU. The tech-led downturn completely overshadowed a highly anticipated and ultimately inline macroeconomic data release.
In the morning, the Bureau of Labor Statistics reported that the Consumer Price Index for May increased 0.5 percent month-over-month, bringing the annual inflation rate to a three-year high of 4.2 percent. While the headline figures matched consensus economic projections exactly, the absolute level reinforces a sticky inflationary environment.
Fixed-income participants reacted with a modest relief rally, allowing the benchmark 10-year Treasury yield to slip slightly to 4.52 percent, though the macro data did little to alter expectations that the Federal Reserve will maintain an elevated policy baseline at its upcoming meeting.
Geopolitical tensions and renewed administrative rhetoric between Washington and Tehran kept supply-chain anxieties elevated, pushing Brent crude futures up 1.3 percent to settle near 92.60 dollars per barrel.
The persistent commodity strength added to underlying corporate margin concerns, sending the CBOE Volatility Index spiking above the 20 threshold to hit its highest level since early April.
- S&P 500: 7,266.99 (-1.64%)
- Nasdaq Composite: 25,169.50 (-1.98%)
Markets and News for Thursday, June 11th
Wall Street staged an explosive, broad-based rally on Thursday, delivering its best single-day performance in two months. Major equity benchmarks completely reversed early pre-market declines and veered sharply higher during midday trading, snapping a consecutive two-day losing streak and reclaiming critical technical ground.
The primary catalyst for the massive intraday trend reversal was a sudden and significant de-escalation in Middle East geopolitical tensions. Stocks immediately leaped following official communications that diplomatic discussions regarding the ongoing conflict had advanced to the highest levels, raising strong institutional hopes for a near-term agreement to stabilize regional tensions and reopen shipping lanes.
Commodity markets reacted instantly to the news, with both the international benchmark Brent crude and West Texas Intermediate crude plunging sizeably.
The sharp retreat in energy costs provided an immediate, compounding tailwind for the equity and bond markets by alleviating worst-case corporate margin and inflation scenarios. This relief completely overshadowed a hot morning macroeconomic print, where the Producer Price Index for May revealed that wholesale inflation surged.
In fixed income, Treasury prices surged and yields eased sharply as the collapsing oil price mitigated the hot wholesale data.
The cooling of interest rate and energy pressures sparked intense institutional dip-buying across highly interest-rate-sensitive and capital-intensive segments. Small-cap stocks led the entire market layout. Concurrently, the semiconductor equipment and hardware architecture complex completed a powerful sweep to power the large-cap indices higher.
The broader market largely looked past localized software churn to focus on the macroeconomic clearing event.
- S&P 500: 7,394.30 (+1.76%)
- Nasdaq Composite: 25,809.66 (+2.54%)
Markets and News for Friday, June 12th
Wall Street closed out a highly volatile weekly sequence on a positive note, with major equity benchmarks logging steady gains on Friday. Market sentiment was powered by a dual catalyst: a continuing drop in global energy costs and intense investor enthusiasm surrounding a historic corporate public debut. By the closing bell, the broad-market S&P 500 secured its tenth winning week in the last eleven, illustrating a resilient underlying equity framework despite recent interest rate anxieties.
The most anticipated story of the session developed outside the standard large-cap constituents, as Elon Musk's rocket and satellite communication firm, SpaceX, officially debuted on the public markets under the ticker symbol SPCX. Priced at 135 dollars, the stock soared over 19% percent in its first day of active trading. The explosive debut propelled the company's total market valuation past the 2.1 trillion-dollar threshold, absorbing massive capital flows and proving that institutional appetite for advanced artificial intelligence and technological infrastructure remains exceptionally robust.
While the new listing captured the spotlight, traditional sectors received a significant fundamental boost from an ongoing retreat in global commodity markets. The sustained drop in energy prices followed public confirmations that geopolitical discussions between Washington and Tehran were progressing rapidly toward an interim peace framework to lift oil sanctions and permanently reopen the Strait of Hormuz. The cooling of energy-driven inflation fears prompted solid accumulation across cyclical, industrial, and traditional blue-chip value sectors, steering the Dow Jones Industrial Average to a leading 353-point advance.
The cooling oil market also allowed fixed-income participants to absorb a slightly better-than-expected consumer sentiment data release without triggering panic. In the bond market, Treasury prices eased slightly.
Within the large-cap technology complex, price action was highly mixed following the intense swings observed earlier in the week. Micron Technology dipped 1.4 percent, functioning as one of the primary negative weights on the S&P 500 as short-term traders took profits from the prior session's chip hardware bounce. Conversely, enterprise software and infrastructure provider CoreWeave jumped 5 percent following an official update that its shares will be added to the benchmark Nasdaq-100 index later this month.
- S&P 500: 7,431.46 (+0.50%)
- Nasdaq Composite: 25,888.84 (+0.30%)
Notable Earnings (June 15th – 19th)
While the primary market catalysts next week are structural macroeconomic releases—most notably the upcoming monthly retail sales data—the corporate earnings calendar features a few highly selective, large-cap reports capable of driving significant single-stock implied volatility. Large-cap consulting, enterprise strategy, and massive grocery retail infrastructure will take center stage mid-week, acting as an important fundamental health check for corporate technology budgets and core consumer spending durability under persistent monetary constraints. Additionally, key reports in luxury design and casual dining will provide direct insights into the structural resilience of discretionary trends.
The actual earnings date may vary, so traders should confirm with their brokers. If a trader wishes to open a position to participate in earnings announcements, it is important to check whether the earnings are released BEFORE the markets open or AFTER the markets close on the date of earnings.
Monday, June 15th: LEN / PLAY / HITI
Tuesday, June 16th: LZB / WLY
Wednesday, June 17th: JBL / SWBI / SB
Thursday, June 18th: ACN / KR / DRI / KMX
Friday, June 19th: Market holiday
Economic Calendar (June 15th – 19th)
Following a turbulent sequence of inflation prints and intense sector rotations, the macroeconomic spotlight shifts directly onto global monetary policy and the health of the domestic consumer. Volatility expectations remain elevated as market participants brace for a monumental central bank layout, alongside critical indicators mapping real-world retail activity under a persistent higher-for-longer rate environment.
The focal point of the week will be Wednesday's Federal Reserve interest rate decision. This session marks the highly anticipated debut policy meeting for the newly appointed Fed Chair, Kevin Warsh. While the central bank is widely expected to keep the benchmark federal funds rate steady, option desks may be intensely analyzing the updated Summary of Economic Projections (SEP) and the Chair's freshman press conference for definitive signals on whether officials are opening the door to a rate hike later this year following the recent energy-price shock.
Internationally, traders face a crosscurrent of global central bank updates, with interest rate decisions scheduled out of the United Kingdom, Japan, Australia, Switzerland, and Brazil, underscoring a stark divergence in global monetary regimes.
- Monday, June 15 NY Empire State Manufacturing Index (June):
Provides an early look at regional manufacturing health, factory orders, and employment conditions, offering a fresh baseline for domestic growth metrics. - Tuesday, June 16 U.S. Housing Starts and Building Permits (May):
Forecasted to show a modest contraction in residential construction volume, serving as an important yardstick for real estate development liquidity amidst elevated mortgage rates. - Tuesday, June 16 U.S. Housing Starts and Building Permits (June):
NAHB Housing Market Index (June): Measures homebuilder confidence and buyer traffic trends within the single-family housing ecosystem. - Wednesday, June 17 U.S. Retail Sales (May):
The premier consumer spending indicator, accounting for roughly 70% of domestic GDP. - Wednesday, June 17 FOMC Interest Rate Decision and Policy Statement:
The Federal Reserve policy announcement, accompanied by the updated economic dot plot projections and Chair Kevin Warsh's premier press briefing. - Thursday, June 18 Weekly Initial Jobless Claims:
The standard weekly labor liquidity check to evaluate whether underlying corporate layoff trends remain suppressed. - Thursday, June 18 Weekly Initial Jobless Claims:
Philadelphia Fed Manufacturing Index (June): A key regional manufacturing gauge tracking business conditions, price paid metrics, and capital expenditures. - Friday, June 19:
U.S. Financial Markets Closed in observance of the federal Juneteenth National Independence Day holiday.
Blue Sky Horizons
The Dawn of Physical AI
Building directly on our previous discussion regarding the migration of intelligence from centralized data centers to localized edge endpoints, the mid-June market layout has highlighted the next logical phase of this structural transformation: the undeniable arrival of Physical AI.
For the first half of 2026, the technology landscape focused heavily on shrinking large software models into nimble Small Language Models (SLMs) to manage local processing and reduce exploding cloud API costs. Now, the macro structural narrative is shifting from digital screen-based intelligence to embodied agency—deploying these highly optimized, autonomous models directly into real-world machinery, robotic automation, and advanced aerospace architectures.
This structural evolution was punctuated by the record-breaking public debut of SpaceX (SPCX). Beyond the sheer scale of the listing, institutional desks viewed the public pricing as a primary validation of physical, decentralized infrastructure. The intense capital accumulation highlights a profound reality for self-directed investors: the high-conviction money is rapidly expanding past standard software platforms and flowing directly into companies integrating local neural networks with heavy physical engineering.
The operational transition from digital inference to physical agency is accelerating due to a critical constraint that came to the forefront of industry discussions this week.
Centralized cloud expansion is hitting a hard physical barrier across the domestic grid. The electricity infrastructure required to feed rows of power-hungry graphics processors is not scaling at the pace of compute demand, with commercial gas turbines already booked out through 2028. As the energy supply constraints intensify, modern enterprises are structurally forced to build resilience through localized edge deployment rather than relying solely on monolithic, centralized warehouses of data.
Optimizing smaller models via quantization and compiler tuning is no longer just a method to save on network latency; it has become an operational necessity to bypass the power-grid bottleneck entirely.
When autonomous systems must operate in volatile, real-world environments—whether navigating commercial logistics, executing real-time industrial computer vision tracking, or maintaining absolute context during deep space communications—waiting for a remote server round-trip introduces unacceptable failure modes. The current wave of capital expenditure proves that the future of competitive advantage belongs to software architectures designed for the energy and deployment realities of a highly distributed, edge-first world.
Physical AI is moving off screens and directly into the global industrial framework, rewriting the rules of technology infrastructure and long-term capital allocation.
Thank you for reading. Until next week's close,
Safe Trading!
Fauzia Timberlake
About the Author: Fauzia Timberlake is a professional options coach and financial strategist specializing in risk management and portfolio architecture for self-directed investors. She is Founder and Managing Partner of Option Engines.
Questions / Comments
We're here to serve IVolatility users and we welcome your questions or feedback about the option strategies discussed in this newsletter. If there is something you would like us to consider and/or analyze, we're always open to your suggestions. Use support@ivolatility.com.
Previous issues are located under the Trade Ideas tab on our website.