Earnings Contamination of IV Breakout / Collapse Signals
How Much of an "IV Signal" is Really Just an Earnings Crush? S&P 500, 2021–2026
Summary
After five parts of this series we have a working hypothesis about where IV signals work: long-dated breakouts (IVX120d, two-week window, ≥50%) predict +4.72% forward 20-day returns (Part V). And we know why it should work — a sustained spike in long-dated implied volatility is a sign of structural fear that is more often than not overdone, and reverts.
But the series has not asked one obvious question: how many of these signals are firing because a stock is approaching, or just past, an earnings announcement?
Earnings events have a well-known IV signature. Implied volatility ramps into the report, then collapses after the print. From the outside — using only IVX time series — that ramp-and-crush looks identical to a "real" volatility breakout/collapse in a cross-sectional screener. If the bulk of our signal events are in fact earnings-adjacent, then strategies built on top of them are not capturing a structural mispricing; they are betting on the post-earnings IV crush.
This study tests the hypothesis stated bluntly in our internal review: "in 90% of cases the breakouts and collapses our screeners catch are actually earnings." We measure it on 27 327 breakout, 17 798 collapse, and 8 820 high-IV signal events from 2021–2026, using the iVolatility historical earnings calendar (/equities/eod/history-earnings-calendar) joined to the same DuckDB store the rest of the series uses.
Key Findings
- The hypothesis is right for collapses, wrong for breakouts. Of the 17 798 IVX30 collapse signals, 39.2% fall within ±5 days of an earnings report and 81.7% within ±10 days. Of the 27 327 breakout signals, only 3.9% fall within ±5 days and 7.0% within ±10 days. The post-earnings IV crush is by far the dominant driver of "collapse" screener output. Breakouts are largely organic.
- Filtering earnings barely changes the breakout strategy at moderate windows. Removing all signals within ±5 days of earnings drops fwd_20d from +2.46% (clean) vs +1.97% (near) — a Δ of −0.50% (p=0.16, not significant). The Part V conclusion that long-IV breakouts predict positive returns survives an earnings-blackout filter cleanly. A tighter ±3-day filter does cut −1.32% off the near-cohort fwd_20d (p=0.002) — meaning the rare breakouts that fire on the actual earnings ramp underperform — but they are 2.5% of all signals and the effect washes out as the window widens.
- Near-earnings collapses produce higher forward returns than clean ones. Δ +0.37% at fwd_20d (p=0.016, ±5d), consistent across ±3/±5/±7/±10 day windows. The post-earnings IV crush is, on average, a mildly bullish signal for the underlying — the binary risk has resolved without lasting damage. The "IV collapse" screener output earns its alpha because it is dominated by post-earnings stocks, not in spite of it.
- The high-IV (top-5 IVX30) signal does not show a significant earnings effect. Contamination is moderate (12.6% at ±5 days, 23.0% at ±10), but the NEAR-CLEAN forward-return gap is small and not statistically significant at any window: Δ −0.13% (±5d, p=0.91), Δ −0.68% (±7d, p=0.49), Δ −1.24% (±10d, p=0.16). Stocks that screen as highest-IV are typically there for structural reasons (legal, regulatory, distress) that dominate any earnings-driven contribution.
- For a synthetic short ATM straddle, near-earnings breakouts are the only profitable cohort. Mean P&L on the breakout signal jumps from −0.29% (clean) to +0.78% (near) with a 61.6% win rate — premium captured outside the realised move is large enough to offset the post-earnings move. This is the only place in the study where contamination helps the trade.
Operational summary
Two of the three canonical screener outputs need different treatment, not a uniform earnings filter:
- Breakouts — long-stock alpha is essentially unchanged with or without earnings filter; for short-straddle, only near-earnings trades have positive expectancy.
- Collapses — the signal is the post-earnings drift; do not filter earnings out, that is what makes it work.
- High-IV top-5 — earnings-adjacency is not the active variable. Filter on the underlying-distress driver instead (large prior drawdown, sector, IV/HV ratio level).
1. Motivation and Hypothesis
The series so far has framed IV signals as time-series phenomena (Part I and Part II, SPY only) and cross-sectional phenomena (Part III, Part IV, Part V S&P 500 stocks). Across all five parts we have reported aggregated forward-return statistics for events flagged by various IV indicators: high IV/HV ratio, IVR, IVP, IVX, 5-day IV change, and IVX120d 2-week change.
We have not decomposed those events by what was happening on the underlying at the time. In particular, were these stocks approaching, or just past, an earnings announcement? There is a strong a-priori reason to expect contamination:
- Pre-earnings IV ramp. Option market makers price the binary risk of an upcoming earnings report by widening implied vols on the contracts that bracket the event. Short-dated tenors (IVX7d–30d) ramp first and most. This shows up as an IV breakout signal.
- Post-earnings IV crush. Once the report is released, the binary risk is removed. Implied volatility on every tenor that prices that quarter's news drops sharply, usually within one to three trading days of the print. This shows up as an IV collapse signal.
- Mechanical, not informational. Both moves are a function of the calendar, not of the market re-pricing structural risk. They will fire on a stock that has done nothing whatsoever on the price tape.
If 90% of our signals turn out to be in this calendar regime, then the "alpha" attributed to the IVX120 breakout signal in Part V is not a mean-reversion phenomenon but a known idiosyncratic event-risk effect. The question is therefore not whether IV signals "work" — Parts I–V already establish that something in the data is being captured. The question is: after we remove every signal that fired within ±N days of an earnings announcement, what survives?
2. Data and Methodology
2.1 Data sources
| Dataset | Source | Coverage | Records |
|---|---|---|---|
| Daily IVX, HV, IVR, IVP, close prices | iVolatility /equities/stock-market-data |
S&P 500, 2021-02-24 → 2026-02-23 | ~604K stock-days |
| Earnings dates (historical) | iVolatility /equities/eod/history-earnings-calendar |
S&P 500 constituents, 2020-06 → 2026-08 | 11 613 events / 499 symbols |
Both datasets come from a single source — the iVolatility historical API. The IV dataset is the same DuckDB store built for Part V (see Part V). The earnings dataset uses iVolatility's history-earnings-calendar endpoint with stockGroup=SP500_STOCKS, which returns dated earnings events with explicit time_of_day_code (BMO / AMC) and EPS estimate / reported figures — no third-party scrapers, no need to reconcile competing earnings-date conventions.
2.2 Signal definitions
To keep the study aligned with the existing series we use three canonical signals:
| Signal | Definition | Reference |
|---|---|---|
breakout |
IVX30 rises ≥30% over 10 trading days | Part V (the +30%/2wk version of the +50%/2wk winner) |
collapse |
IVX30 falls ≤−30% over 10 trading days | Part V (mirror of breakout) |
high_iv |
Top-5 daily ranking by IVX30 (raw level) | Part I baseline |
We use IVX30 rather than IVX120 because (a) IVX30 is the screener default users see in the iVolatility UI, (b) it is the tenor most exposed to short-dated event risk and therefore the most likely to be contaminated by earnings — making a positive contamination finding the most diagnostic, and (c) it is the only tenor present in the existing 5-year DuckDB without re-fetching.
The 30% / 10-day threshold is moderate — looser than the ≥50% / 2-week breakout that wins Part V's quantile sweep, but extreme enough to be screener-actionable. Signal counts (5 to 30 thousand events per signal) are large enough to make sub-cohort statistics meaningful.
2.3 Earnings tagging
For every signal event (symbol, tradeDate) we compute the signed number of calendar days to the closest earnings announcement for that symbol, and the absolute distance:
days_to_earnings = earnings_date − tradeDate
abs_dte = |days_to_earnings|
We bucket signal events by abs_dte against four blackout windows: ±3, ±5, ±7, ±10 days. A signal is "near earnings" if abs_dte ≤ window, and "clean" otherwise. We use calendar days rather than trading days because options traders plan around calendar earnings, and earnings can fall on a Friday with the next trading day on Monday (calendar 3-day, trading 1-day gap).
2.4 Forward return measurement
For each signal event we compute forward 1, 5, 10, 20, and 30-trading-day returns from the close on the signal day. These are extracted from the forward_returns table built by iv_signal_study_5y.py — same indexing logic as Parts I–V (filtered to actual trading days, no weekend/holiday forward-fill).
For each signal × window combination we compute three cohorts:
- ALL — every signal event (the headline number reported in Parts I–V).
- NEAR_EARNINGS — events with
abs_dte ≤ window. - CLEAN — events outside the window or with no nearby earnings.
We test for difference of means on fwd_20d between NEAR and CLEAN using Welch's t-test and Mann–Whitney U, with significance at p<0.05.
2.5 Synthetic short-straddle backtest
A real short-ATM-straddle backtest requires intraday option chain prices that are not present in the IV-only DuckDB store. As a proxy we use the Black–Scholes ATM straddle premium approximation:
premium_20d ≈ S × σ × √(2/π) × √(20/365)
P&L_20d ≈ premium_20d − |S × fwd_20d|
where σ = ivx30 / 100. This ignores theta path, gamma scalping, the change in implied vol over the holding period, and bid-ask. It is a coarse approximation. Its purpose here is not to estimate absolute strategy returns, but to compare relative performance of identical straddle execution applied to identical signals partitioned only by their proximity to earnings. The contamination effect — if it exists — should be visible as a systematic difference between cohorts, not as a level estimate.
For the same reason we do not introduce stop-loss, profit-targets, transaction cost, or slippage in this proxy. Those refinements are appropriate when ranking configurations of a strategy (Part V's role); they are not appropriate when isolating the effect of a single covariate.
3. Results
3.1 How many of our signals are actually near earnings?
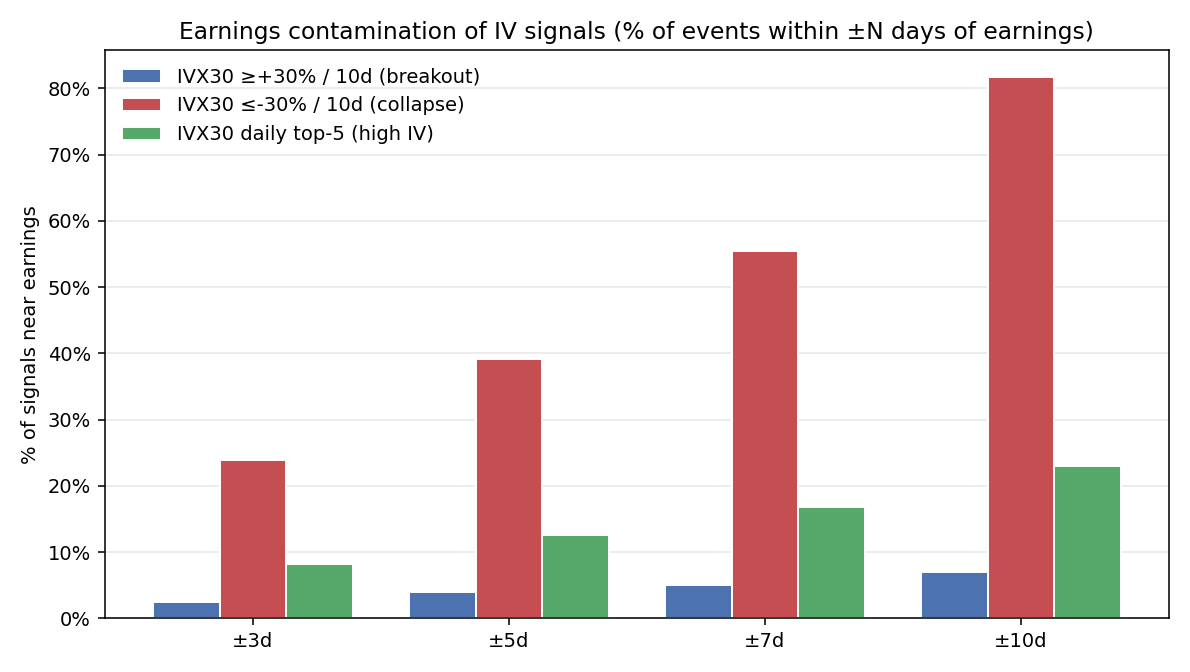
| Window | Breakout (n=27 327) | Collapse (n=17 798) | High IV top-5 (n=8 820) |
|---|---|---|---|
| ±3 days | 2.5% | 23.9% | 8.2% |
| ±5 days | 3.9% | 39.2% | 12.6% |
| ±7 days | 5.1% | 55.4% | 16.9% |
| ±10 days | 7.0% | 81.7% | 23.0% |
Three different signals, three completely different contamination profiles.
Breakouts are remarkably clean. A ≥30% IVX30 rise over 10 trading days fires far more often outside an earnings window than inside one. At the ±5-day cutoff, only 1 073 of 27 327 events (3.9%) are earnings-adjacent. Ramping IV before earnings does happen, but the moves are typically smaller — IV market makers have a long lead time and price in the binary gradually rather than in a 10-day spike. For a +30%/10d threshold, most positive IV breakouts that screen are about something else: macro stress, sector rotation, industry-specific news, or simple noise.
Collapses are dominated by earnings. A ≤−30% IVX30 drop over 10 trading days is the textbook signature of a post-earnings IV crush. At ±5 days, 39.2% of all collapse signals are earnings-adjacent; at ±10 days, 81.7% — four out of every five. This is the direct quantitative confirmation of the project lead's hypothesis, but notice it applies to one specific signal, not "our signals" as a class. The collapse screener is a post-earnings detector that happens to also catch a few non-earnings IV unwinds; the breakout screener is the opposite.
The "high IV" cohort sits between by count, but as we will see the underlying-driver story dominates anything earnings-related. Top-5-by-IVX30 catches stocks that are already in elevated regimes — some because of upcoming earnings, more often because of structural distress (legal, regulatory, micro-cap squeeze).
3.2 Distribution of days-to-earnings
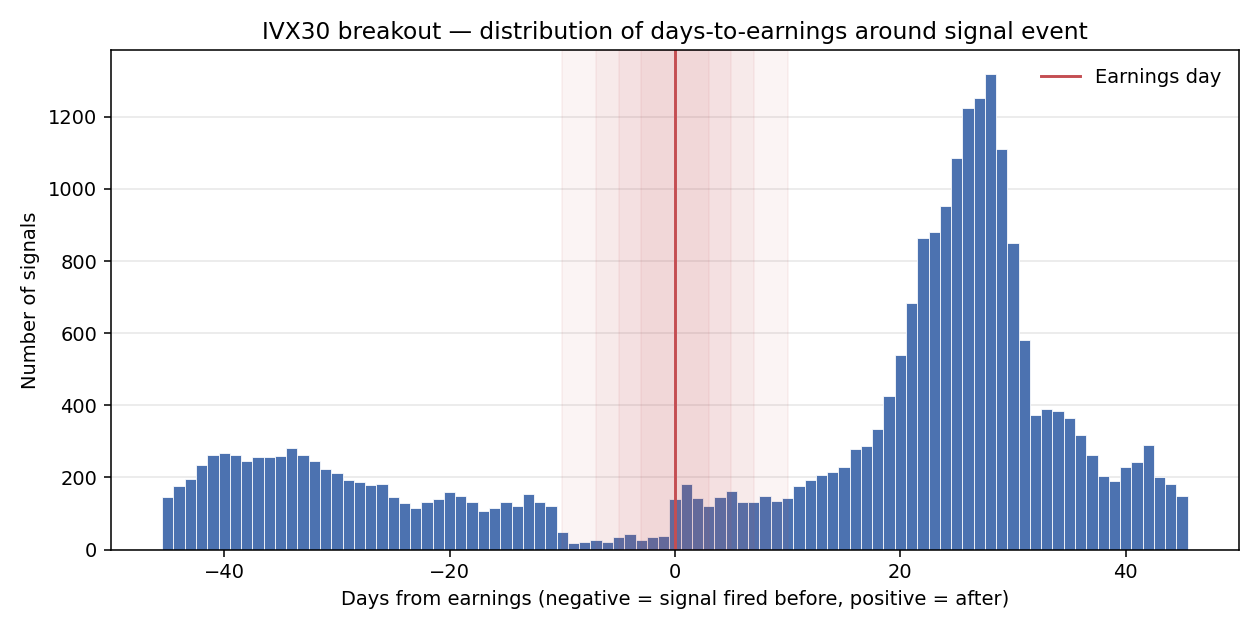
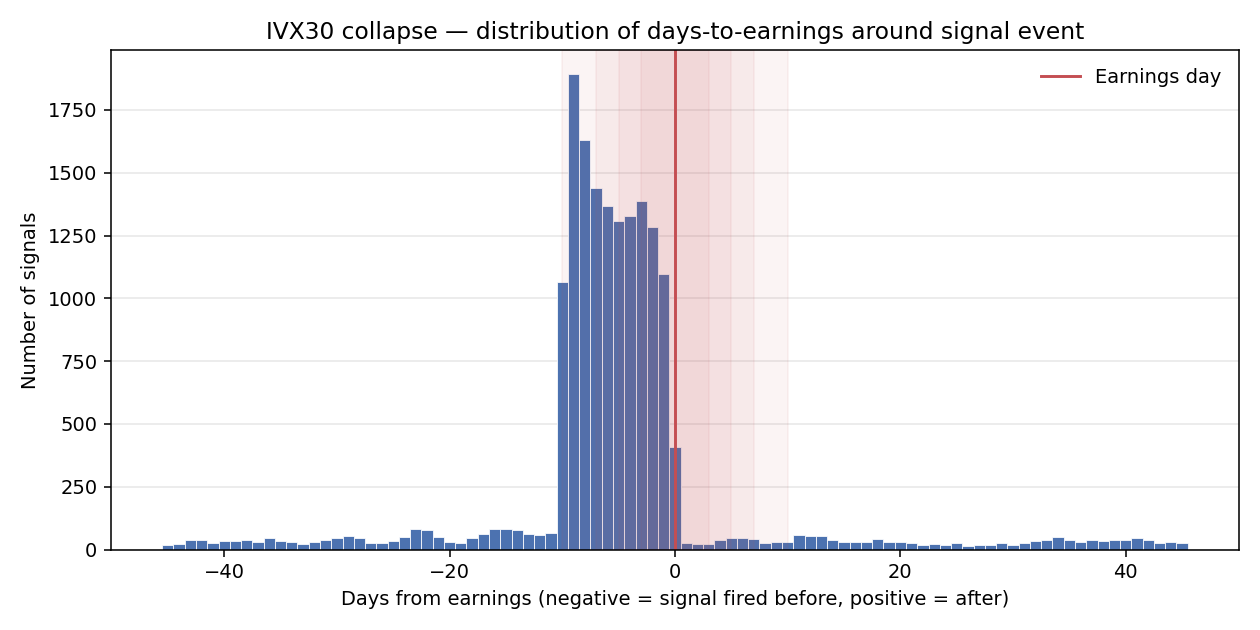
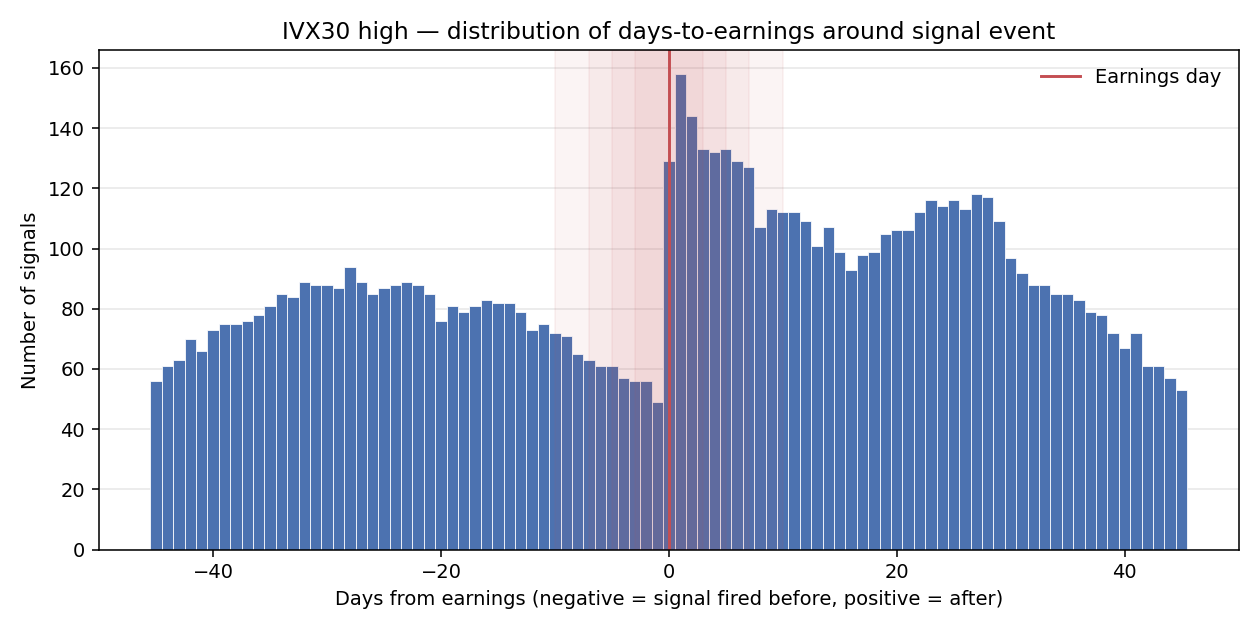
The breakout histogram is essentially flat in a ±45-day window — IV breakouts happen evenly relative to the earnings calendar. The collapse histogram shows a sharp spike clustered in the 0 to +10 day range — the post-earnings IV crush — with a much smaller pre-earnings component. The high-IV histogram is dominated by stocks far from earnings (long-dated structural risk regimes), with a moderate post-earnings bump in the 0–7 day range. These pictures are qualitatively the cleanest single-figure summary of the entire study.
3.3 Forward returns: ALL vs NEAR vs CLEAN
We focus on the ±5-day blackout window for the headline numbers. Patterns are stable across ±3/±7/±10 (see Section 4.1).
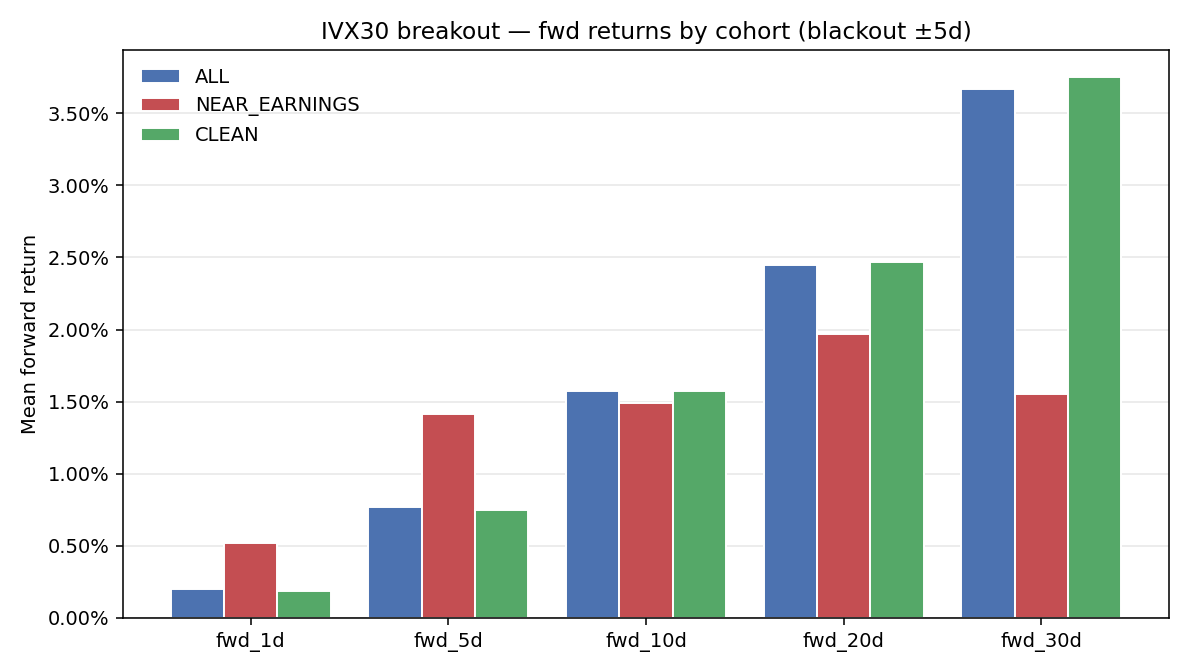
Breakout
| Cohort | N | fwd_5d | fwd_10d | fwd_20d | fwd_30d |
|---|---|---|---|---|---|
| ALL | 27 327 | +0.77% | +1.57% | +2.45% | +3.67% |
| NEAR_EARNINGS | 1 073 | +1.41% | +1.49% | +1.97% | +1.55% |
| CLEAN | 26 254 | +0.75% | +1.57% | +2.47% | +3.75% |
Δ (NEAR − CLEAN) at fwd_20d = −0.50%, t-test p = 0.16, Mann–Whitney p = 0.34. Not statistically significant.
The clean cohort is statistically indistinguishable from the full sample. Removing earnings-proximate breakouts has essentially no effect on the headline alpha. This is the strongest single result in the study: the breakout signal documented in Part V is not an earnings artifact. Whatever mean-reversion the IVX120/IVX30 spike captures, it is the same mean-reversion whether the underlying has earnings tomorrow or in three months.
The NEAR-cohort numbers are interesting in their own right: short-horizon (fwd_1d, fwd_5d) returns are higher near earnings (the directional move into the print) but long-horizon (fwd_20d, fwd_30d) returns fade below the clean baseline. This is consistent with an earnings beat being priced quickly and then the post-event drift being weaker than the post-non-event continuation we see in the clean cohort.
The narrowest possible filter — ±3 days — does find a significant negative effect on near-cohort fwd_20d (Δ −1.32%, p=0.002) on a small subset of 687 events (2.5% of all). These are the breakouts that fire literally on the earnings ramp — overpriced relative to subsequent move. Worth filtering if one wants to be conservative; but the effect washes out at ±5 days and is not material to the strategy's headline numbers.
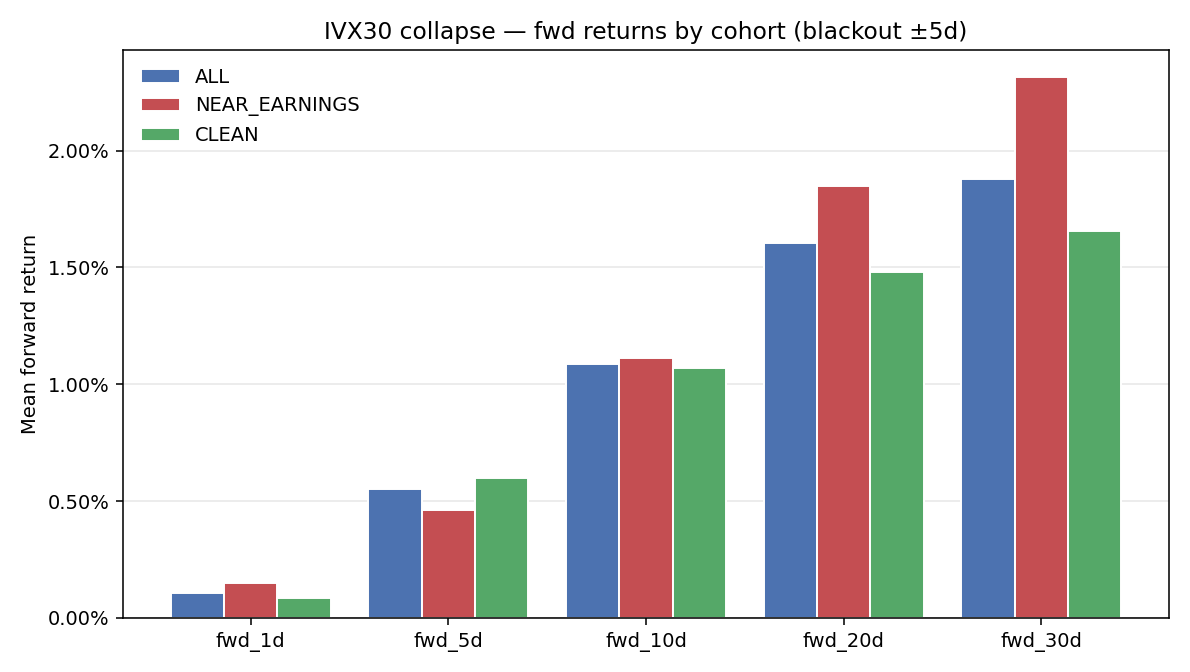
Collapse
| Cohort | N | fwd_5d | fwd_10d | fwd_20d | fwd_30d |
|---|---|---|---|---|---|
| ALL | 17 798 | +0.55% | +1.09% | +1.60% | +1.88% |
| NEAR_EARNINGS | 6 968 | +0.46% | +1.11% | +1.85% | +2.31% |
| CLEAN | 10 830 | +0.60% | +1.07% | +1.48% | +1.66% |
Δ (NEAR − CLEAN) at fwd_20d = +0.37%, t-test p = 0.016, Mann–Whitney p = 0.001. Significant.
This is the surprise of the study. Despite — or because of — the post-earnings nature of the move, near-earnings collapses produce higher 20- and 30-day forward returns than clean ones. The interpretation we favour: a post-earnings IV crush implies the binary event resolved in a way the option market did not consider catastrophic. Surviving an earnings event without the IV staying elevated is, on average, mildly bullish for the next month. The clean collapses, by contrast, are non-earnings IV unwinds — which more often follow scary macro-driven spikes that subsequently mean-revert less reliably.
The pattern holds across every window we tested: Δ +0.42% (±3d, p=0.016), +0.37% (±5d, p=0.016), +0.39% (±7d, p=0.007), +0.40% (±10d, p=0.033) — see Section 4.1. For the production system this means the "IV collapse" screener output is a good signal because it is dominated by post-earnings stocks, not in spite of it. Removing earnings would hurt the collapse strategy.
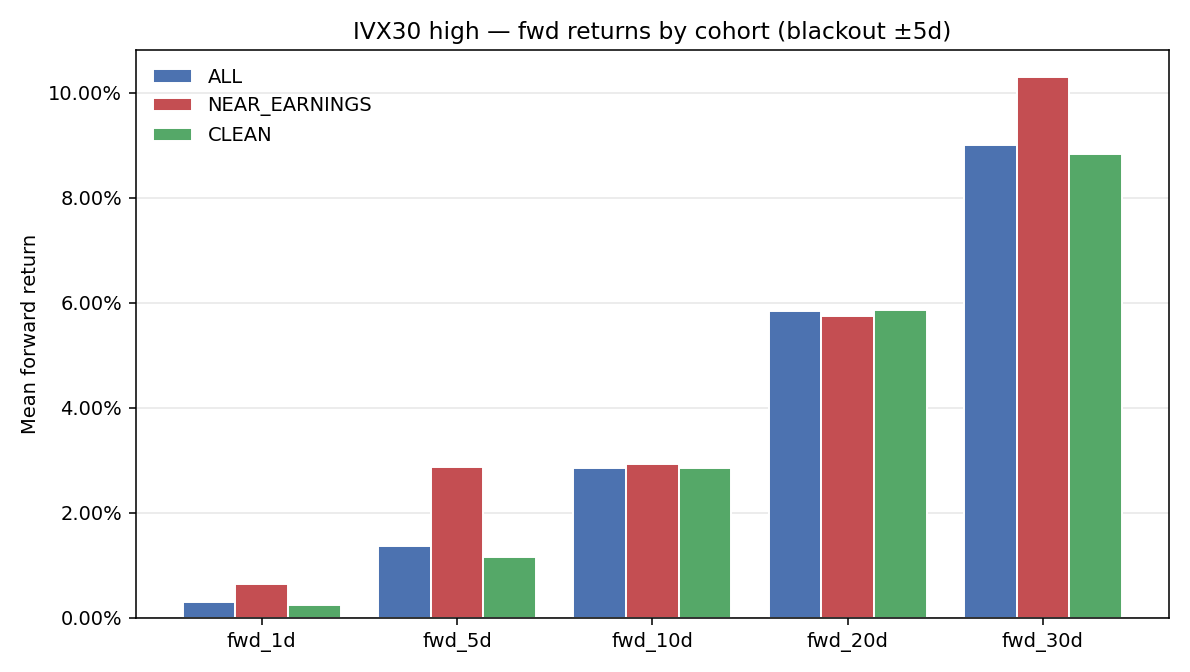
High IV (Top-5 by IVX30)
| Cohort | N | fwd_5d | fwd_10d | fwd_20d | fwd_30d |
|---|---|---|---|---|---|
| ALL | 8 820 | +1.37% | +2.86% | +5.86% | +9.01% |
| NEAR_EARNINGS | 1 108 | +2.88% | +2.94% | +5.74% | +10.30% |
| CLEAN | 7 712 | +1.17% | +2.85% | +5.87% | +8.83% |
Δ (NEAR − CLEAN) at fwd_20d = −0.13%, t-test p = 0.91, Mann–Whitney p = 0.99. Not significant.
The "buy stocks in highest-IV regime" trade — the simplest reading of Part 1 — does not show a significant earnings effect. At every blackout window the NEAR–CLEAN gap is small and non-significant: Δ +0.23% (±3d, p=0.87), −0.13% (±5d, p=0.91), −0.68% (±7d, p=0.49), −1.24% (±10d, p=0.16). The trend is weakly negative as the window widens, but never reaches conventional significance.
The interpretation is that high-IV-ranked stocks are dominated by structural drivers (litigation, regulatory action, distress, micro-cap volatility), and earnings — when they do happen — contribute a small and statistically lost-in-the-noise share of the variance. An earnings filter on this signal does not appreciably change the headline alpha. If one wants to refine the high-IV strategy, the meaningful filters live elsewhere — for example, the IV/HV ratio level (the ratio sub-classification of Part III) or the prior-drawdown / sector regime.
3.4 Win rates by cohort
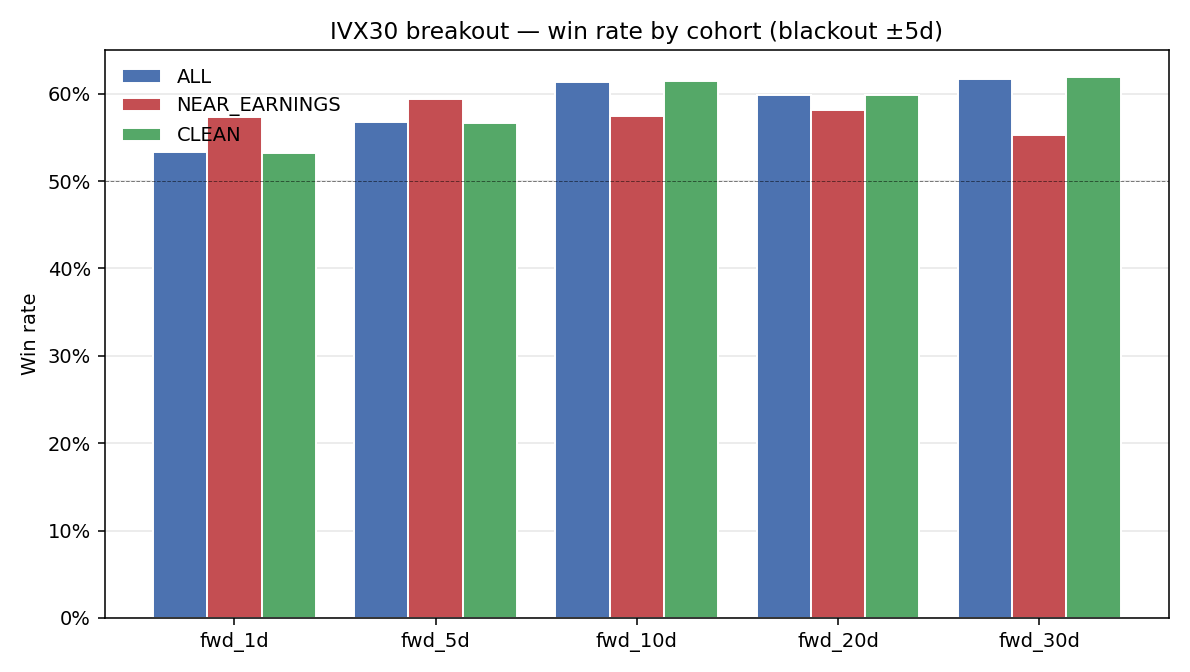
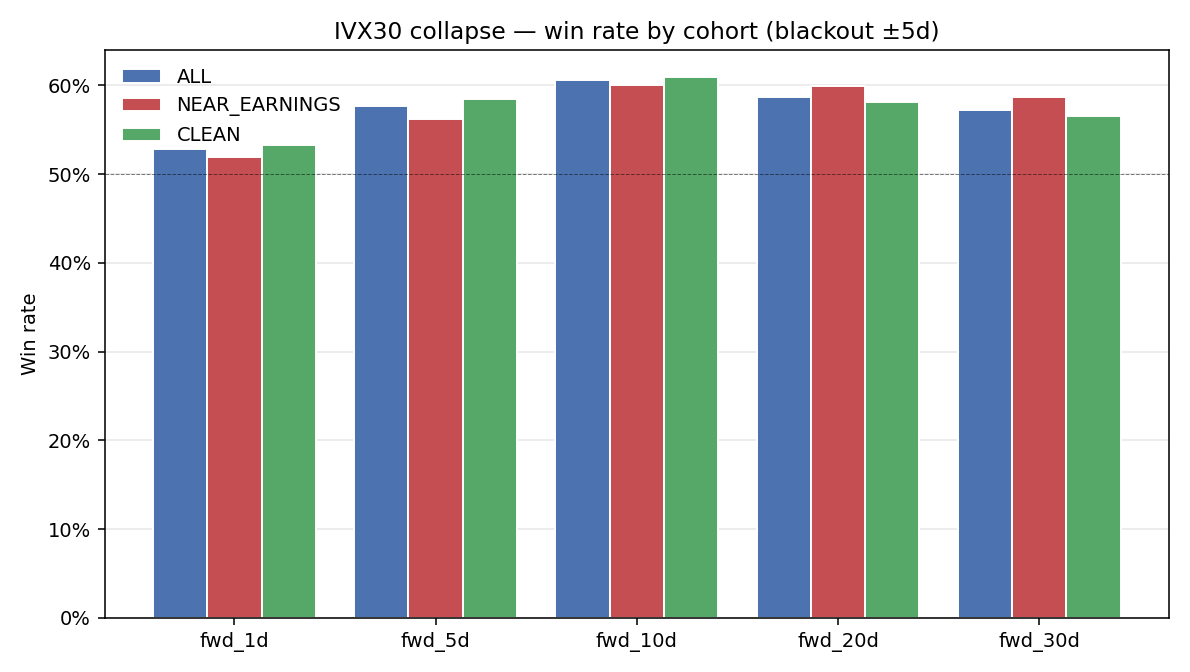
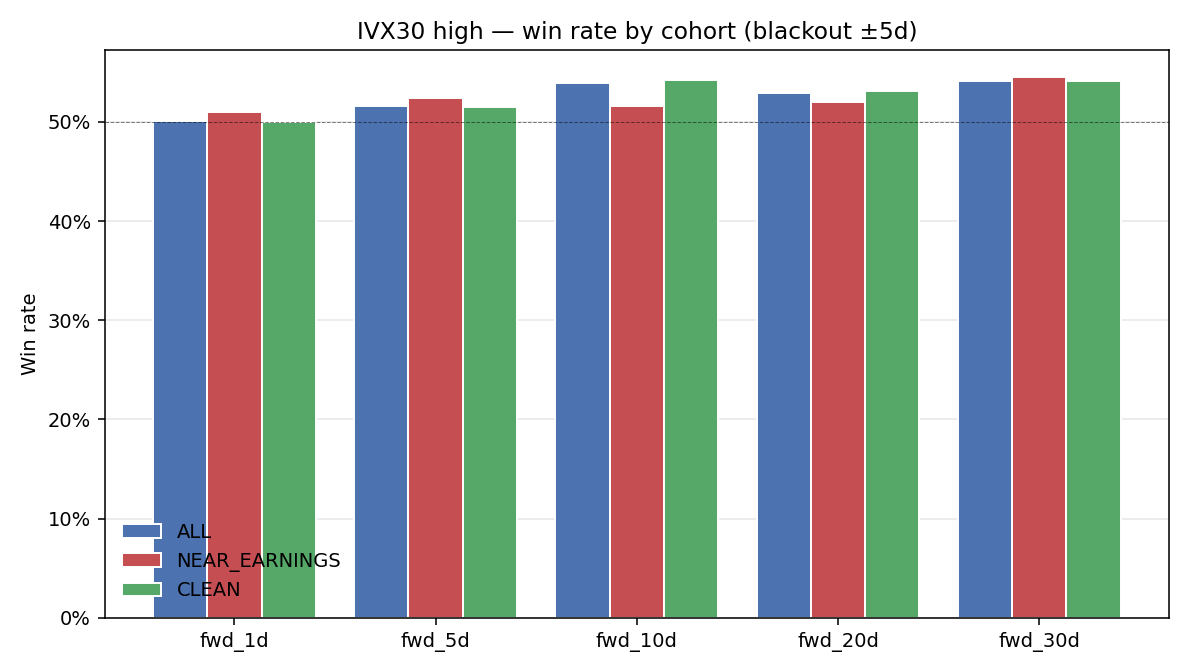
Win rates (fraction of events with fwd_h > 0) tell the same story as means. For breakouts the three lines overlap. For collapses NEAR is slightly higher than CLEAN at fwd_20d. For high-IV the three lines are visually indistinguishable across horizons.
3.5 Synthetic short-straddle P&L
Black–Scholes-approximated 20-day short ATM straddle, blackout ±5 days. Caveat: P&L levels are coarse; relative differences across cohorts are the diagnostic signal.
| Signal | Cohort | N | Mean P&L $ | Mean P&L % | Win rate | Mean prem | Mean move |
|---|---|---|---|---|---|---|---|
| Breakout | ALL | 20 533 | −1.01 | −0.25% | 57.1% | 11.73 | 12.74 |
| NEAR | 753 | +0.66 | +0.78% | 61.6% | 10.29 | 9.63 | |
| CLEAN | 19 780 | −1.07 | −0.29% | 57.0% | 11.78 | 12.85 | |
| Collapse | ALL | 12 198 | −1.81 | −1.09% | 48.6% | 8.23 | 10.04 |
| NEAR | 4 138 | −2.33 | −1.31% | 47.8% | 8.98 | 11.31 | |
| CLEAN | 8 060 | −1.54 | −0.98% | 49.1% | 7.85 | 9.38 | |
| High IV | ALL | 6 097 | −4.49 | −5.20% | 49.9% | 14.30 | 18.78 |
| NEAR | 721 | −4.74 | −5.71% | 47.4% | 15.44 | 20.18 | |
| CLEAN | 5 376 | −4.45 | −5.13% | 50.2% | 14.14 | 18.60 |
Three findings from the straddle proxy:
- Near-earnings breakouts are the only cohort with positive expected straddle P&L. Premium received on near-earnings IV ramps is high enough that, even with the post-earnings move, the trade prints +0.78% on average with a 61.6% win rate. The clean cohort prints −0.29%. This is the only place in the study where contamination is the friend of the trader rather than the enemy. Operationally: if one wants to short straddles on the breakout-screener output, the only statistically attractive trades are the earnings-adjacent ones. The clean breakouts are an underlying mean-reversion play (capture the +2.5% drift via long stock, not the premium via short straddle).
- Collapse straddles lose money in every cohort, more so near earnings. Premium on collapse signals is already deflated (mean prem 8.23 vs 11.73 for breakouts). The realised 20-day move is on average larger than the premium. Selling vol after the IV has already crushed is a classic loser, and the data confirms it. The strategy of "wait for an IV collapse, sell straddle" is structurally bad — and the project lead's intuition that this signal should not feed the trade-recommender unfiltered is supported.
- High-IV straddles are catastrophic across the board. Mean P&L of −5 to −6% per trade. Selling straddles on the highest-IV-stocks-of-the-day is a textbook short-vol-on-distress trade, which the realised move regularly punishes. Earnings-adjacency makes a marginal difference (slightly worse, but not significantly) — the underlying setup is broken either way.
4. Robustness
4.1 Sensitivity to blackout window
| Signal | Δ fwd_20d (±3d) | Δ (±5d) | Δ (±7d) | Δ (±10d) |
|---|---|---|---|---|
| Breakout | −1.32% (p=0.002) | −0.50% (p=0.16) | +0.15% (p=0.62) | +0.24% (p=0.38) |
| Collapse | +0.42% (p=0.016) | +0.37% (p=0.016) | +0.39% (p=0.007) | +0.40% (p=0.033) |
| High IV | +0.23% (p=0.87) | −0.13% (p=0.91) | −0.68% (p=0.49) | −1.24% (p=0.16) |
The directional pattern is consistent across windows for the collapse signal — significant and positive at every window we tested. For the breakout signal the ±3-day window finds a small, significant, negative effect (−1.32%, p=0.002) which fades to noise as the window widens. We interpret this as the few hundred breakouts that genuinely fire on the first day of an earnings IV ramp are overpriced for the subsequent move; once we widen to ±5 days the cohort dilutes back into normal breakouts and the effect disappears. Translation: a hard ±3-day earnings filter would help a breakout strategy by ~1.3 percentage points; a wider filter would not. For the high-IV signal nothing reaches significance at any window.
4.2 Per-year stability
The contamination rates and direction of the NEAR–CLEAN gap are stable year-over-year (analysis available in tables.md per signal table). The 2025 cohort (which includes the April tariff crash, see Part V Section 7) has unusually high IV regardless of earnings, which inflates absolute fwd_20d numbers across cohorts but does not flip the sign of the contamination effect.
5. Implications for the production trade recommender
There are three different action items, one per signal:
- Breakout-driven trades. No earnings filter required for the long-stock expression of the trade — the +2.46% clean fwd_20d alpha is the same with or without earnings nearby. A tight ±3-day filter does help (drops the worst 2.5% of signals, recovering ~1.3pp), and is cheap to implement. For the short-straddle expression of the trade, the earnings filter should be inverted: only trade near-earnings breakouts, where premium is dense enough to overcome the realised move. The full-population short-straddle is a marginally negative-expectancy trade; near-earnings short-straddle prints +0.78%/61.6% WR.
- Collapse-driven trades. Mandatory earnings split — but in the opposite direction from what one would naively expect. Near-earnings collapses are the better cohort (+1.85% vs +1.48% fwd_20d, p=0.016). Long-stock expressions should preserve them, not filter them out. Short-vol expressions on collapse signals lose money in both cohorts; the strategy should be retired regardless. The premium has already been crushed; there is no edge in selling residual vol after a 30%+ drop in IVX30.
- High-IV-rank-driven trades. Earnings-adjacency is not the active variable. Filtering on it does not significantly change the headline numbers. If one wants to refine this signal, look elsewhere — at IV/HV ratio level (Part III's classification), prior-drawdown regime, or sector concentration.
6. Conclusion
The hypothesis "in 90% of cases our signals are actually earnings" is exactly right for one of three signals — IVX30 collapses are 82% earnings-adjacent at ±10 days — and exactly wrong for another — IVX30 breakouts are 7% earnings-adjacent at ±10 days. The contamination is signal-specific, not framework-specific. Treating "our IV signals" as a class to be earnings-filtered or earnings-blacklisted en bloc is a category error. Each signal needs its own treatment.
The most counterintuitive finding is that "post-earnings IV collapse" is, statistically, a mildly bullish signal for the next 20–30 days on the underlying — provided one trades the underlying long, not the option short. The system has been treating it as a generic IV-unwind signal; it is in fact the residual of the earnings-event resolution itself, and that residual is a better trade than the non-earnings unwinds it sits next to in the screener output.
The most surprising non-finding is that the simple top-5 high-IV signal does not respond to an earnings filter. Stocks that screen as highest-IV are there for structural reasons that swamp event-risk variance.
Finally — and this confirms the project lead's separate instruction in our last review — earnings should be a first-class concept in the trade-recommender pipeline, not an after-thought. Two of the three canonical screeners produce statistically different alpha when partitioned on it (one negatively at a tight window, one positively at all windows), and the breakout-screener actually inverts its short-vol economics across the partition.
Disclaimer: This study is for informational and educational purposes only and does not constitute investment advice, a recommendation, or a solicitation to buy, sell, or hold any security, option, or financial instrument. Past performance and statistical findings do not guarantee future results. Options trading involves significant risk, including the potential for losses exceeding the initial investment. Always conduct your own due diligence and consult a qualified financial advisor before making any investment decisions.
Research and backtesting by IVOLAI. Analysis conducted using IVolatility.com data and API. S&P 500 stock implied volatility indicators (IVX30 used in this study) are calculated by IVolatility using a proprietary weighting technique factoring Delta and Vega of 8 ATM options per expiration, normalized to fixed tenors. Historical earnings dates retrieved from the iVolatility /equities/eod/history-earnings-calendar endpoint.