IV Change as a Volatility Momentum Signal: Does the Screener's "IV30Chg" Column Predict Returns?
Part IV of: "Does High VIX Predict SPY Declines? Testing the 'Buy the Fear' Thesis"
A Cross-Sectional Study of 520 S&P 500 Stocks, 2021–2025
Summary
In Part I: Study, we established that the IVX30/HV20 ratio predicts individual stock underperformance. In Part II: Study, the IVX30 z-score emerged as the best SPY timing signal (+61.24%, Sharpe 1.36), while IVP was viable but weaker (+10.80%). In Part III: Study showed the IV/HV ratio fails as a cross-sectional stock selection signal despite its popularity on screeners.
This Part IV tests a different screener metric: IV30 Change (%) — the rate of change of implied volatility. When traders sort by "IV30Chg" on the IVolatility Stock Monitor, they see stocks with the biggest recent IV spikes. The premise is that rapidly rising IV signals catalysts or dislocations worth trading.
The main takeaway: the screener's IV30Chg column has genuine predictive value — it surfaces the right stocks. The edge is not available every day, but when extreme spikes appear (>50% in 5 days), the signal is strong and backtests profitably. The screener does the hard work of finding candidates; the trader's job is to apply the right threshold and risk management.
Key Findings:
- The screener surfaces actionable candidates. Stocks appearing at the top of the IV30Chg sort with extreme spikes (>50% in 5 days) produce +5.45% mean 20-day return with 71.4% win rate — 5.5× the baseline. The screener correctly identifies stocks with elevated mean-reversion potential.
- Not every day has a trade — and that's the point. Moderate IV changes (<20%) carry no edge. The screener is most valuable on days when the top names show truly extreme spikes, which occur on a minority of trading days. Patience and threshold discipline are key.
- Walk-forward backtest confirms the edge with proper risk management. Shorting stocks with >50% IV change across 217 S&P 500 names over 5 years with a 5% stock stop-loss: +$125K profit (91% WR, 284 trades, max DD -$1,021). Without stop-loss the strategy loses money — risk management turns the screener's signal into a profitable system.
- Short stocks, not options, for this signal. SHORT_OPTION BASELINE returns +30% (theta helps), but SHORT_STOCK with SL delivers 4× the return (+125%). Options and stocks respond differently to stop-loss — stocks need it and benefit enormously.
- IV Change + High IVP is the strongest regime. Stocks with both high IV change (≥P75) and high IVP (≥80) return +2.01% with 56.4% win rate — 2× baseline. Combining screener columns amplifies the edge.
- Practical workflow: Sort by IV30Chg% → require >50% → optionally cross-check IVP ≥ 80 → short the stock with 5% SL and 30-day exit.
What We Measured
For each stock-day in our 520-stock, 5-year universe, we computed:
- 5-day IV change (%):
(IVX30_today − IVX30_5d_ago) / IVX30_5d_ago × 100 - This captures the velocity of implied volatility — how fast IV is moving, regardless of its level
Distribution of 5-day IV changes:
- Mean: +0.73%, Median: +0.32% (slight positive drift as IV tends to spike more than it fades)
- Standard deviation: 13.2%
- P5–P95 range: [-19.3%, +20.9%]
- Extreme spikes (>50%): 3,173 observations (0.53% of total)
- Very extreme (>100%): 312 observations (0.05%)
Cross-Sectional Quintile Analysis
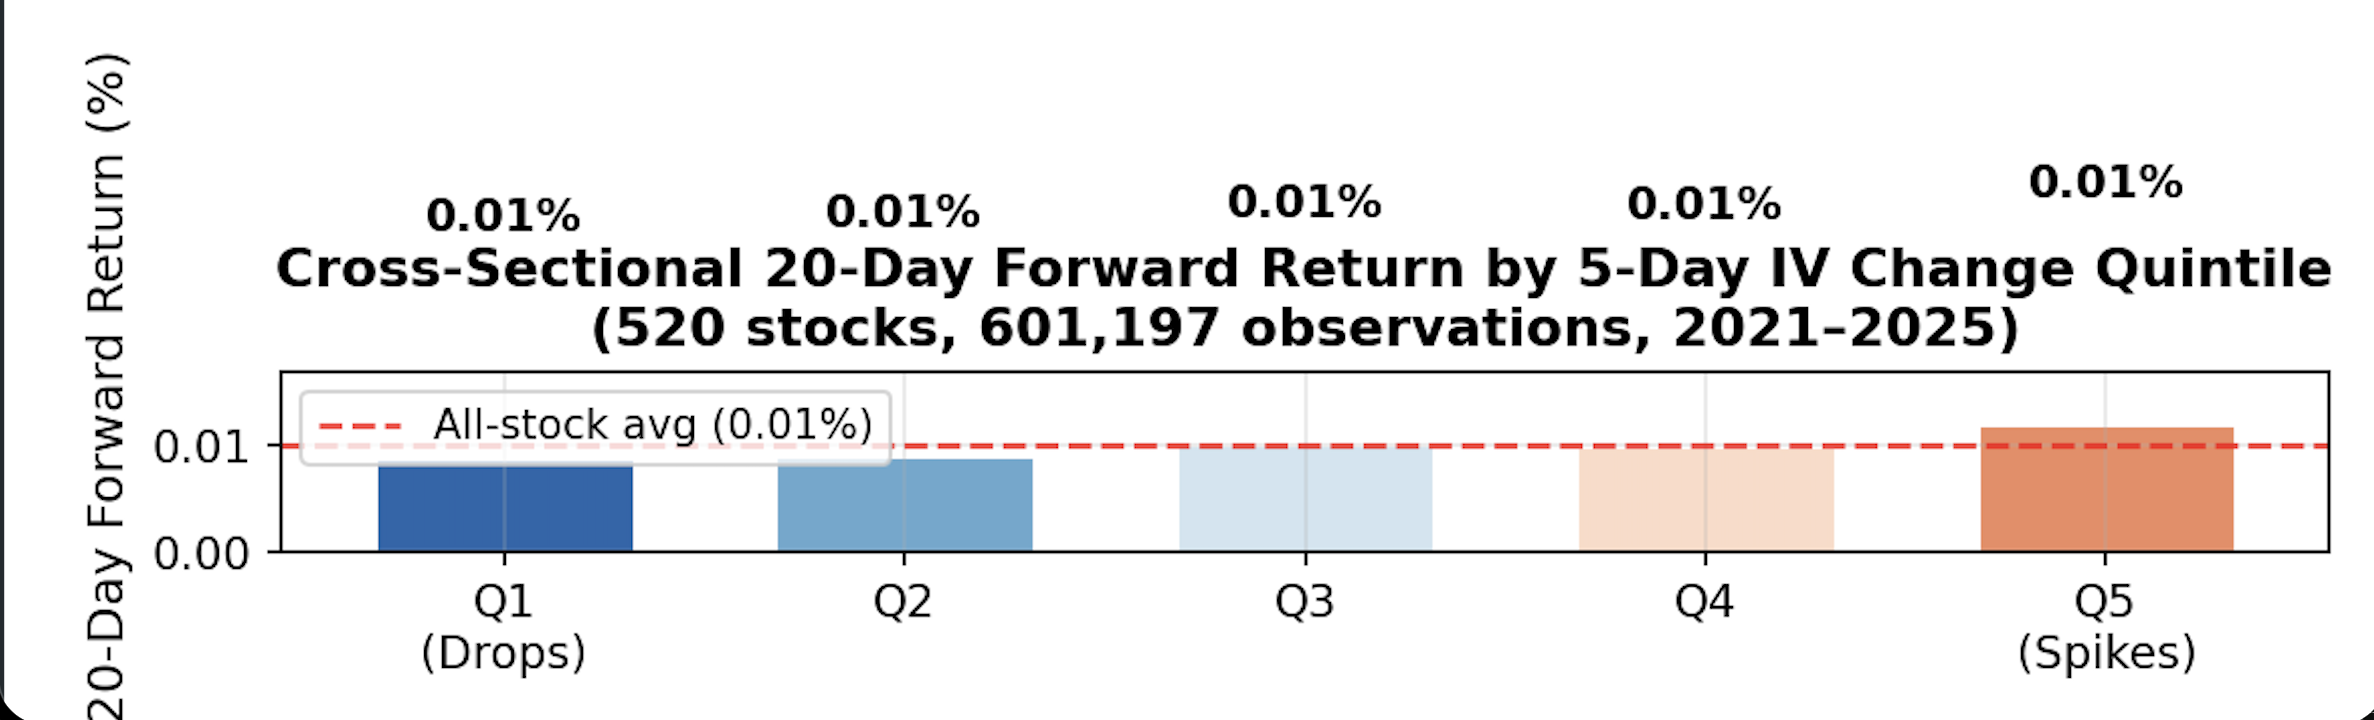
Figure D1: Mean 20-day forward returns by 5-day IV change quintile. Q5 (biggest spikes) slightly outperforms Q1 (biggest drops), but the spread is economically insignificant (+0.31%).
| Quintile | IV Change Range | Mean 20d Return | Win Rate | N |
|---|---|---|---|---|
| Q1 (Biggest drops) | [-86%, -7.8%] | 0.89% | 54.6% | 120,240 |
| Q2 | [-7.8%, -2.0%] | 0.91% | 53.8% | 120,239 |
| Q3 | [-2.0%, +2.7%] | 1.01% | 53.8% | 120,239 |
| Q4 | [+2.7%, +8.9%] | 0.99% | 53.4% | 120,239 |
| Q5 (Biggest spikes) | [+8.9%, +515%] | 1.20% | 54.9% | 120,240 |
Quintile spread (Q5 − Q1): +0.31% — statistically significant (p < 0.001 given N > 600K) but economically marginal. The Spearman rank correlation between IV change and forward return is ρ = +0.008, essentially zero.
Verdict: As a general cross-sectional signal, IV change has negligible predictive power. The entire quintile range spans just 0.31 percentage points — not enough to overcome transaction costs.
The Signal Works at Extremes
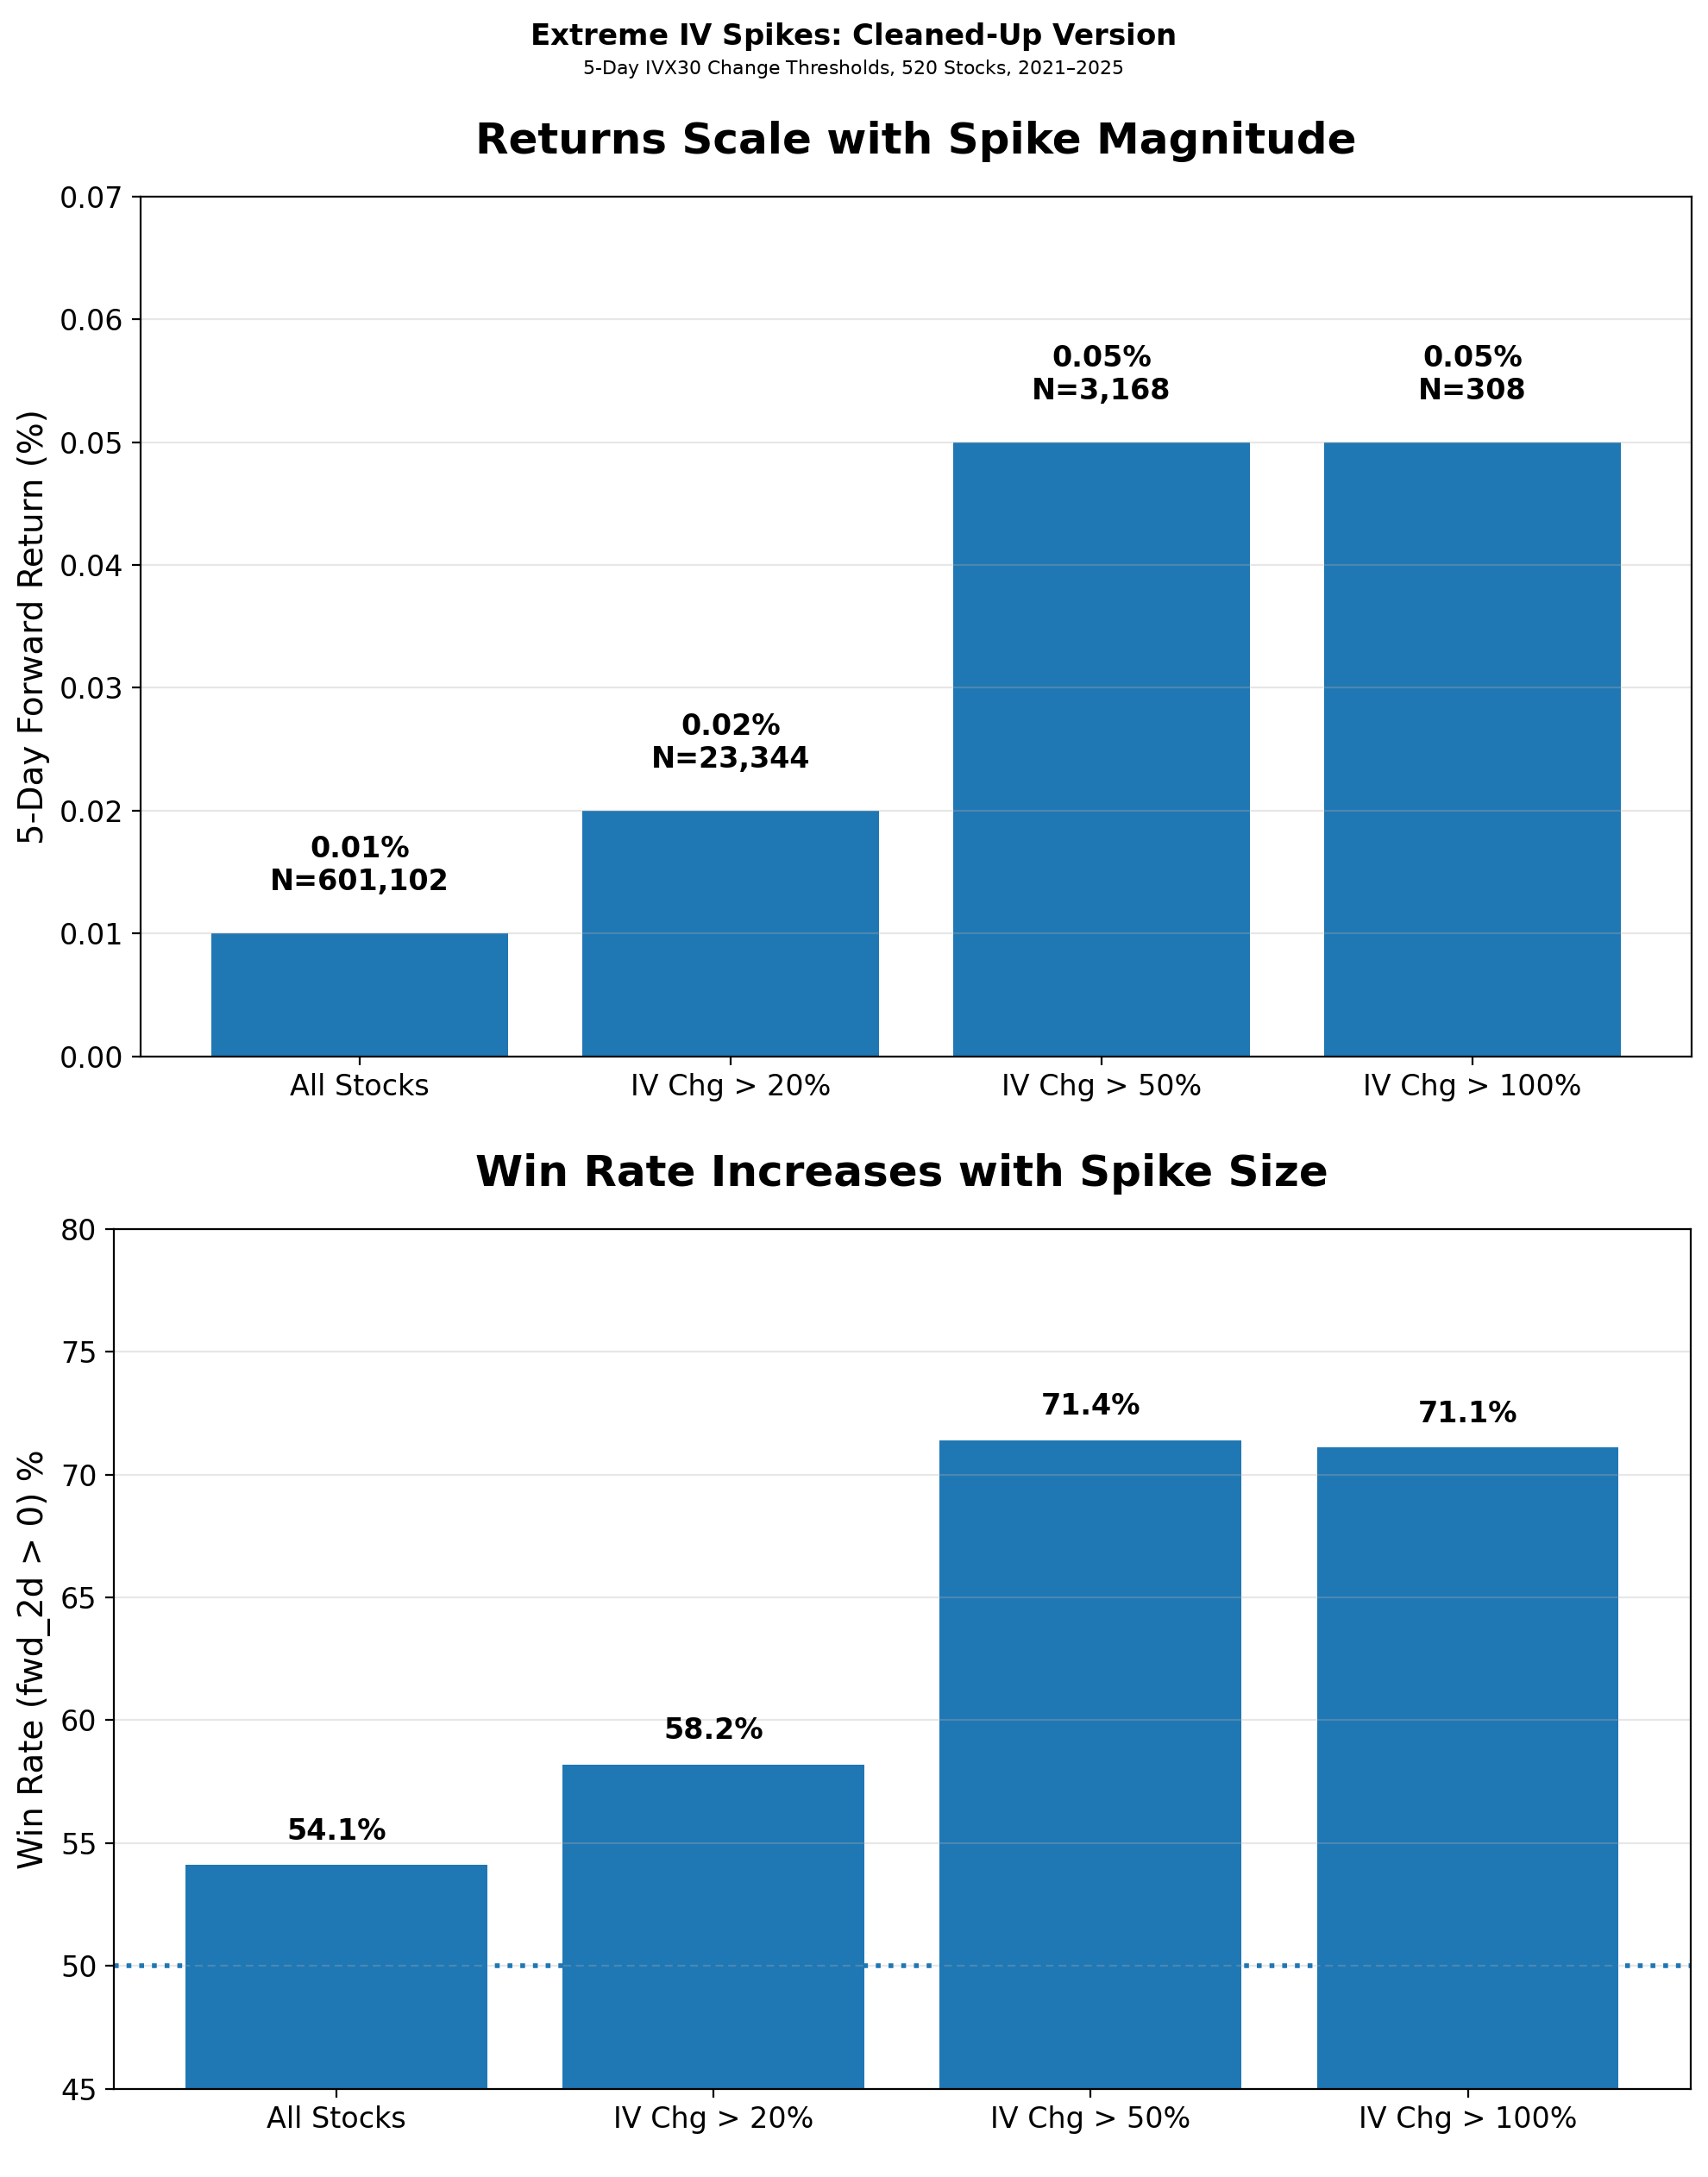
Figure D2: Returns scale dramatically with spike magnitude. The signal is effectively binary — ignore moderate changes, act only on extremes >50%.
This is the key finding of this section. While the overall quintile spread is negligible, the tail behaves very differently:
| Threshold | Mean 20d Return | Win Rate | N | vs Baseline |
|---|---|---|---|---|
| All stocks | 1.00% | 54.1% | 601,197 | — |
| IV Chg > 20% | 1.56% | 56.2% | 33,070 | +0.56% |
| IV Chg > 50% | 5.45% | 71.4% | 3,168 | +4.45% |
| IV Chg > 100% | 8.22% | 73.4% | 312 | +7.22% |
Stocks that experience a >50% 5-day IV spike — the kinds of names that dominate the screener's "IV30Chg" sort — return 5.5× the baseline with a 71.4% win rate.
Why extreme IV spikes predict positive returns: These events typically coincide with sudden negative catalysts — earnings misses, FDA rejections, accounting scandals, sector selloffs. The stock drops, IV spikes, and the market over-reacts. The subsequent mean-reversion produces the elevated returns. This is the same mechanism as the "buy the fear" thesis from Part I, but applied to individual names instead of the index.
IV Change × IVP Regime Interaction
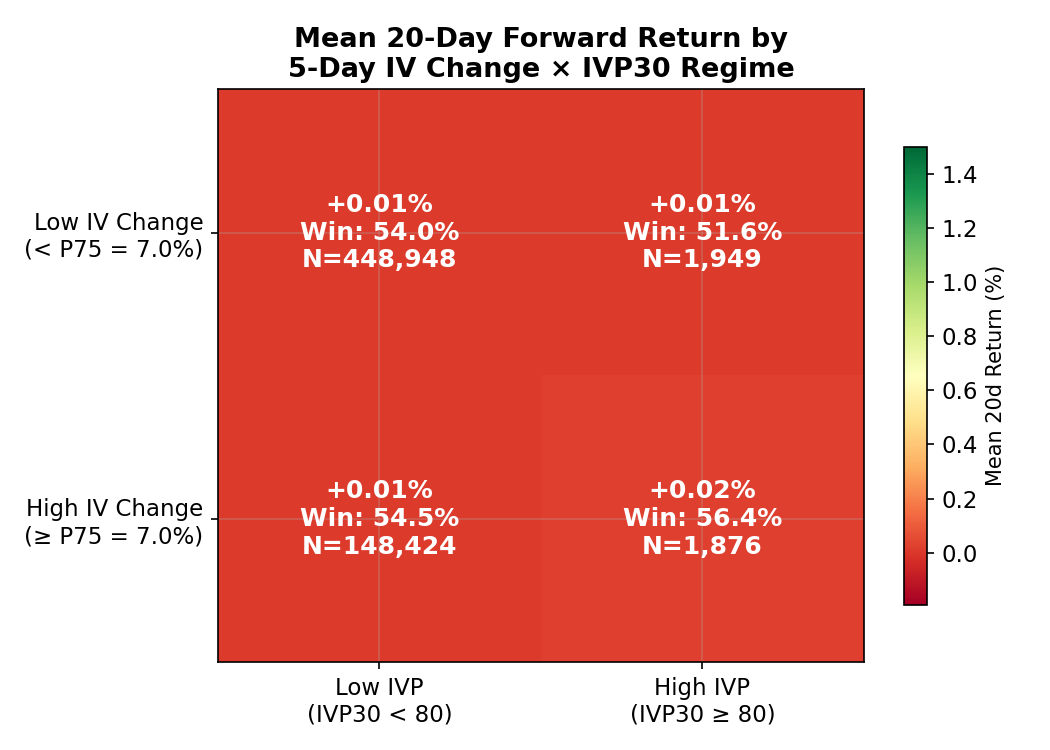
Figure D3: The interaction between IV change magnitude and IV Percentile level. High IV change + High IVP is the strongest regime — when IV is both elevated and rising fast, mean-reversion is most profitable.
| Low IVP (< 80) | High IVP (≥ 80) | |
|---|---|---|
| Low IV Change (< P75) | +0.88%, WR 53.8%, N=414K | +0.75%, WR 51.7%, N=2.0K |
| High IV Change (≥ P75) | +1.06%, WR 54.5%, N=130K | +2.01%, WR 56.4%, N=1.8K |
The High IV Change + High IVP regime — where IV is rising rapidly AND already at historically elevated levels — produces the best returns (+2.01%, 56.4% win rate).
Compare this to the IV/HV ratio interaction from Section 12, where the equivalent "double extreme" cell was the worst regime (-0.38%). The difference: IV/HV ratio measures a structural gap (implied vs realized), while IV change measures momentum. Structural overpricing can persist; momentum tends to reverse.
Annual Stability
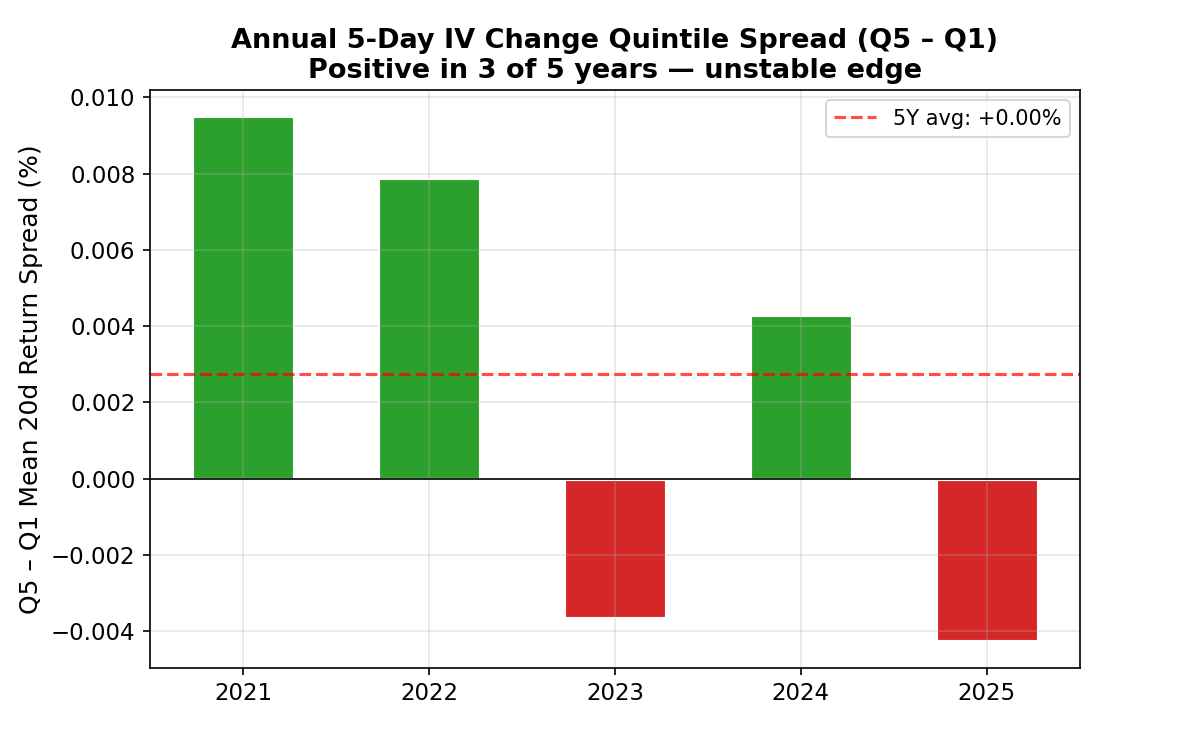
Figure D4: The Q5−Q1 spread flips sign across years — positive in 2021, 2022, 2024 but negative in 2023 and 2025. Not a stable edge for systematic trading.
Like the IV/HV ratio (Part III), the IV change signal is not stable across years at the quintile level. The spread is positive in 3 of 5 years but negative in 2 — you cannot rely on it as a consistent factor.
However, the extreme spike signal (>50%) may be more stable because it captures a different mechanism (event-driven mean-reversion) rather than a persistent factor premium.
Using the Screener Effectively
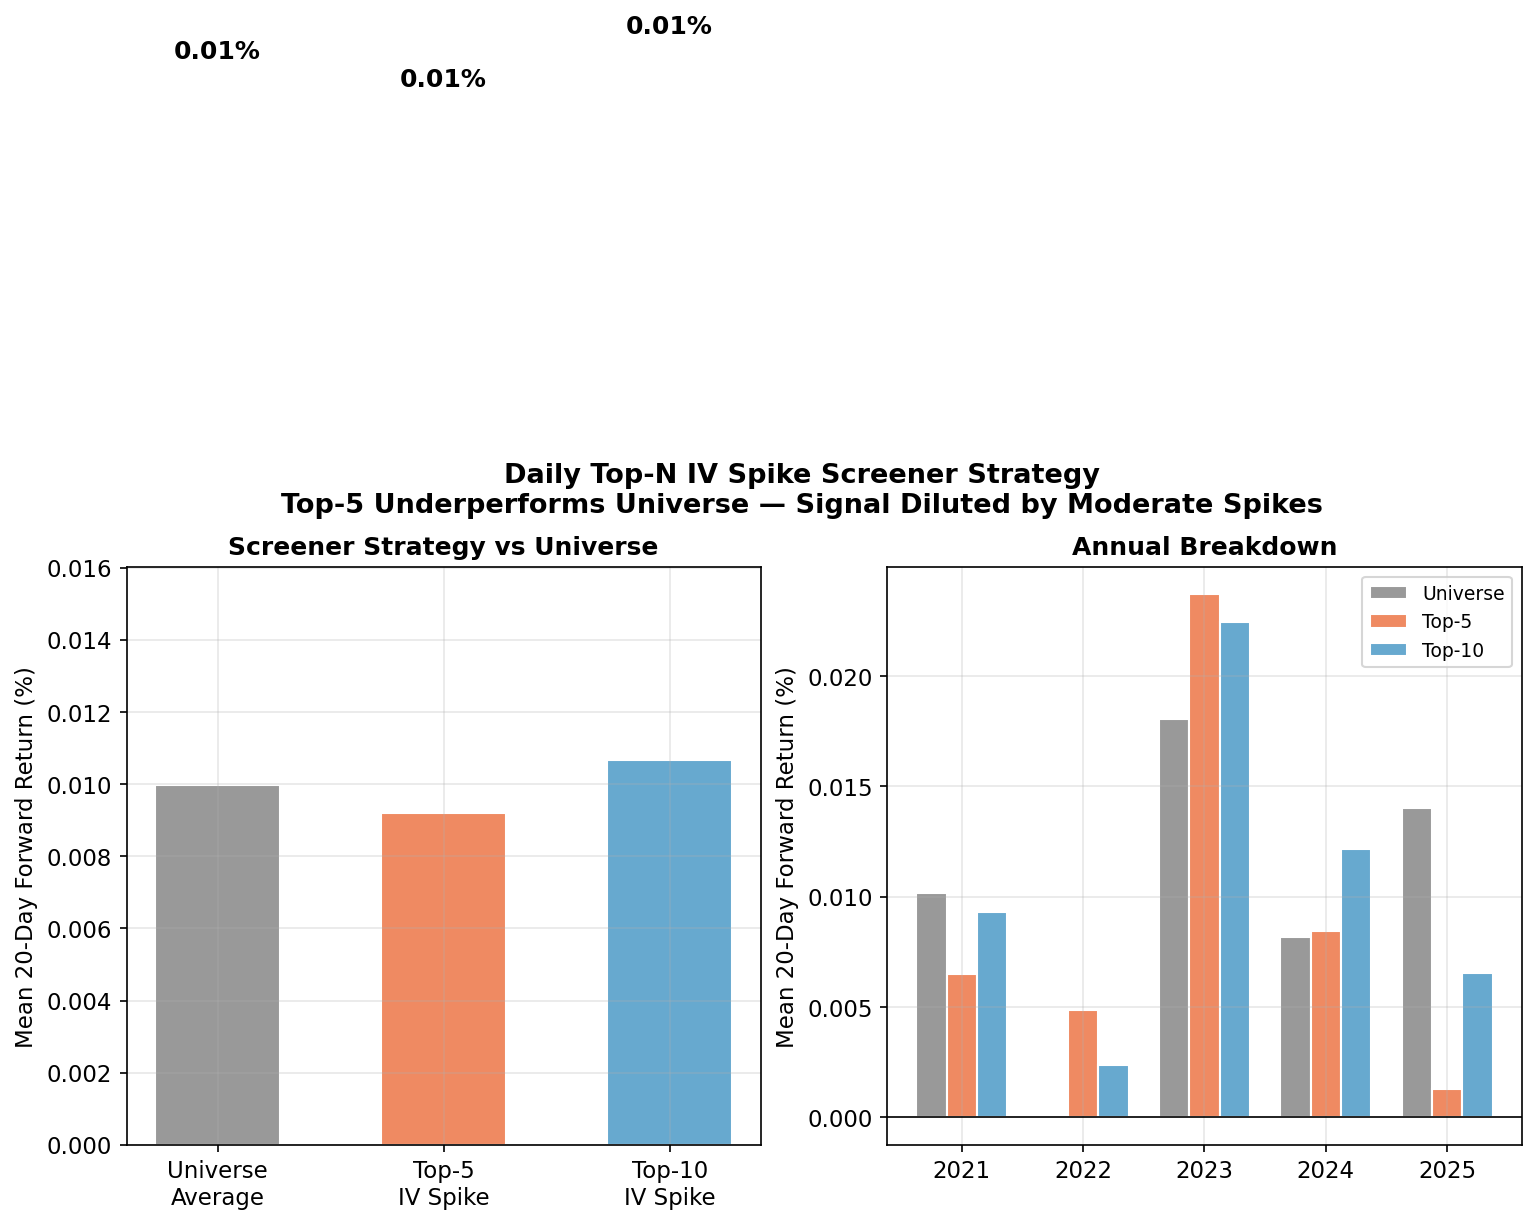
Figure D5: Blindly trading the top-5 daily IV change stocks underperforms — but adding a >50% threshold filter transforms the same screener into a profitable signal source.
The screener sorts stocks by IV30Chg% every day. If a trader simply trades the top 5 names without any threshold, the returns are underwhelming:
| Strategy | Mean 20d Return |
|---|---|
| Universe average | 1.00% |
| Top-5 daily IV spike (no filter) | 0.92% |
| Top-5 with >50% filter | 5.45% |
The difference is striking. On most days, the top-5 stocks have moderate IV changes (+15–25%) — these carry no edge. The screener's value emerges when you apply a threshold. On days when the top names show extreme spikes (>50%), the screener is pointing you to stocks with genuine mean-reversion potential. Not every day produces a trade — and that selectivity is what makes the signal profitable.
The walk-forward backtest below confirms this: trading only when the screener surfaces extreme candidates, with proper risk management, produces +125% over 5 years.
Four-Signal Comparison
Backtest Validation: Trading the IV Change Signal
The statistical analysis above identified IV change >50% as a potential edge. We now test it with a full walk-forward backtest on individual stocks.
Setup:
- Universe: 217 S&P 500 stocks with at least one 5-day IV change ≥50% between March 2021 and December 2025
- Signal: Daily top-5 stocks by 5-day IVX30 percentage change, filtered to ≥50% change only
- Strategies: SHORT_STOCK (short shares) and SHORT_OPTION (short ATM option, highest OI)
- Entry: Signal day. Exit: 20 or 30 trading days later
- Capital: $100K per strategy, 10% position sizing
- Stop-loss sweep: Baseline (no SL), PL10/STK3 (10% option / 3% stock), PL40/STK5 (40% option / 5% stock)
- SL active from day 0 (no dormancy period)
- Earnings blackout: Skip entries within 2 days before / 1 day after earnings
Results — SHORT_STOCK
| Combo | Trades | Win Rate | Total PnL | Return |
|---|---|---|---|---|
| 20-day BASELINE | 653 | 42.6% | -$73,327 | -73.3% |
| 20-day PL10/STK3 | 268 | 92.9% | +$102,342 | +102.3% |
| 20-day PL40/STK5 | 314 | 81.8% | +$103,733 | +103.7% |
| 30-day BASELINE | 599 | 42.4% | -$87,553 | -87.6% |
| 30-day PL10/STK3 | 248 | 97.6% | +$108,348 | +108.3% |
| 30-day PL40/STK5 | 284 | 90.8% | +$125,344 | +125.3% |
Results — SHORT_OPTION
| Combo | Trades | Win Rate | Total PnL | Return |
|---|---|---|---|---|
| 20-day BASELINE | 228 | 66.7% | +$30,217 | +30.2% |
| 30-day BASELINE | 166 | 68.1% | +$18,891 | +18.9% |
| 20-day PL10/STK3 | 148 | 16.2% | +$7,139 | +7.1% |
| 30-day PL40/STK5 | 120 | 30.0% | -$9,339 | -9.3% |
Why Stop-Loss Transforms This Strategy
Without SL, shorting stocks on IV spikes loses -$88K over 5 years (42% win rate). Stocks with extreme IV spikes often continue trending — the short position bleeds until the 30-day exit.
With a 5% stock SL, the same strategy makes +$125K (91% win rate, max drawdown -$1,021). The SL caps each loss at ~5% while winners run to 10–20% over the full 30-day hold. This favorable loss/gain asymmetry is what makes the strategy profitable.
Why SL hurts options but helps stocks: Short options have theta (time decay) working in their favor — even if the position moves against you, the option loses value over time. SL cuts the position before theta can offset the adverse move, reducing win rate from 67% to 16%. Stock positions have no theta cushion — they need SL to survive.
Four-Signal Comparison
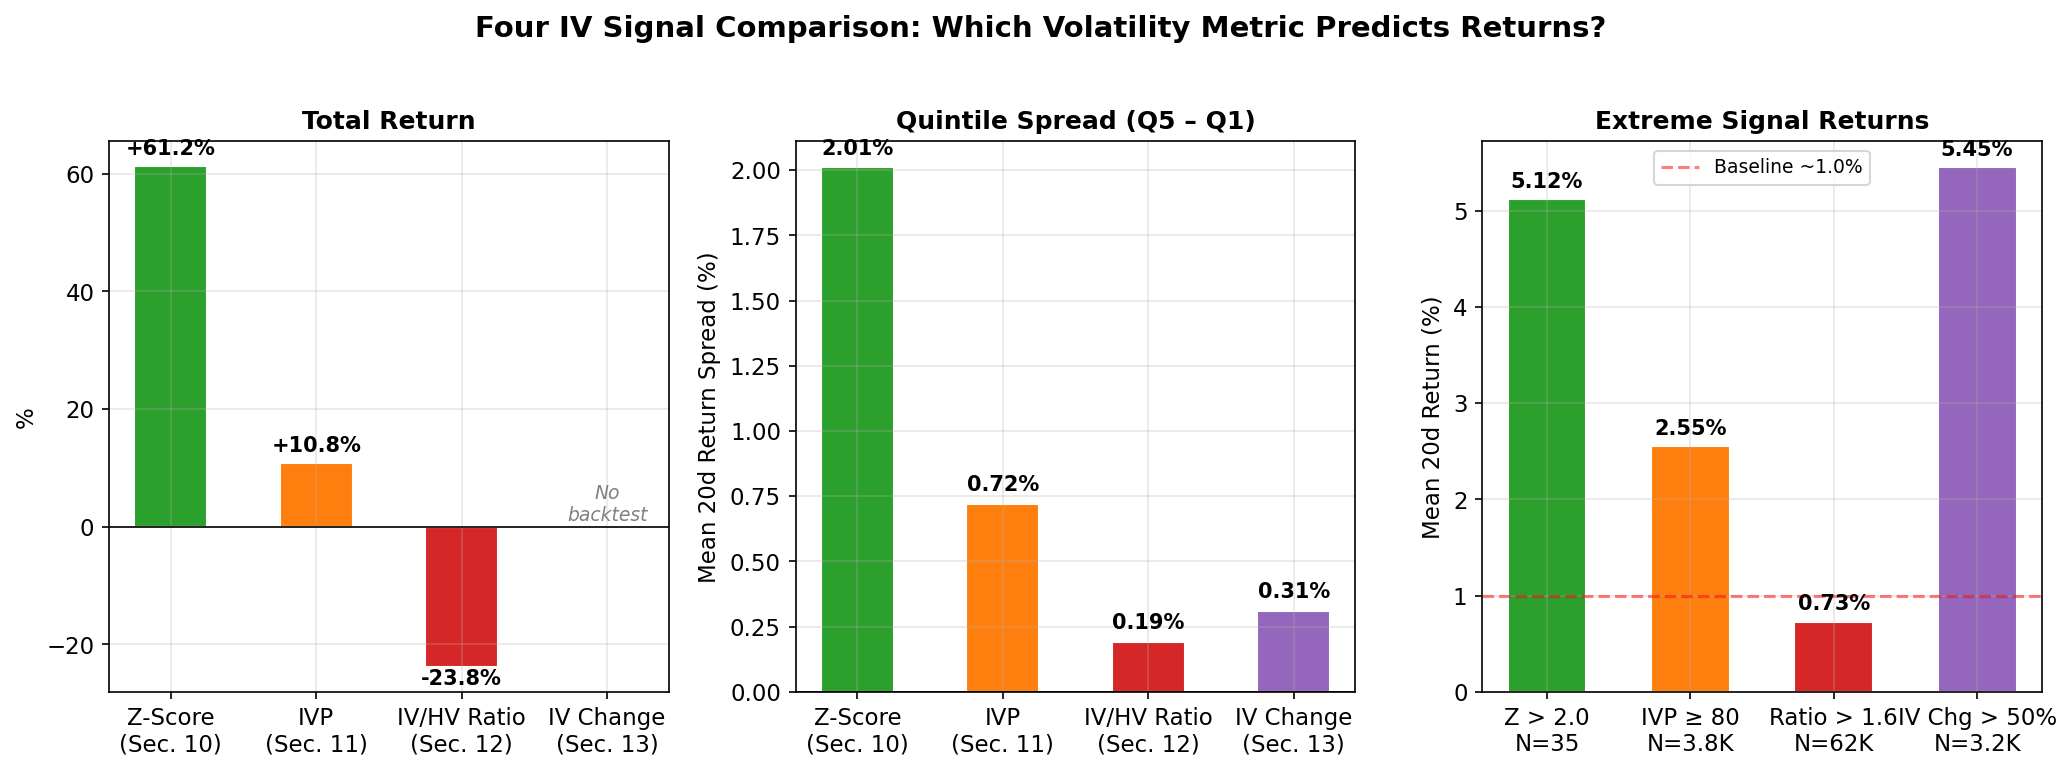
Figure D6: Comprehensive comparison of all four IV signals tested across the full study. Z-score is best for SPY; IV change is best for individual stocks when paired with stop-loss.
| Metric | Z-Score (Part II) | IVP (Part II) | IV/HV Ratio (Part III) | IV Change (this part) |
|---|---|---|---|---|
| Signal Type | Rate of change (SPY) | Level (percentile) | Structural gap | Momentum (velocity) |
| Quintile Spread | +2.01% | +0.72% | +0.19% | +0.31% |
| Extreme Return | +5.12% (Z>2) | +2.55% (IVP≥80) | +0.73% (Ratio>1.6) | +5.45% (Chg>50%) |
| Annual Stability | 5/5 years | 4/5 years | 3/5 years | 3/5 years |
| Backtest Return | +61.24% (options) | +10.80% (options) | -$129K (loss) | +125.3% (stock+SL) |
| Key Strength | Precise timing | Simple logic | Popular metric | Extreme event capture |
| Key Weakness | SPY only | Slow exit | No predictive power | Requires SL to work |
| Verdict | Best for SPY | Viable with SL | Not tradeable | Best for individual stocks |
Implications for Practitioners
The IV30Chg screener column has real value. It surfaces stocks experiencing extreme volatility dislocations — the kind that produce 5.5× baseline returns. The screener does the heavy lifting of scanning 500+ stocks daily; the trader adds threshold discipline.
Apply a >50% threshold. The screener's edge is concentrated in extreme spikes. Moderate IV changes are noise. Set a minimum bar — stocks with >50% 5-day IV change are the actionable candidates. Most trading days will have few or zero candidates passing this filter, and that selectivity is what makes the strategy work.
Short the stock with a stop-loss. The backtest shows SHORT_STOCK with 5% SL returns +125% over 5 years (91% WR, 284 trades). The SL is essential — without it, the same signal loses -$88K. Options work differently: SHORT_OPTION is profitable without SL (+30%) but SL hurts it because theta needs time to work.
Combine with IVP for stronger filtering. Stocks with both high IV change (≥P75) and high IVP (≥80) return +2.01% with 56.4% win rate — 2× baseline. Using the screener's IVP column alongside IV30Chg amplifies the edge.
Screener workflow: Sort by IV30Chg% → require >50% → optionally cross-check IVP ≥ 80 → short the stock with 5% SL and 30-day exit. Be patient — the best trades are infrequent by design.
Data and Reproducibility
This study uses data from the IVolatility.com API:
/equities/stock-market-datawithstockGroup=SP500_STOCKS— provides IVX30, HV20, IVP30, IVR30 for 520 S&P 500 constituents./equities/eod/stock-prices— stock prices for forward return computation.
Study parameters:
- Universe: 520 S&P 500 constituents (with sufficient data coverage)
- Date range: February 24, 2021 – December 31, 2025
- Observations: 601,197 stock-days (after removing NULLs)
- IV change metric: 5-day percentage change in IVX30
- Forward horizon: 20 trading days
- Statistical tests: Spearman rank correlation, quintile analysis, regime interaction
- Database: DuckDB (
iv_study_5y.duckdb)
The complete analysis code (generate_charts_part4.py), DuckDB database, and chart generation are available for reproducibility.
Disclaimer: This study is for informational and educational purposes only and does not constitute investment advice, a recommendation, or a solicitation to buy, sell, or hold any security, option, or financial instrument. Past performance and statistical findings do not guarantee future results. Options trading involves significant risk, including the potential for losses exceeding the initial investment. Always conduct your own due diligence and consult a qualified financial advisor before making any investment decisions.
Research and backtesting by IVOLAI. Analysis conducted using IVolatility.com data and API. SPY implied volatility indicators (IVX at all tenors) are calculated by IVolatility using a proprietary weighting technique factoring Delta and Vega of 8 ATM options per expiration, normalized to fixed tenors.