The Market May Be Weakening, But Think Twice Before Buying Long Puts
April 5, 2024
The Markets at a Glance
The Market is Weakening and VIX Moved Up to a Six-Month High
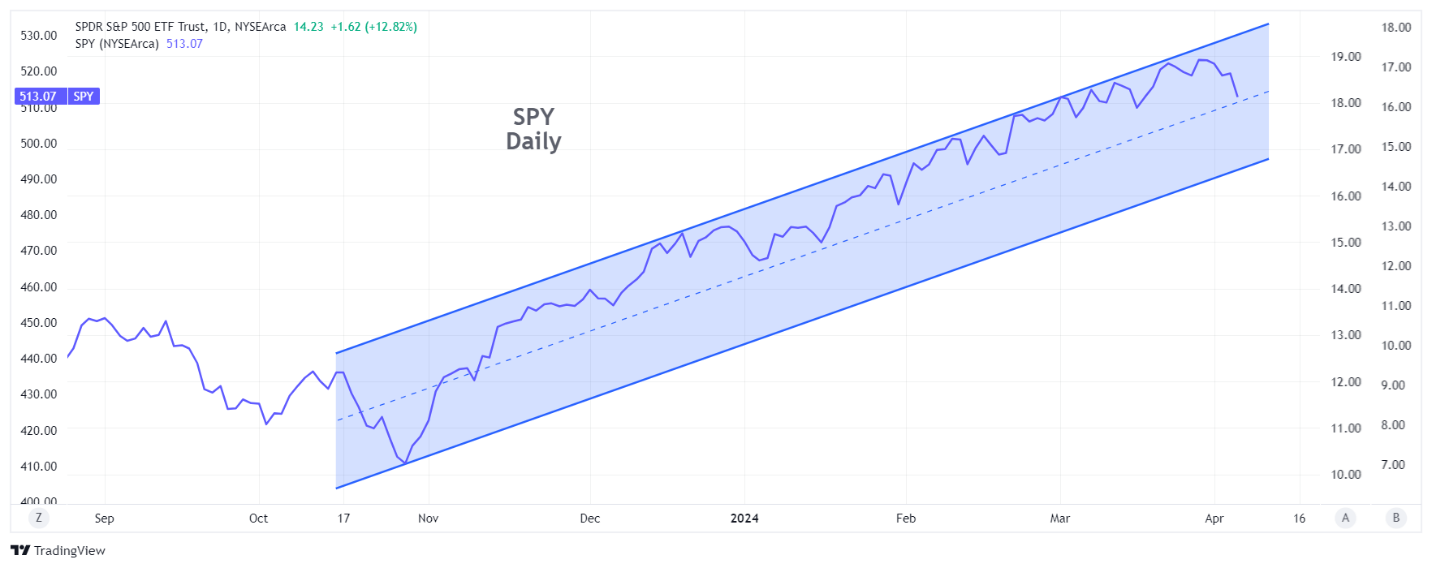
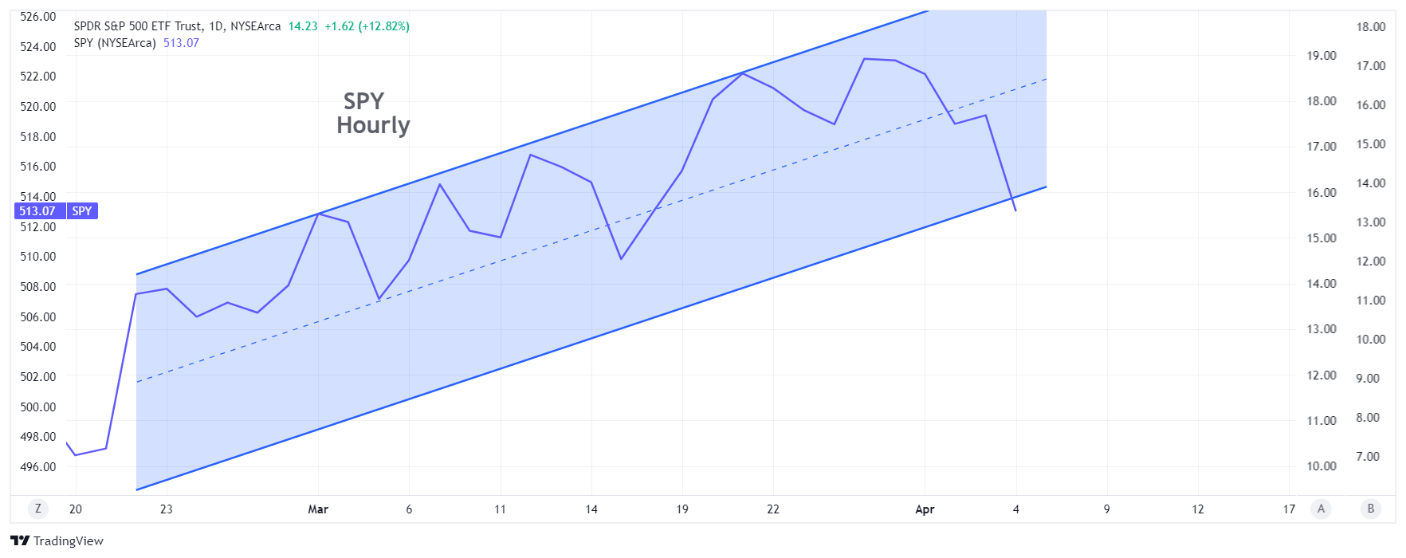
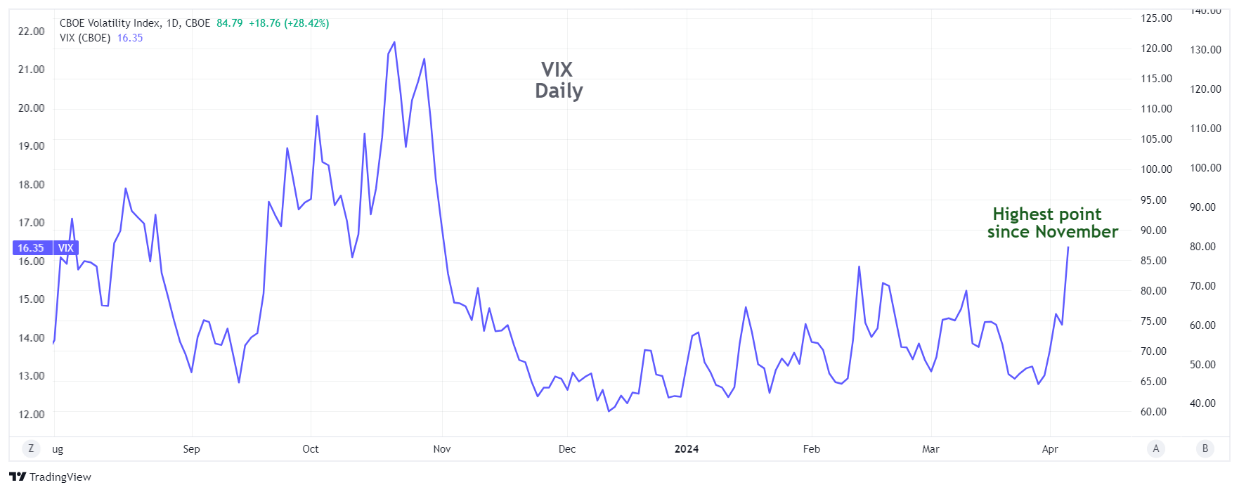
The six-month trend remains up on a daily chart, but an hourly chart shows the SPY and QQQ to be unable to make new highs this week and then dropping sharply today (Thursday). Accompanying the drop is a rise in VIX to 16.35 - the highest it has been since November 1st 2023. While a similar market move occurred in December, it was not associated with a VIX spike of this magnitude. So, while trend followers with a long-term horizon will view this as a normal action and not a break of trend, shorter-term players may be taking it more seriously as a precursor to a possible trend break soon.
The weakness in SPY (and similar weakness in QQQ) may simply be the early profit-taking of those who feel the market has built in the best expectations of a strong economy coupled with three expected rate cuts coming this summer. Or it may be a sign that institutions are happy to lock in as much of the 11% first quarter gains as possible by taking a few chips off the table. Either way, corrections and trend breaks often start out this way, picking up momentum when any additional news raises doubts on the expected scenario. In this case, that could mean the economy is weakening, inflation is worsening (or simply not going down as hoped), or that the rate cuts might be postponed.
For short-term traders, that could mean a change in option strategies. Binary thinking, however, might suggest a change from long calls to long puts, which would ignore an array of middle-ground options strategies that offer nuanced approaches like synthetic short stock positions, credit call spreads, put spreads, and collars.
Strategy talk: Think Twice before Buying Long Puts by Themselves
If the market is forming something of a trading top here, you might be starting to look at buying puts. It is rarely justified, however, to buy long puts by themselves, and it is usually only justified after-the-fact when the underlying had a substantial and unexpected move downward. Naturally a sharp downward move in a stock that occurs fairly quickly can produce a profit from a reasonably-priced put option, but a number of factors work against buying long puts on a regular basis:
• The cost of perpetual insurance from long puts is substantial. Taking AAPL as an example, the stock closed at 169.65 on Tuesday and the 30-day ATM put (170 strike) was selling at 4.70. That means there was 4.35 in time value. Taking that as an average amount of time value for 30 days of protection on the current price of APPL, over the course of a year, that would add up to 12 X 4.35, or 52.20, which is 30% of the price of the stock on an annualized basis. There are of course lower strike prices and longer time periods available, but this serves as a benchmark for seeing just how much it costs to protect a stock for continuous 30-day periods.
• Dips tend to recover faster than advances retreat. Investors lean much more toward buying dips in equity prices than to selling advances. This comes from behavioral science as well as the training of investors and professionals to continually hunt for attractive prices to purchase. Humans also tend to overreact to perceived bargains. This makes it more difficult to make a profit from put options as the window of opportunity to take profits will be smaller than with calls.
• By the time you decide to buy a put, the underlying has likely begun dropping and implied volatility is already likely elevated. This is especially true of situations where there are rumors of bad news or negative earnings. Buying puts when they are already elevated in price due to implied volatility simply adds to the cost mentioned above.
• Put options price in dividends more than calls. Put prices anticipate upcoming dividends by increasing in price as the dividend approaches, while calls tend to hold value better. Buying puts can thus be paying in part for an anticipated dividend.
• A put option is priced to address a move in its underlying from the strike price all the way to zero. But a trader is really only concerned about a small price drop most of the time. So, the long put by itself is paying for much more of a possible downward move than it needs to. Why not sell the risk below your target price to someone else?
If you were playing AAPL to drop from 170 to 165 within a week and you bought the 170 put mentioned above, you would be paying 4.70 and receiving approximately 6.40 in 7 days if the stock were then 165. That would be a gain of 1.70/4.70 or 36%. If instead, you purchased a 170/165 bear put spread, you would be putting up around $2.00 and receiving around $3.05 in 7 days, for a gain of 52%. In addition, you would begin making profit sooner and would have a wider range of stock prices in a week that would generate a profit.
This would all work the same way on an ETF such as SPY or QQQ. So, if you are thinking the market might roll over here and start correcting, restrain the urge to purchase an ATM put on either ETF. Instead, put on a bear put spread of some sort and then consider adding a credit call spread above the market to further reduce the cost of your position.
Got a question or a comment?
We're here to serve iVol users and we welcome your questions or feedback about the option strategies discussed in this newsletter. If there is something you would like us to address, we're always open to your suggestions. Use rhlehman@ivolatility.com.
Previous issues are located under the News tab on our website.