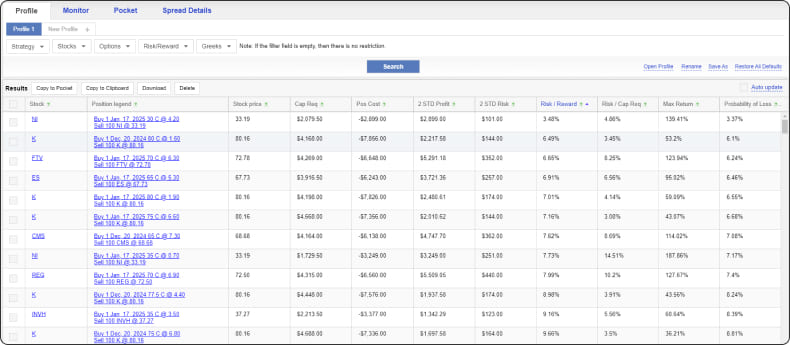
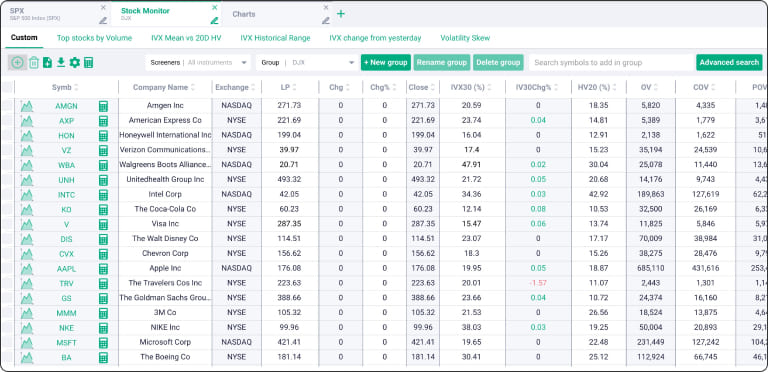
Your groups, your stocks, your portfolios—all in one place. Create groups of stocks
you're interested in, choose the data columns you need, and let IVolLive create a grid for
your easy interpretation and comparison of data. With over 100 data fields to choose from,
the Stock Monitor brings big data analytics to the masses. A rare feature from data vendors,
the Stock Monitor allows you to download the grid you created in CSV form for import into
Excel, or your preferred data platform, for additional analysis.
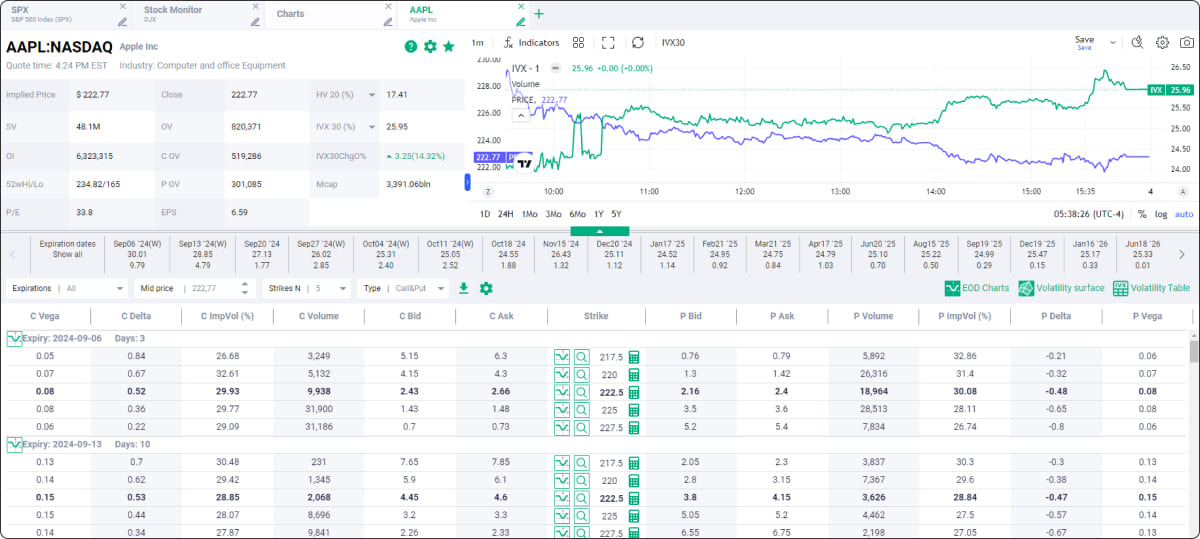
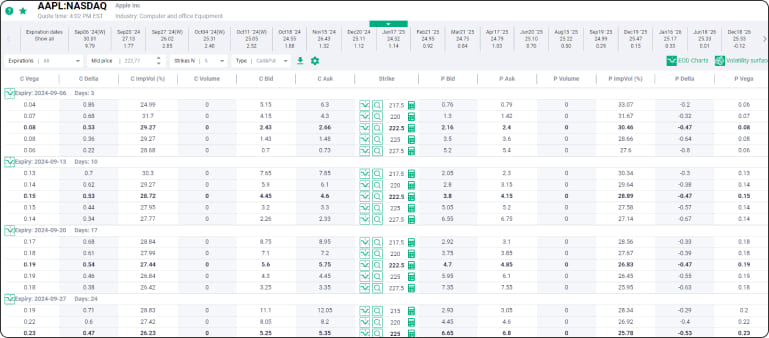
The original options chain for options traders, our popular Advanced Options service has
provided contract level IV data and charts to traders for over 15 years. In IVolLive,
we've redesigned our Options Chain to fit more data into less space, while still
ensuring easy interpretation through a simple and modern design. We've added data fields
and gave you the power to choose columns to create an options chain with the data you
need, and nothing more. As always, you can download the full options chain for
additional analysis or for your records. Our options chain also offers a number of
useful charts: time skew, strike skew, delta charts, and more!
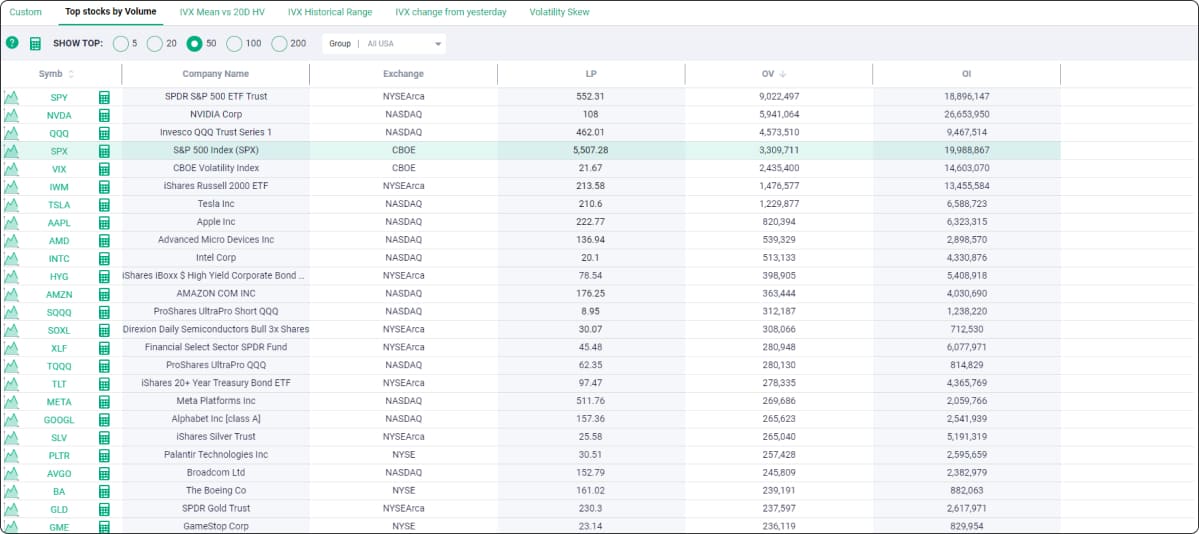
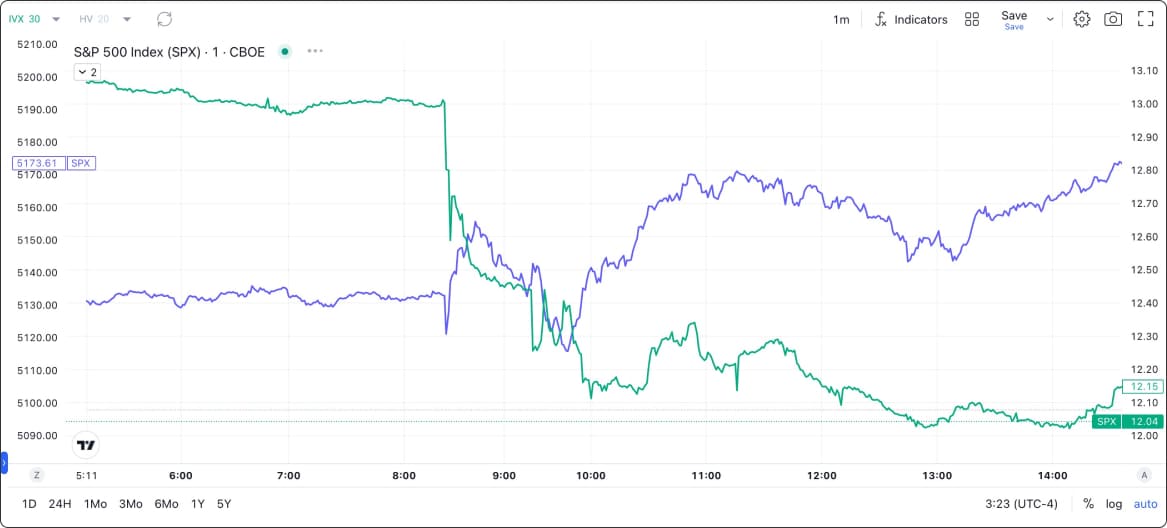
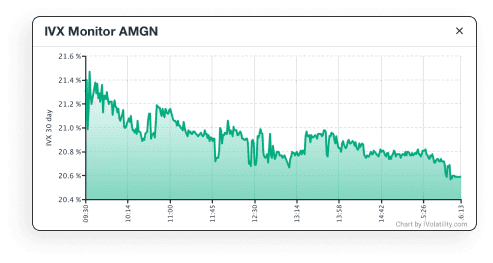
If you want to quickly check implied volatility for any stock or index, the IVX Monitor
is for you. Available on our homepage for a limited number of the most popular names,
the IVX Monitor gets a full revamp and incorporation into our IVolLive platform. Now you
can see the IVX chart for any name easily in our Stock Monitor, just click on the chart
icon next to any ticker and the IVX chart will immediately pop up!
Originally designed in collaboration with Fidelity and TradeKings (now Ally Investments),
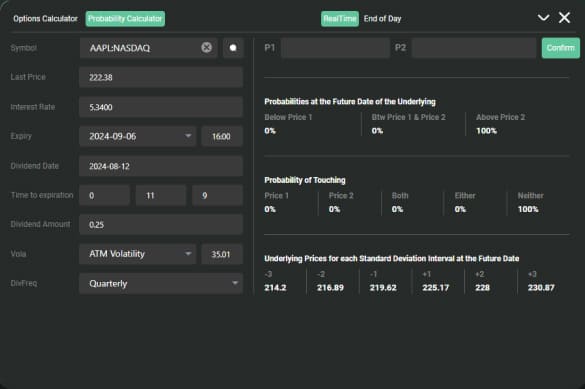
our original Probability Calculator disrupted the options scene for retail traders. No
longer was professional volatility-based forecasting limited to professional investors. All
you had to do was select a two target prices and our calculator would return the probability
with which the contract was likely to touch those targets before expiration as well as the
probability with which the contract was likely to end above, between, and below your two
target prices. Now, we've adjusted our methodology slightly as more data has become
available, and added new fields: the probability of touching for either target, neither
target, and both targets. And of course, we've made the calculator more compact, while still
easy on the eyes for all traders.
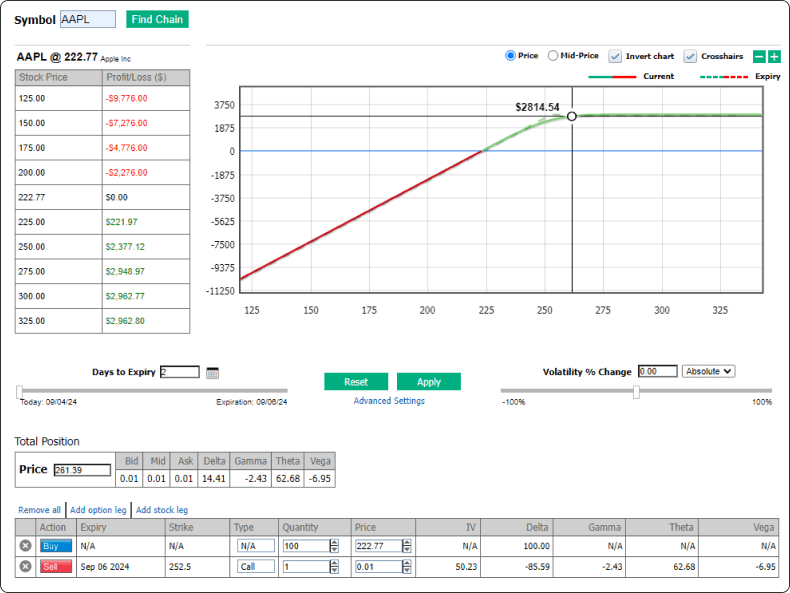
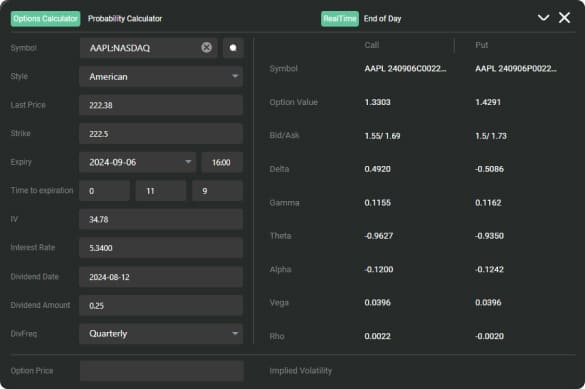
Options Calculator provides tools only available for professionals - fair values and Greeks
of any option using our volatility data and prices. You can customize all the input
parameters (option style, price of the underlying instrument, strike, expiration, implied
volatility, interest rate and dividends data) or use the IVolatility.com database to
populate all those fields for you! The Calculator can also be used to calculate implied
volatility for a specific option - the option price is a parameter in this case.
Intraday price action and IV analytics for every options contract. Day traders, looking to
evaluate opportunities around intraday option trades will find this tool incredibly useful
to perform quick visual backtests. You can rapidly backtest ideas by visualizing an option
contract's price and IV action throughout the day with minute-by-minute data, comparing your
hypotheses about options prices through the day against empirical data. For the first time,
take a data-driven approach to intraday strategies that were once only available to the best
resourced equity derivatives desks.
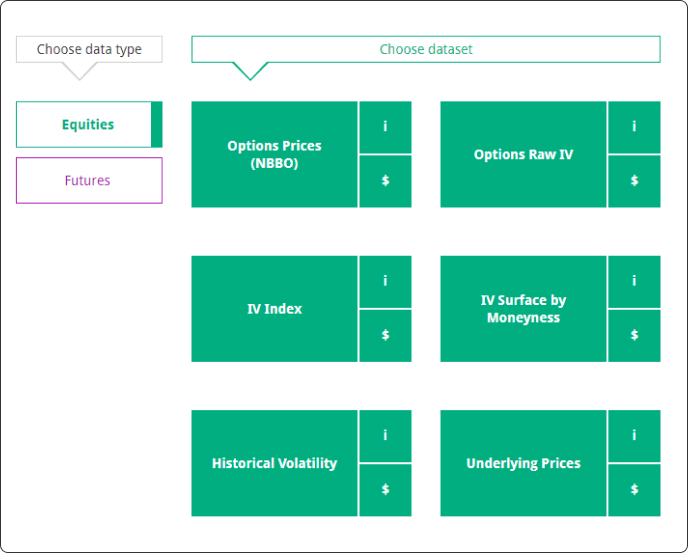
Visualize all our datasets with powerful charts. From options open interest to normalized
historical volatility surfaces and many more, we are able to provide you with invaluable
information to help you plan your trades in the best possible conditions.