IVolLive
Professional-grade tools for the options trader: charts, option chains, scanners, risk analysis and more
Join IVolLive and get instant access to:
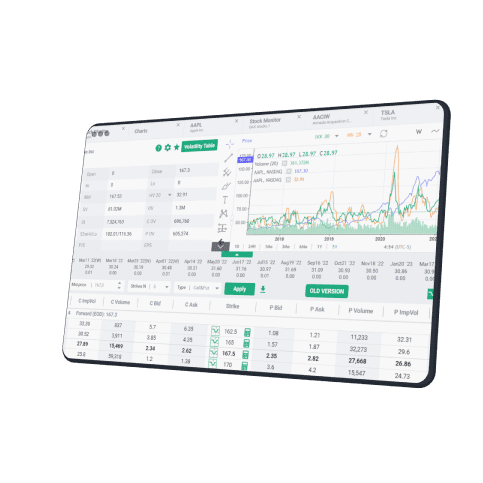
Advance Charts
Visualize all our datasets with powerful charts. From options open
interest to normalized historical volatility surfaces and many more,
we are able to provide you with invaluable information to help you
plan your trades in the best possible conditions.
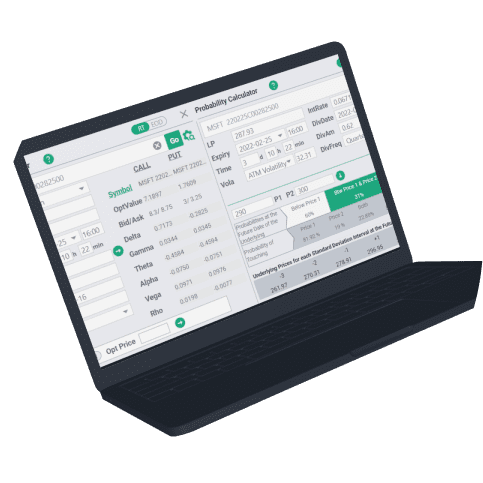
Options & Probability calculators
Let us help you use the intelligence of the market to your advantage with our advanced calculators.
Want to understand how the parameters of a call or a put will change a the inputs change, the options calculator has all the information you need!
Want to calculate the probability of the market hitting a certain level or even closing below a specified level by a certain date pay a quick visit to our probability calculator.
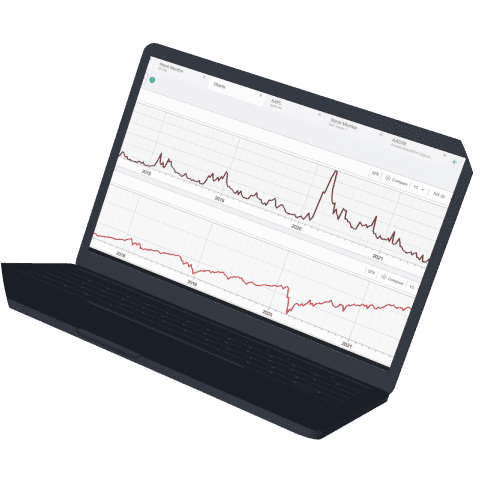
Intraday & Historical Volatility
Using our proprietary IV-Index (IVX) we help you visualize how
implied volatility evolves during the trading session for all the
ETFs, Indices and Stocks available.
Whether it is because you want to optimize your trade execution, to find new entry points for directional trading or simply to follow the volatility market, seeing changes in real time during the day can help you gain an edge.
Looking for long time series on volatility? We've got you covered with data going back more than 10 years on multiple underliers.
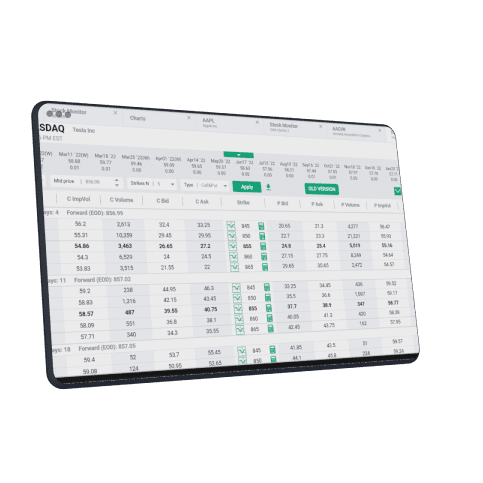
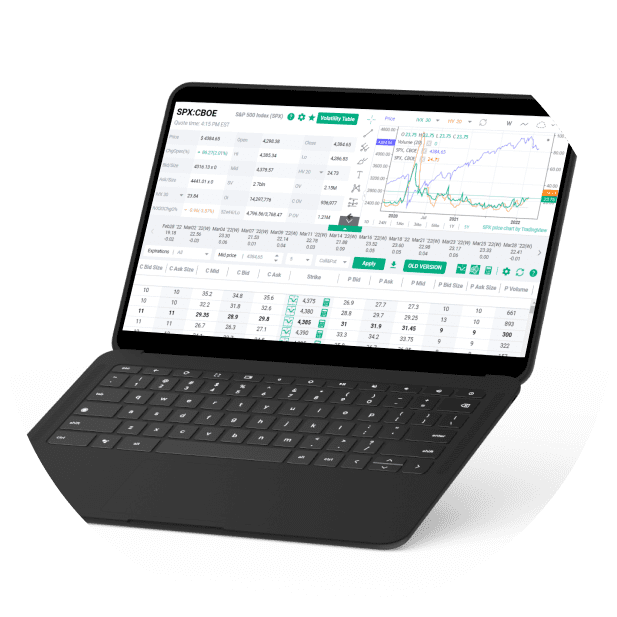
Best in Class Options Chain with Greeks
Dig into our professional option chain and stand ready to trade.
With the IVolLive option chain, you will get an in depth understanding of volatility for each expiration and strike including current levels and changes. Use the Greeks to prepare your trades.
With the IVolLive option chain, you will get an in depth understanding of volatility for each expiration and strike including current levels and changes. Use the Greeks to prepare your trades.
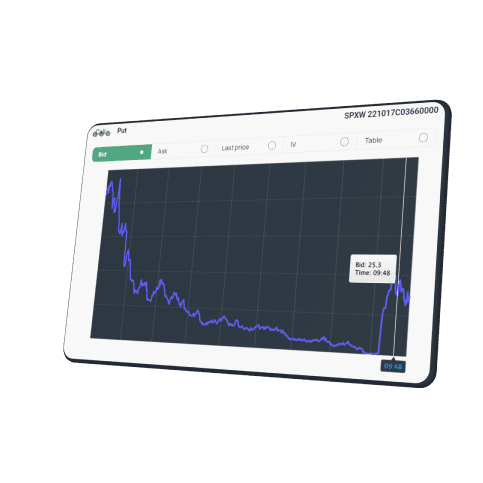
Intraday price action and IV analytics for every options contract
Day traders, looking to evaluate opportunities around intraday
option trades will find this tool incredibly useful to perform quick
visual backtests. You can rapidly backtest ideas by visualizing an
option contract's price and IV action throughout the day with
minute-by-minute data, comparing your hypotheses about options
prices through the day against empirical data. For the first time,
take a data-driven approach to intraday strategies that were once
only available to the best resourced equity derivatives desks.
A powerful Options Scanner
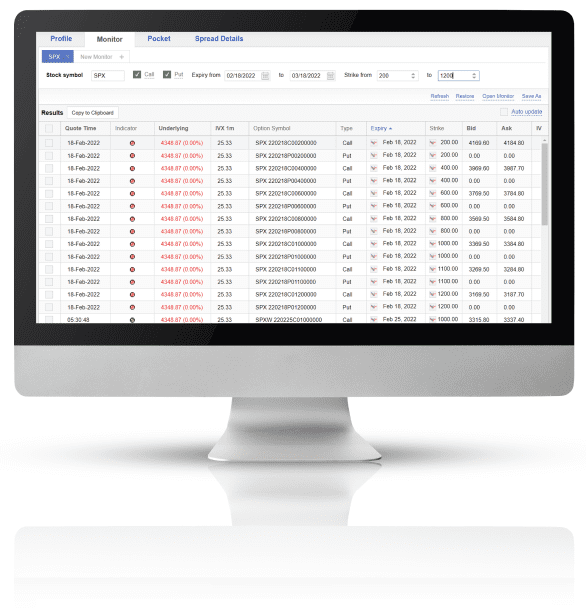
Want to search for the most attractive strategies available? With our
scanners, set the criteria and retrieve the best available trades in
real-time based on your specific objective.
Whether you are looking for trades with the highest probability of making a profit, or those offering the best Risk/Reward ratio, we have got you covered.
Whether you are looking for trades with the highest probability of making a profit, or those offering the best Risk/Reward ratio, we have got you covered.
Trusted by the World's Top Investment Banks
For more than 20 years, we have been providing derivatives market
leaders with options and futures data.
Our team of data scientists apply powerful, refined, and well-tested calculations to millions of financial instruments every day, creating big data insights used across the industry to create options strategies, find actionable options contracts, and analyze existing positions.
Our historical options data is an industry leader in financial data, providing consistent, accurate insights you won't find elsewhere. IVolLive allows you to access the same present and historical options data used by over half of the top 50 Investment Banks and over half of the top 30 derivatives funds to build strategies which can compete in the 21st century.
Monthly
Yearly
Pro Realtime
$150/month
Billed monthly, individual use
IVolLive Platform
Stock Monitor
Realtime
Options Chain
Realtime
IVX Monitor
Realtime
Probability Calculator
Realtime
Options Calculator
Realtime
Contract Viewer
Realtime
Charts
Realtime
Sentiment Analyzer
EOD
Spread Scanner
Realtime
PnL Calculator
Delayed
Data Download
EOD
include 80$/month credit
Advanced
$60/month
Billed monthly, individual use
IVolLive Platform
Stock Monitor
Delayed
Options Chain
Delayed
IVX Monitor
Delayed
Probability Calculator
Delayed
Options Calculator
Delayed
Contract Viewer
Delayed
Charts
Delayed
Sentiment Analyzer
EOD
Spread Scanner
Delayed
PnL Calculator
Delayed
Data Download
EOD
include 25$/month credit
For personal non professional single use
For professional use, please contact sales@ivolatility.com to discuss professional license arrangement to use Services. Terms of use are available here.
Ready to get started?
Get Free Trial