We offer multiple professional grade services to help you gain insight on volatility trading. Do not hesitate to try our products FOR FREE by clicking HERE |
Market Update: 2022-02-16 |
Risk assets caught a strong bid on the back of deflating geopolitical tensions in Eastern Europe. The NDX led the charge up 2.5% on the day with the SPX up 1.5% and the DOW up 1.25%. In Europe, headline indices managed to catch a strong bid as well with the German DAX up almost 2%. |
As a result of that global appetite for risk assets, implied volatilities were marked lower across the board. The NDX 30d IV was down around 3.5 points, and for the SPX and the DOW, 30d IV was down around 2.5 points on the day. |
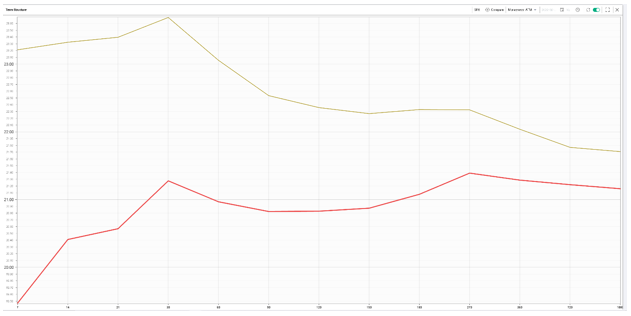
The easing of risk was also visible across the entire curve for all indices. Below we show the comparison of the term structure for the SPX on the 14th Feb’22 (Monday in Yellow) and the 15th Feb’22 (Tuesday–Red). |
|
The 7 days IVX was actually around 4 points lower and closed below 20. The curve is also upward slopping up to the 30 days bucket and relatively flat afterwards compared to being properly inverted from 30 days onwards on Monday. |
This does not mean that all risks are off the table but it shows that the attention is now shifting from a perceived overnight or very short-term risk (Ukraine/Russia tensions escalating) to a more medium term one most likely in the form of the FED and other central banks having to be more proactive in stemming inflation. |
If the general mood is more positive around short-term risks, it is worth noting that options traders remain very cautious. Looking at the skew for the March maturity for the SPX shows that the volatility level asked for downside protection is very elevated compared to at the money or even upside scenarios. |
For instance, if the 4500 options in March are trading around 20%, the 4350 puts are around 24.3% and the 4150 puts are almost 29%. |
|
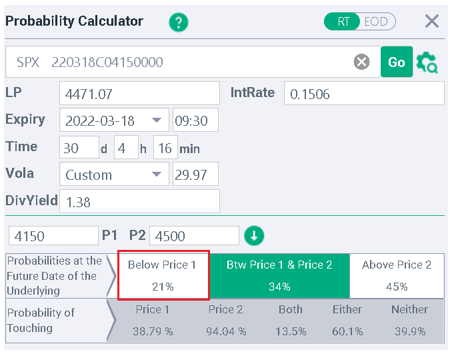
Using the probability calculator, we are able to convert those metrics into estimated theoretical probabilities. With the current IV from the 4150 strikes, we find that the market is still assigning around 21% chance of closing below 4150 by the March expiration and an almost 40% probability of trading 4150 by the 3rd Friday of March. |
|
Sector wise, Tuesday saw an almost symmetrical move to what happened on Monday. The XLE (Energy) was the worst performing index as Crude Oil was offered on the relief rally in risk assets. The ETF finished the day down around 1% and 30d IV was remarked 2.5 points lower. On the upside the XLY (consumer discretionary) was up around 2.25% and 30d IV dropped around 4.5 points on the day. |
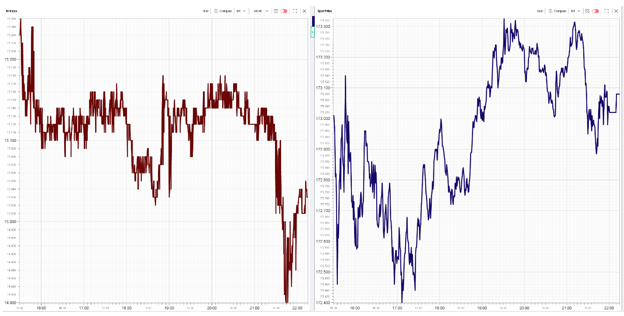
In commodities, both spot prices and implied volatilities were offered in GLD (Gold ETF) for the day, an interesting divergence possibly explained by the reduced tensions in Eastern Europe. |
|
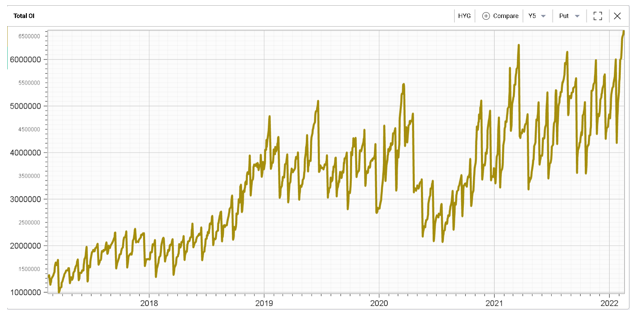
In credit, we discussed a few days ago the large increase in open interest for the HYG (High Yield ETF) as the market seemed to become more worried about credit risk again. That trend does not seem to be abating as exhibited by the below chart |
|
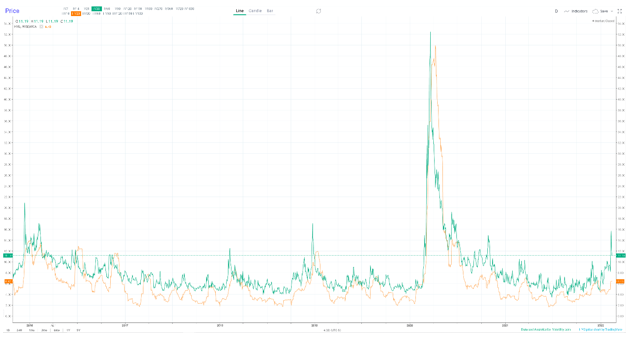
Although implied volatilities deflated over the past few days, 30 days IVX in HYG not only remains relatively elevated compared to its own history but particularly stands out when compared with its recent realized volatility. |
|
| Disclaimer - This information is provided for general information and marketing purposes only. The content of the presentation does not constitute investment advice or a recommendation. IVolatility.com and its partners do not guarantee that this information is error free. The data shown in this presentation are not necessarily real time data. IVolatility.com and its partners will not be liable for any loss or damage, including without limitation, any loss of profit, which may arise directly or indirectly from the use or reliance on the information. When trading, you should consider whether you can afford to take the high risk of losing your money. You should not make decisions that are only based on the information provided in this video. Please be aware that information and research based on historical data or performance do not guarantee future performance or results. Past performance is not necessarily indicative of future results, and any person acting on this information does so entirely at their own risk. |