We offer multiple professional grade services to help you gain insight on volatility trading. Do not hesitate to try our products FOR FREE by clicking HERE |
The Market Update is a daily newsletter written by the team at iVolatility.com. Leveraging our analytics and data we are able to update you on key developments in the volatility market. To receive the Market Update directly into your inbox, please open a free account or visit our SITE where it is published every day. |
Market Update |
“We are going nowhere very fast” is probably an accurate description of how this week has felt so far judging by the performance of headline indices. |
Thursday saw a reversal of the positive performance of Tuesday and Wednesday and the NDX closed at its weekly lows made Monday. |
Trading the sentiment and the headlines around the Ukraine/Russia conflict is draining for traders and forces a broader reevaluation of the current situation in the market. |
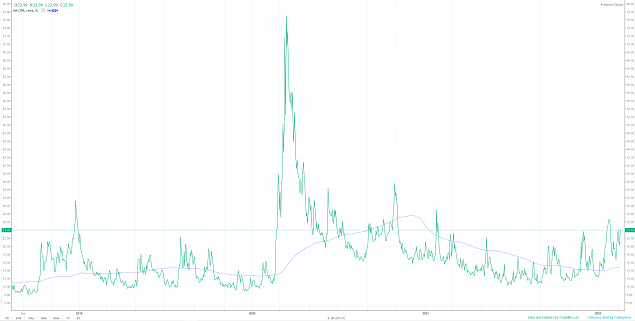
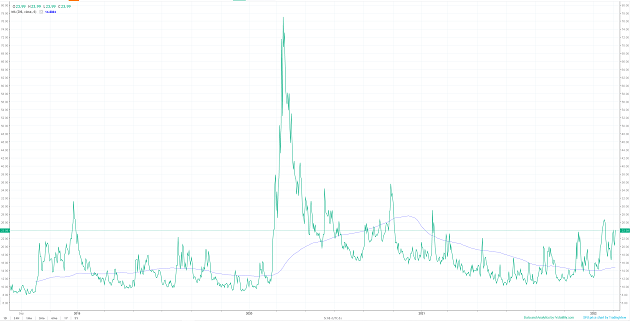
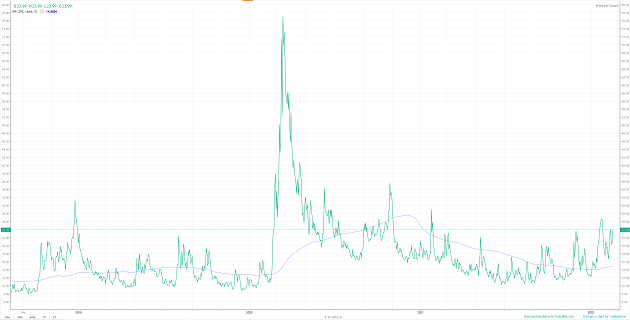
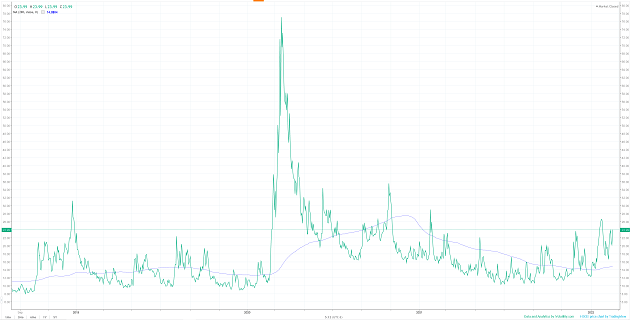
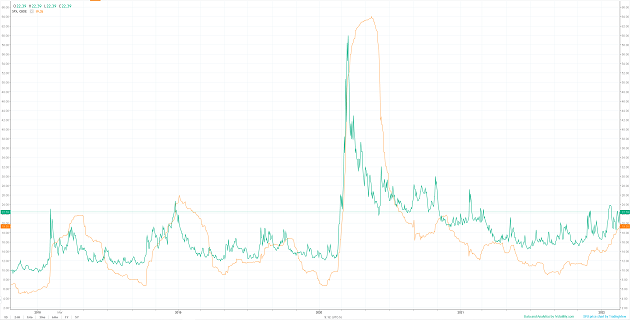
First, implied volatilities continue to trade above their long-term average, measured here by the 200d MA on 30d IV. We pointed out in previous Market Updates that this phenomenon had been in place since the end of 2021 and marked the end of the period of IV relaxation that followed the large spike around the pandemic. |
NDX 30d IV vs 200d MA |
SPX 30d IV vs 200d MA |
|
German DAX 30d IV vs 200d MA |
Chinese HSCEI 30d IV vs 200d MA |
The above charts show that this phenomenon is happening for pretty much all major indices. |
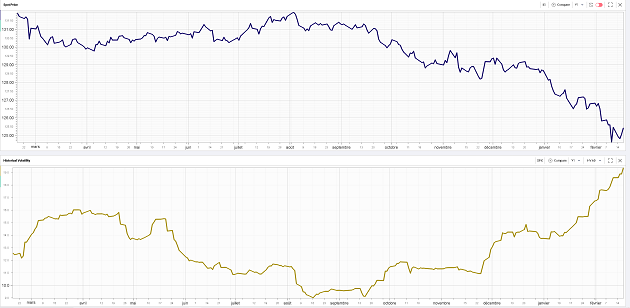
This increase in implied volatilities has been first and foremost driven by an increase in realized volatility. The below chart shows in green the 120d implied volatility compared with the 60d realized volatility. We can see that realized volatility actually started to pickup around Q3 of 2021 and has continued to increase ever since. |
|
The increase in volatility driven by a higher realized volatility is partly linked to the greater difficulty that market participants face when trying to value risk assets. This also shows that to some degree, market participants are finding more and more reasons to disagree about the fair value of equities triggering large waves of repricing both on the upside as well as on the downside. This contrasts with the apparent consensus that we have known for the past 18-24 months where pretty much all market participants agreed that owning equities was the way to go, a phenomenon that helped keep realized volatility in check for the best part of 2021. |
The increase in short dated rates that started at the end of 2021 is part of the reasons for that greater difficulty to assess if risk assets are cheap or rich. Using the ETF IEI (3–7 years Treasuries) and comparing it to the 60 days realized volatility on the SPX, we can see that those are related in a way that most likely goes beyond just pure coincidence. |
|
Other factors are obviously at play such as the tensions in Eastern Europe but uncertainty around the future of the FED and major global central banks policy plays a significant role on the mood of investors. |
The Fixed Income market is now expecting around 6 rate hikes for 2022 compared to around 50% chance of no hike for the entire of 2022 back in September 2021. From that perspective, it is fair to say that some significant repricing has already happened. Furthermore, increased uncertainty stemming from other causes has also proved to be a stabilizer for rates as investors piled into safe heavens. |
As a result, rates will probably continue to play an important role for the equity market and should remain on investors radar. If the FED sends signals that it is willing to consider scenarios that go even beyond the current pricing from the market, volatility could continue to increase. On the other hand, if the FED sees the current pricing as being in line or even excessive relative to its own projections and rates to stabilize or even drop slightly, volatility could move lower. |
In all instances, it is quite possible that most of the action for this year will continue to happen at the single stock level rather than at the index level. This was one of the points we made a few days ago when we addressed the active vs passive investing discussion. |
Looking at the DOW yesterday shows the high dispersion within the index with names like KO, WMT and CSCO finishing the day up more than 2% while stocks like GS, CAT or CRM were down more than 3.5%. |
This should encourage investors to study the stories that they like and find most interesting. Furthermore, a marked focused on single stocks may open far greater opportunities for both spot and volatilities than a macro driven market. |
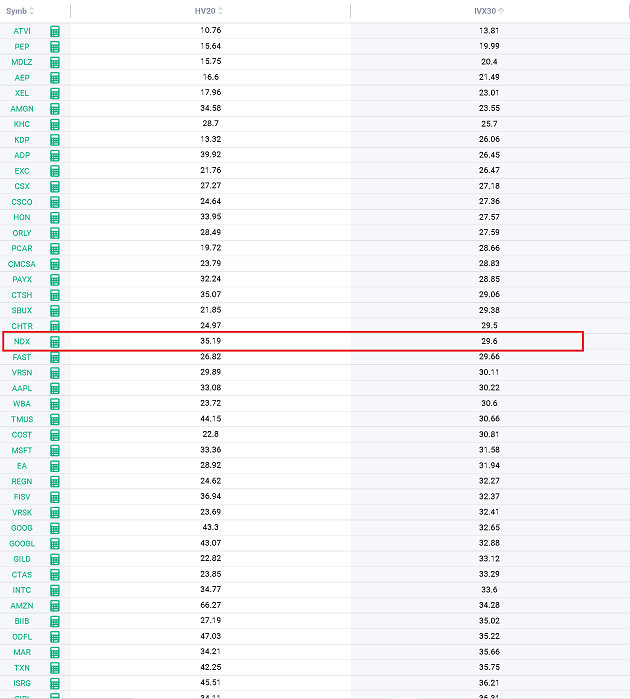
Using the Stock Monitor, we can find quite a few stocks where 30d IV trades below the NDX despite having a 20d HV that is higher than that of the index. We can also identify some names where 30d IV is greater than NDX’s with HV that is lower. Each of those stories may well explain the underlying reasons for that phenomenon and we would need to dig into far greater details to be able to express a view on the richness or cheapness of those volatilities but they do provide some food for thoughts for anyone interested in trading single stock volatility. |
|
| Disclaimer - This information is provided for general information and marketing purposes only. The content of the presentation does not constitute investment advice or a recommendation. IVolatility.com and its partners do not guarantee that this information is error free. The data shown in this presentation are not necessarily real time data. IVolatility.com and its partners will not be liable for any loss or damage, including without limitation, any loss of profit, which may arise directly or indirectly from the use or reliance on the information. When trading, you should consider whether you can afford to take the high risk of losing your money. You should not make decisions that are only based on the information provided in this video. Please be aware that information and research based on historical data or performance do not guarantee future performance or results. Past performance is not necessarily indicative of future results, and any person acting on this information does so entirely at their own risk. |