We offer multiple professional grade services to help you gain insight on volatility trading. Do not hesitate to try our products FOR FREE by clicking HERE |
The Market Update is a daily newsletter written by the team at iVolatility.com. Leveraging our analytics and data we are able to update you on key developments in the volatility market. To receive the Market Update directly into your inbox, please open a free account or visit our SITE where it is published every day. |
Market Update: 2022-02-19 |
Despite the flurry of negative headlines, equity markets have remained surprisingly resilient so far. The SPX finished the day down 0.7% and the NDX closed about 1.1% lower. In Europe, the German DAX closed about 1.5% lower while the French CAC outperformed closing down 0.25% for the final session of the week. |
In the United States, the worst performing sector was the Technology space closing down around 1% while Consumer Staples managed to close 0.2% higher for the day. |
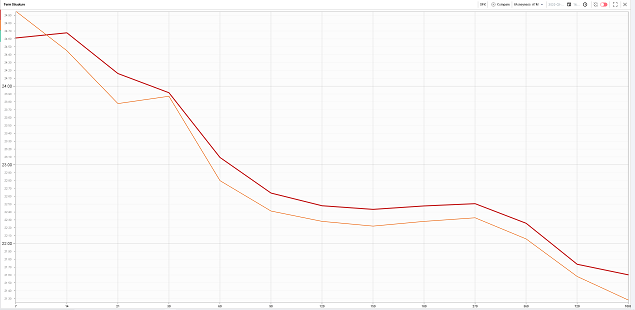
The low realized volatilities for the day put a lid on implied volatilities remarks and the NDX curve parallel shifted higher by around 25 bps in line with the SPX. Overall it was a pretty underwhelming move given the level of worry and tension that exists in the market at the moment. |
Term Structure for the SPX – Friday 19th Feb’22 in red – Thursday 18th Feb’22 in orange |
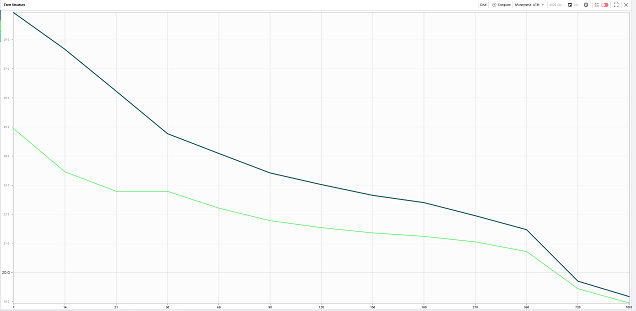
In Europe, implied volatilities outperformed, helped by the late day selloff in US indices that happened Thursday after the EU close. DAX 30d and 60d are up about 2 points while 1y IV is up around 0.8 points on the day. |
Term Structure for the DAX – 19th Feb’22 in blue – 18th Feb’22 in green |
Beyond the obvious geopolitical developments, next week will also see BABA reporting earnings on Thursday. The vol market has been gearing up for a potential large move on earnings with short dated IV trading around 20 points higher than 3 months IV. |
|
As a result, the 120 calls in the name with expiration 25th Feb’22 were priced at 4.7 (mid-market price) on Friday against a spot price of around $119. In comparison, the regular 18th Mar’22 120 calls were priced at 7.85 and the 17th Jun’22 calls were worth 14.35. Put simply, about 33% of the value of the June 120 calls comes from next weeks earnings. |
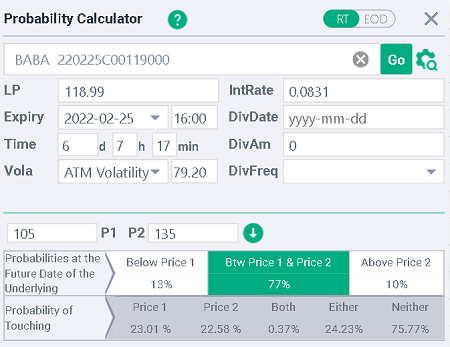
Looking at our probability calculator, we can see that the market is assigning a theoretical probability of around 13% that the stock will close below 105 by Friday next week’s close and around 10% that the stock will finish above 135. |
|
Looking in our Options chain, we can see that the 105 puts in BABA with expiration 25th Feb’22 were worth around 1.1, while the 135 calls were priced at 0.66 giving traders a potential 1.4% reward provided that BABA does not finish down more than 12% on the week or up more than 13.5%, a scenario carrying a theoretical probability of around 77% according to our calculator. |
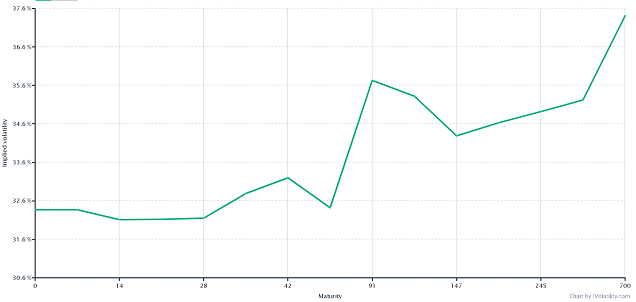
Friday also saw INTC spot price reach its lowest level since October 2020. The chipmaker closed down more than 5% on the back of its guidance. |
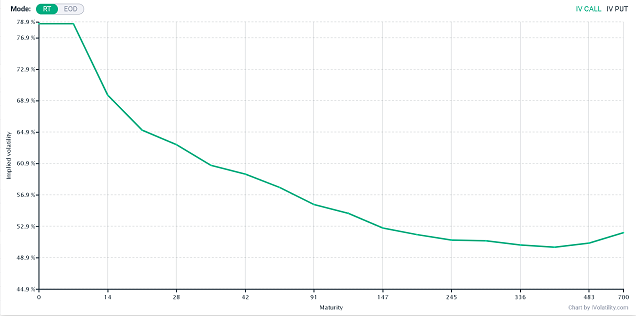
The 30d IV in the name sits around its 57th percentile despite the realized volatility being in its 84th percentile of the last 12 months. All this suggests that the options market remains generally comfortable with the situation in the name. |
The term structure in the name is relatively flat in the short-end which may be interpreted as a sign that market participants do not anticipate a further increase in worries around that name at least for the foreseeable future. |
|
Option volumes in the name were meaningful with around 535k options trading during Friday’s session. Calls volume was around 315k while puts volume reached 220k. |
In the top10 most traded options on the day, 7 were calls, 3 were puts. Those 10 options made up a cumulative 120k contracts with around 80% trading on the call side and only 20% on the put side. |
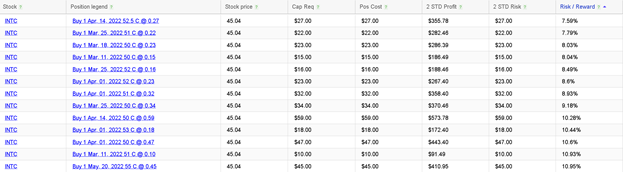
March 57.5 calls were the most traded options in the name with almost 27k contracts trading hands and the March and May 50 strike call followed with around 15k contracts each. |
Interestingly when querying the RT Spread Scanner for the most attractive naked calls to buy in the name, the system returns some structures which are very similar to those that were traded in the market on Friday. |
|
| Disclaimer - This information is provided for general information and marketing purposes only. The content of the presentation does not constitute investment advice or a recommendation. IVolatility.com and its partners do not guarantee that this information is error free. The data shown in this presentation are not necessarily real time data. IVolatility.com and its partners will not be liable for any loss or damage, including without limitation, any loss of profit, which may arise directly or indirectly from the use or reliance on the information. When trading, you should consider whether you can afford to take the high risk of losing your money. You should not make decisions that are only based on the information provided in this video. Please be aware that information and research based on historical data or performance do not guarantee future performance or results. Past performance is not necessarily indicative of future results, and any person acting on this information does so entirely at their own risk. |