We offer multiple professional grade services to help you gain insight on volatility trading. Do not hesitate to try our products FOR FREE by clicking HERE |
The Market Update is a daily newsletter written by the team at iVolatility.com. Leveraging our analytics and data we are able to update you on key developments in the volatility market. To receive the Market Update directly into your inbox, please open a free account or visit our SITE where it is published every day. |
Market Update: 2022-02-22 |
Although US markets were closed for Presidents’ Day, we got a lot of action in European markets especially with the geopolitical tensions reaching yet another high point yesterday. |
European headline indices closed about 2% lower on the day with 30d IV going up about 4 points. The selloff even intensified further after the close losing another 2.6% at one point this morning before firming up slightly. |
US Futures are pointing to a lower open this morning although a more moderate one with the SPX at time of writing (5am EST) indicating down slightly more than 1% and NDX Futures indicating a move lower of around 2%. |
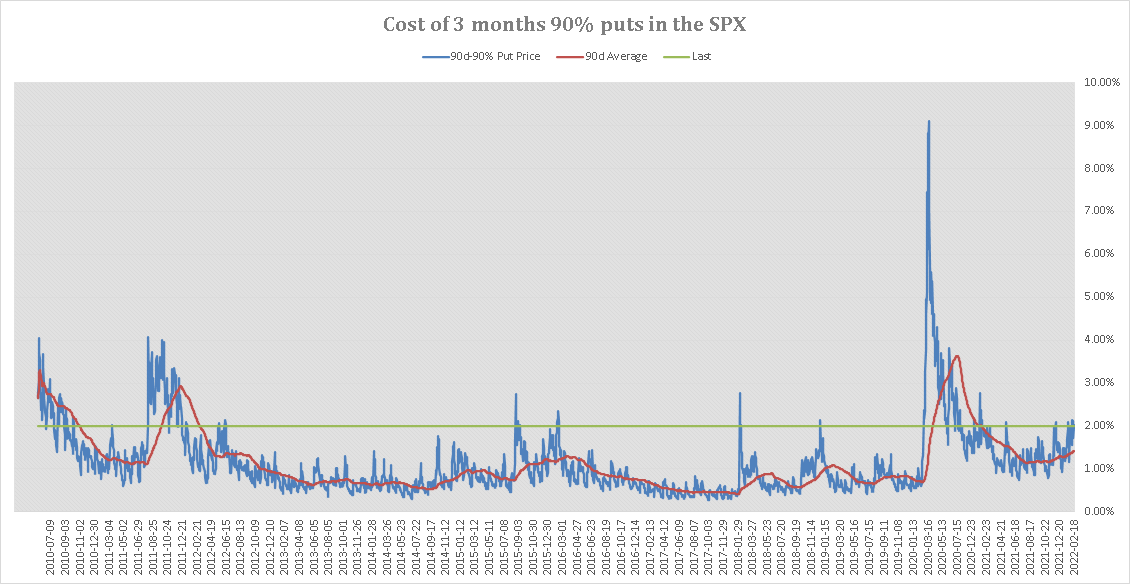
As can be seen from the below chart, the cost of hedging tail risks (measured by the cost of the 3 months 90% puts in the SPX) has been increasing since the middle of 2021 and reached around 2% last Friday, a level that can be seen as relatively elevated over the last 10 years. |
|
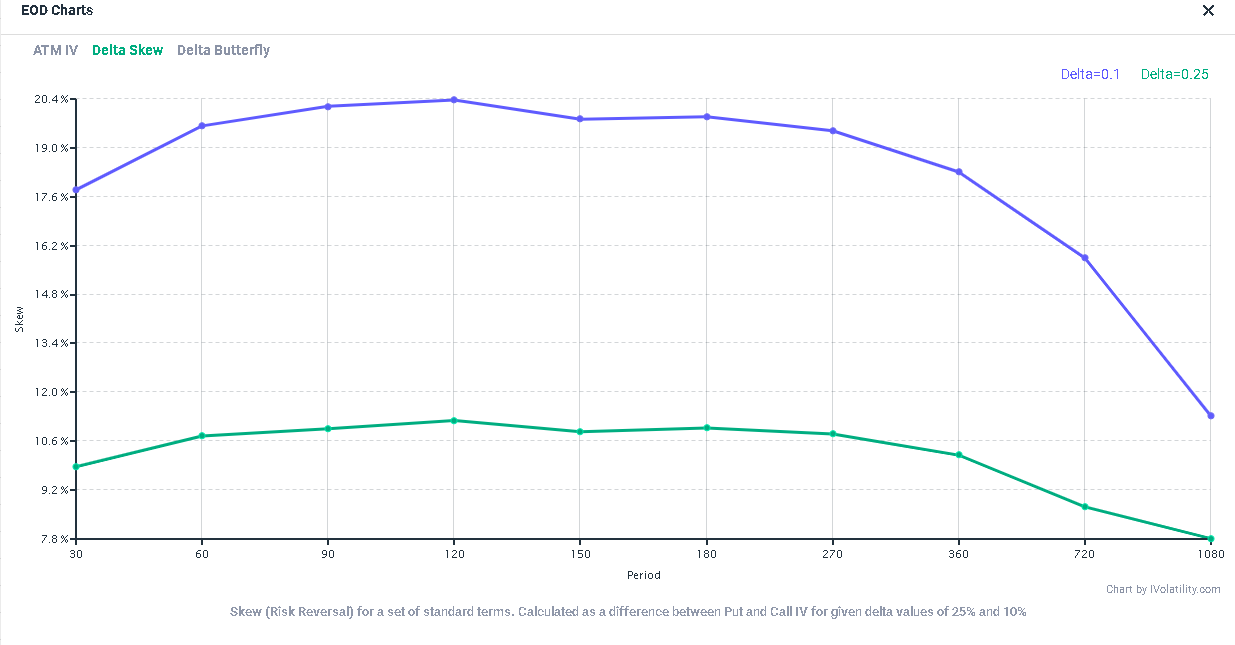
Looking at the current term structure of skew in the SPX, we can see that the 25-delta skew is above 10% for most of the normalized maturities that we consider, a sign that demand for puts is relatively elevated compared to demand for calls. |
|
Does this mean that market participants are pretty well hedged against a potential move lower in the market? |
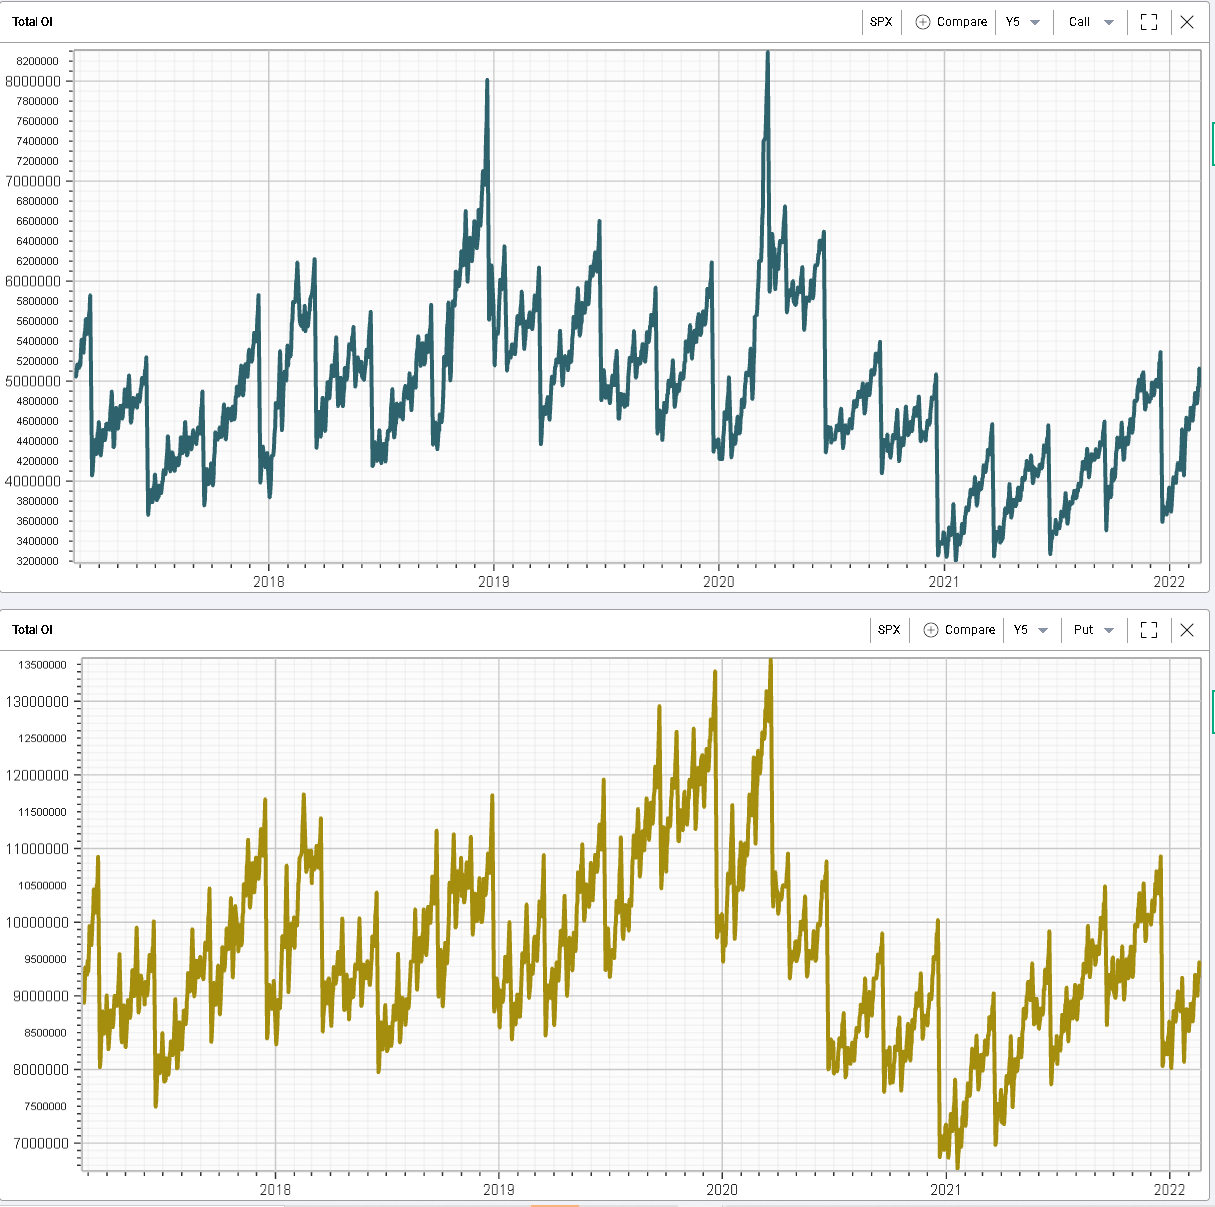
Looking at the open interest on the SPX seems to indicate that the current open interest across both calls and puts is relatively low historically. We can see the large drop in OI for puts at the end of last year around the December expiration where a lot of protection seems to have rolled off for the market. |
|
This overall tells us that people have been putting on hedges back albeit at a slower pace possibly because of the prohibitively expensive put prices noticed in the previous chart. |
As a result, the market may remain vulnerable to larger moves both on the way down and on the way up as people recalibrate their portfolio in the face of incoming news. This lack of hedging and relatively expensiveness of puts may also interest bullish traders to take exposure by selling puts. |
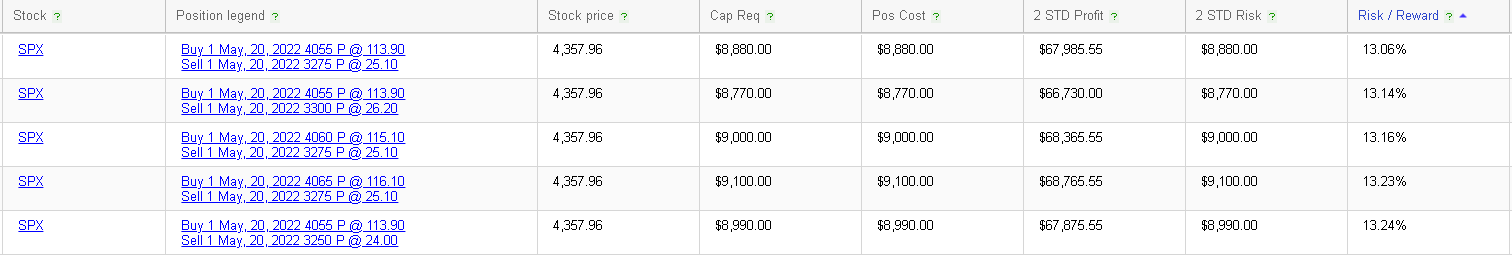
On the other hand, traders who want to express bearish views in the market may be incentivized to look at bear vertical spreads as those will offer some attractive risk/reward as evidenced by the following scan from the RT Spread Scanner: |
|
Overall, as the uncertainty rises, traders will find comfort in focusing on the stories they know best. When macro shocks happen, the market generally makes little case of stock specific stories during the first repricing phase. This opens up a raft of opportunities for traders to focus on some companies that may be liquidated by overly exposed traders. |
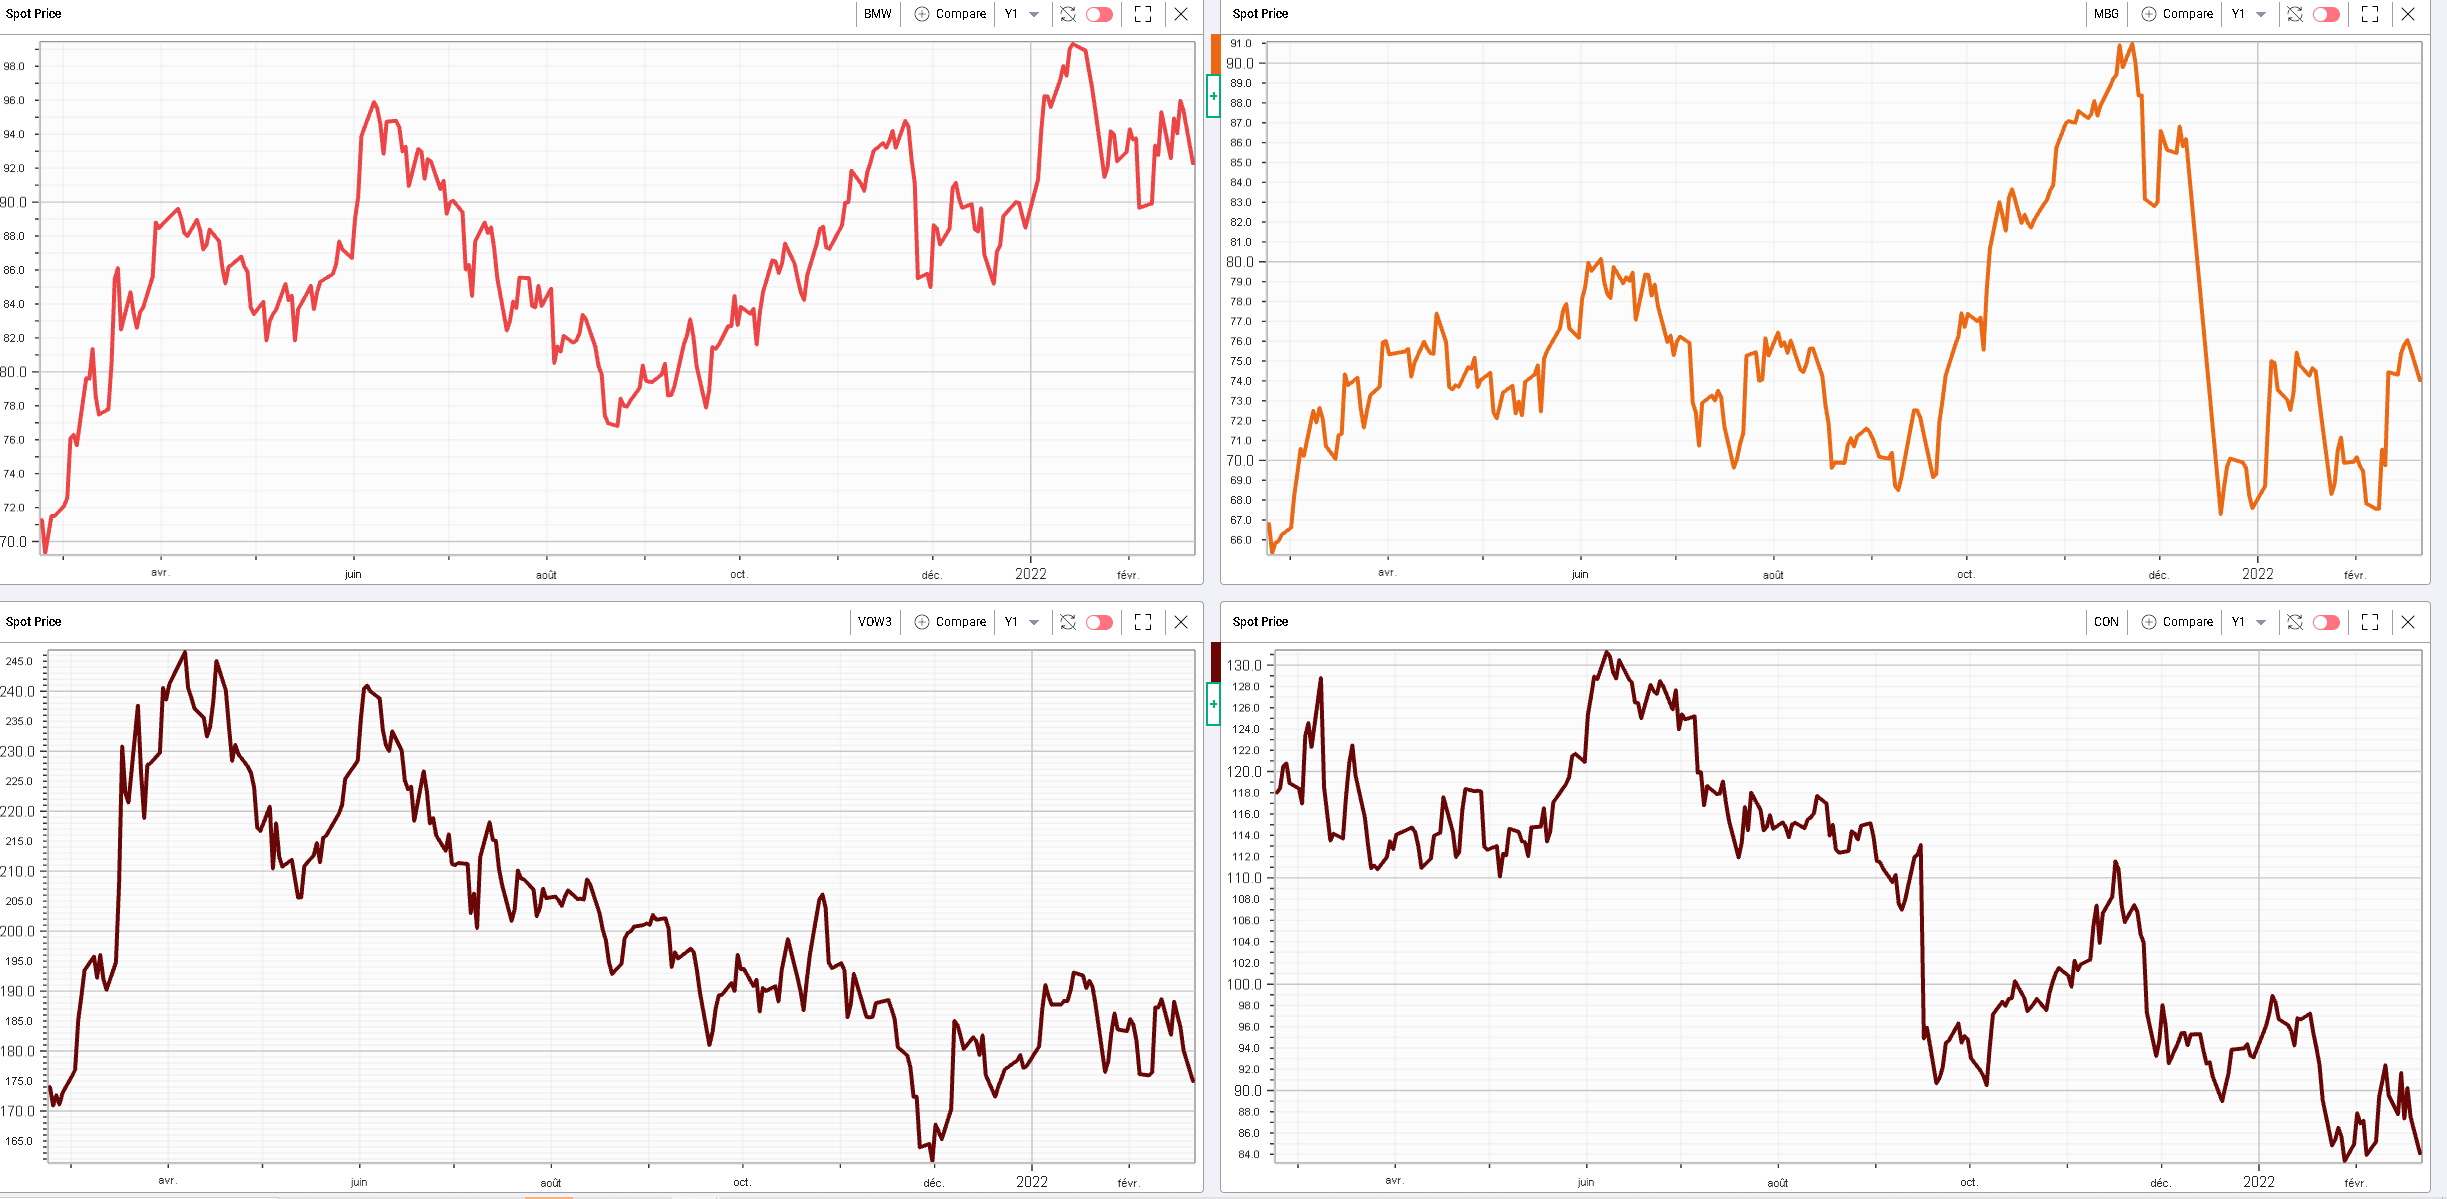
One such example was found in the car sector yesterday in the German DAX. Below, we can see the 12 months spot price for BMW / Mercedes / Volkswagen and Continental. Those 4 companies exhibited very different price action throughout the year yet all of them were down around 3.5% yesterday. |
|
Cases like those will be highly frequent if the market continues to be driven by macro headline. |
| Disclaimer - This information is provided for general information and marketing purposes only. The content of the presentation does not constitute investment advice or a recommendation. IVolatility.com and its partners do not guarantee that this information is error free. The data shown in this presentation are not necessarily real time data. IVolatility.com and its partners will not be liable for any loss or damage, including without limitation, any loss of profit, which may arise directly or indirectly from the use or reliance on the information. When trading, you should consider whether you can afford to take the high risk of losing your money. You should not make decisions that are only based on the information provided in this video. Please be aware that information and research based on historical data or performance do not guarantee future performance or results. Past performance is not necessarily indicative of future results, and any person acting on this information does so entirely at their own risk. |