We offer multiple professional grade services to help you gain insight on volatility trading. Do not hesitate to try our products FOR FREE by clicking HERE |
The Market Update is a daily newsletter written by the team at iVolatility.com. Leveraging our analytics and data we are able to update you on key developments in the volatility market. To receive the Market Update directly into your inbox, please open a free account or visit our SITE where it is published every day. |
Market Update: 2022-02-24 |
It feels that whatever we discuss in today’s market update will already feel outdated by the time it is published. Overnight, the Russia/Ukraine conflict escalated even further with Russia launching large scale military operations in Ukraine triggering a large liquidation in equity markets with a very strong bid for safe heaven assets and some commodities. |
Yesterday saw another selloff in the US markets. The NDX was down around 2.5% and its 30d IV was higher by almost 2.5 points. For the SPX, spot finished around 2% lower and 30d IV was around 2 points higher. |
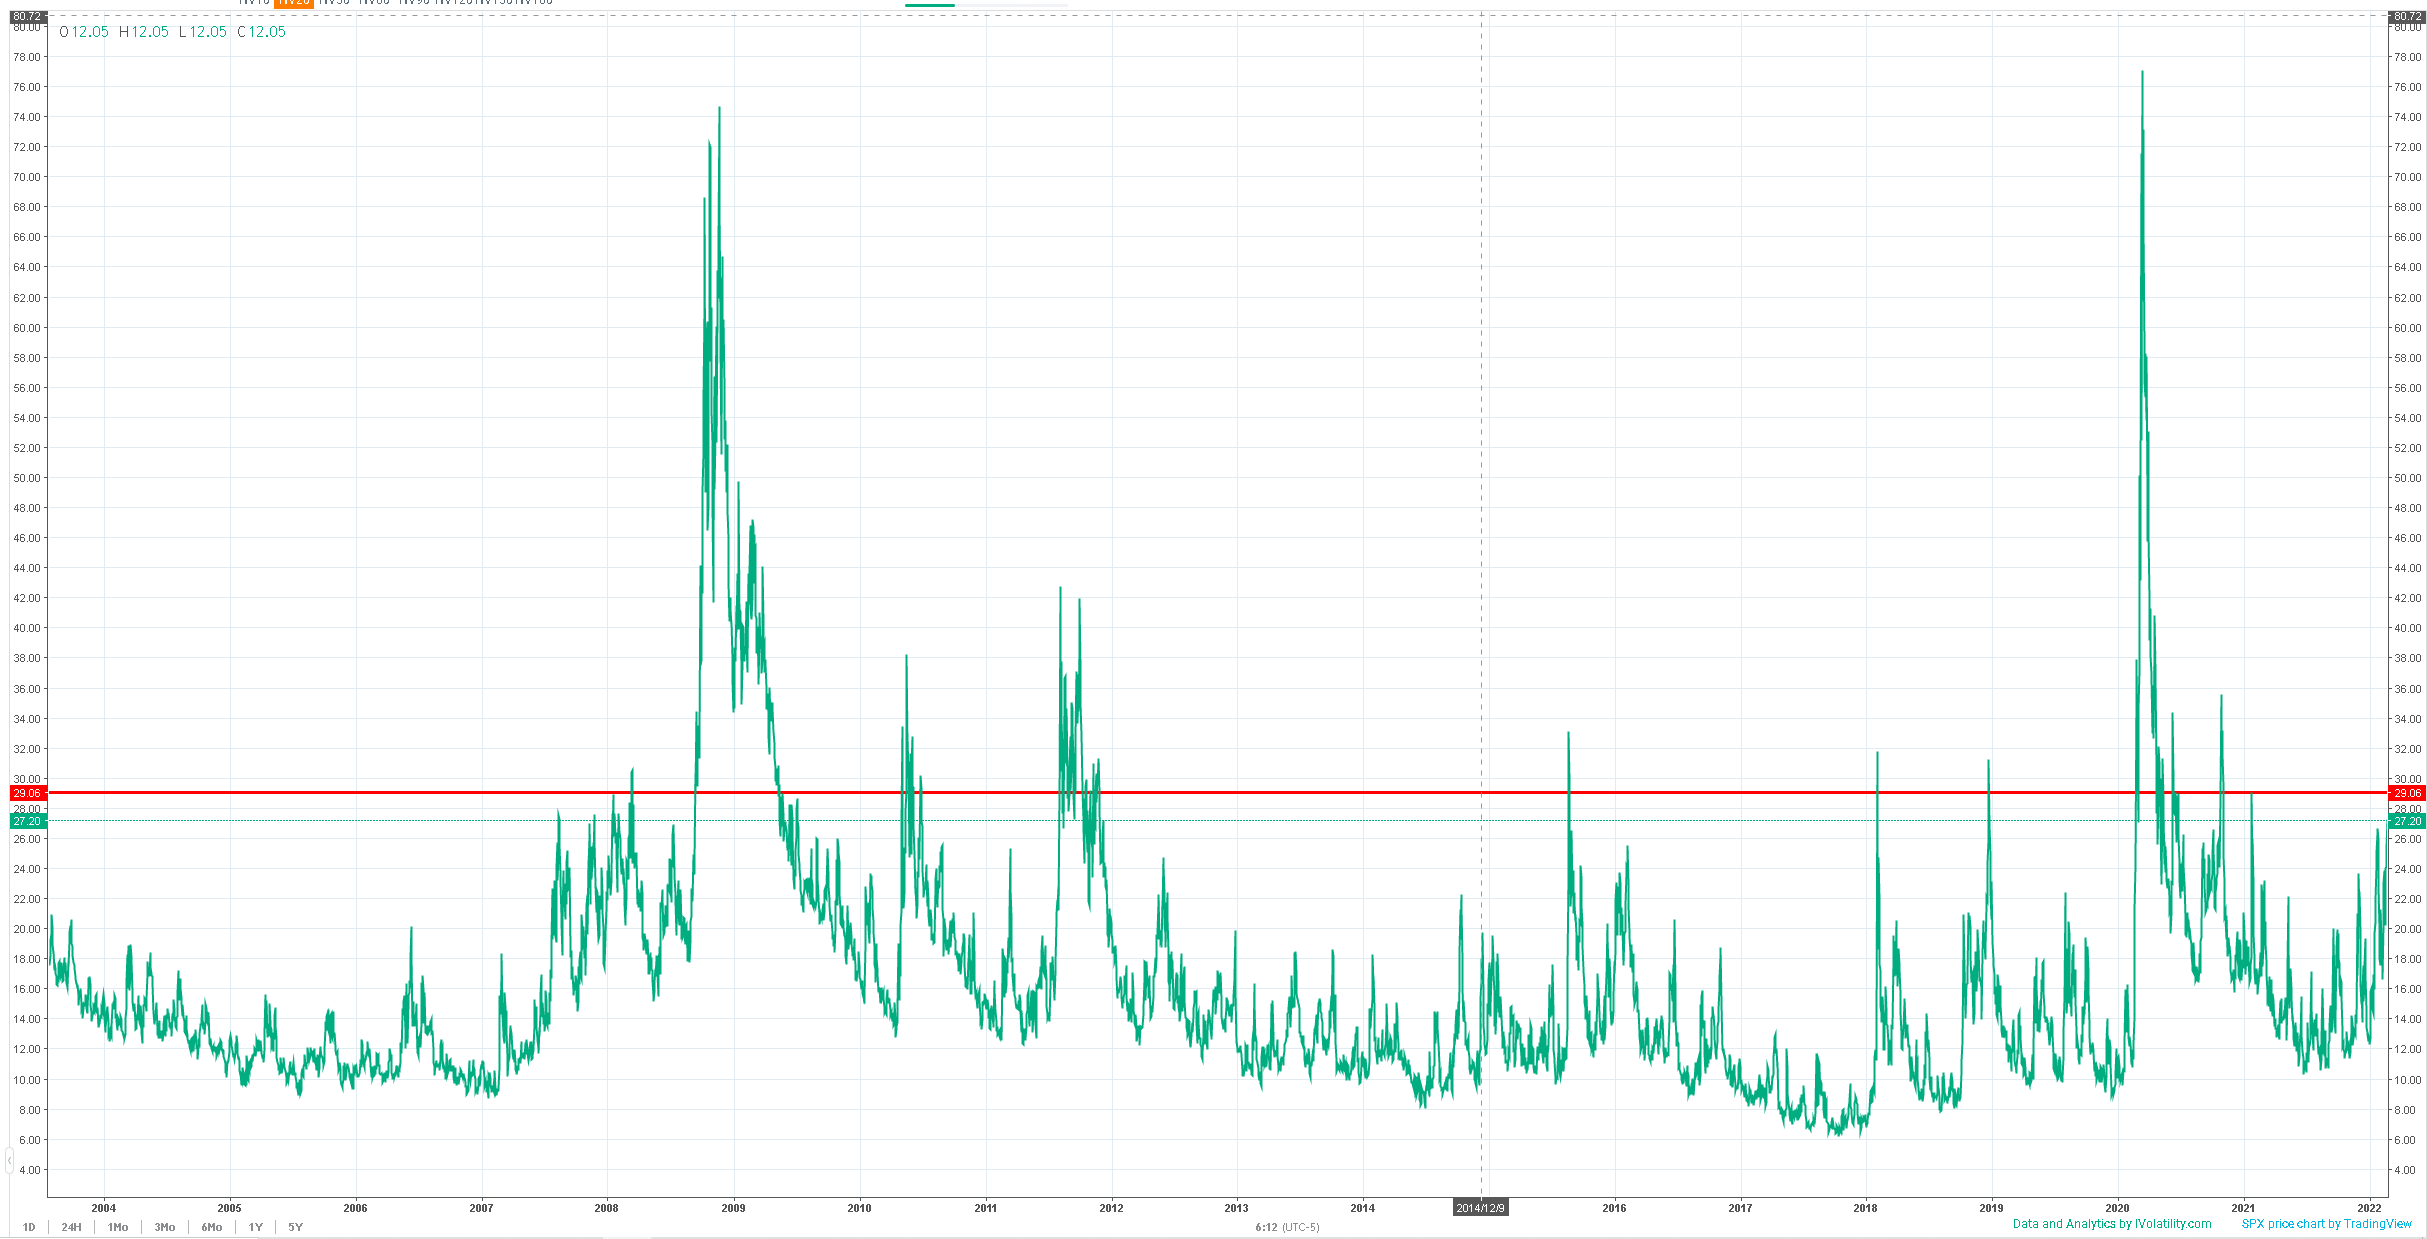
With 30d IVX set to open around 29, we are into territory that is very rarely visited by the market. |
|
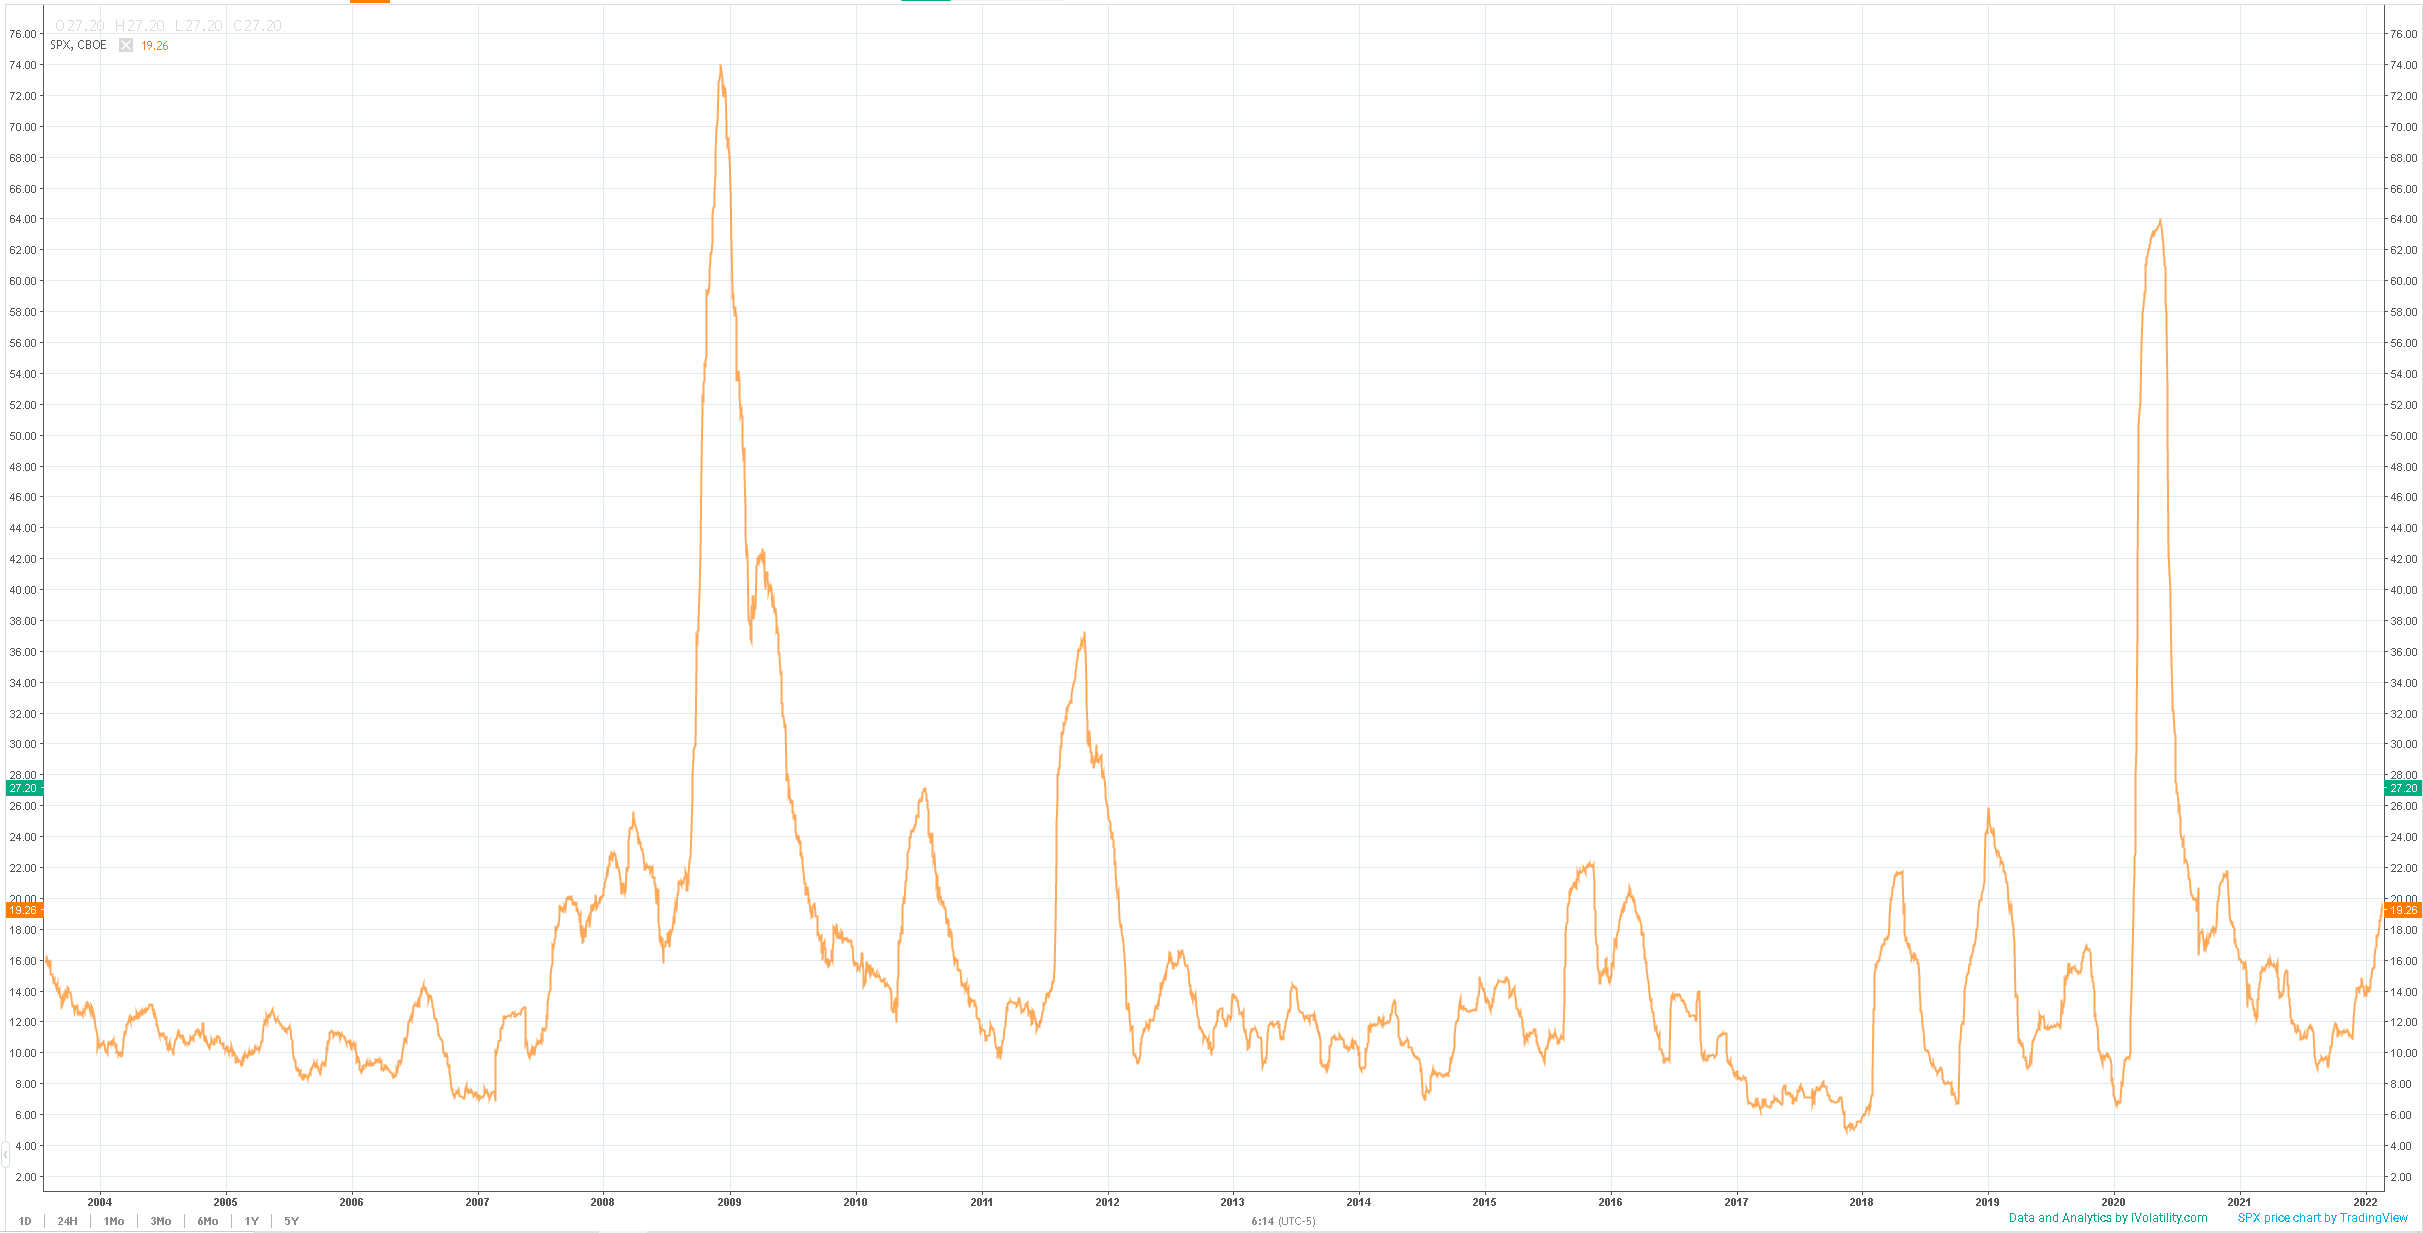
We have been flagging that the volatility expansion that started around Q3–2021 had been validated over the past few months. As of yesterday’s close, 60d realized volatility was around 19.26 and will undoubtedly settle above 20% following the large move we are currently witnessing. |
|
Given the price action in Oil overnight with the price testing the $100 per barrel level, it will be interesting to see how the oil majors react. In Europe, TotalEnergies one of the leaders in the field is currently trading down around 3.5% in a sign that the general risk-off tone is impacting all segments. |
Yesterday on the other hand, CVX was the only stock within the DOW to close the day up at around +2.4%. Within the DOW which finished the day around –1.4% lower, the selling was pretty homogenous with most stocks trading between –2.5% and –1%. |
Tech giants underperformed in line with the NDX, AAPL and MSFT both closed down 2.59% with vols up respectively 0.5 et 1 vol in the 30–day bucket. |
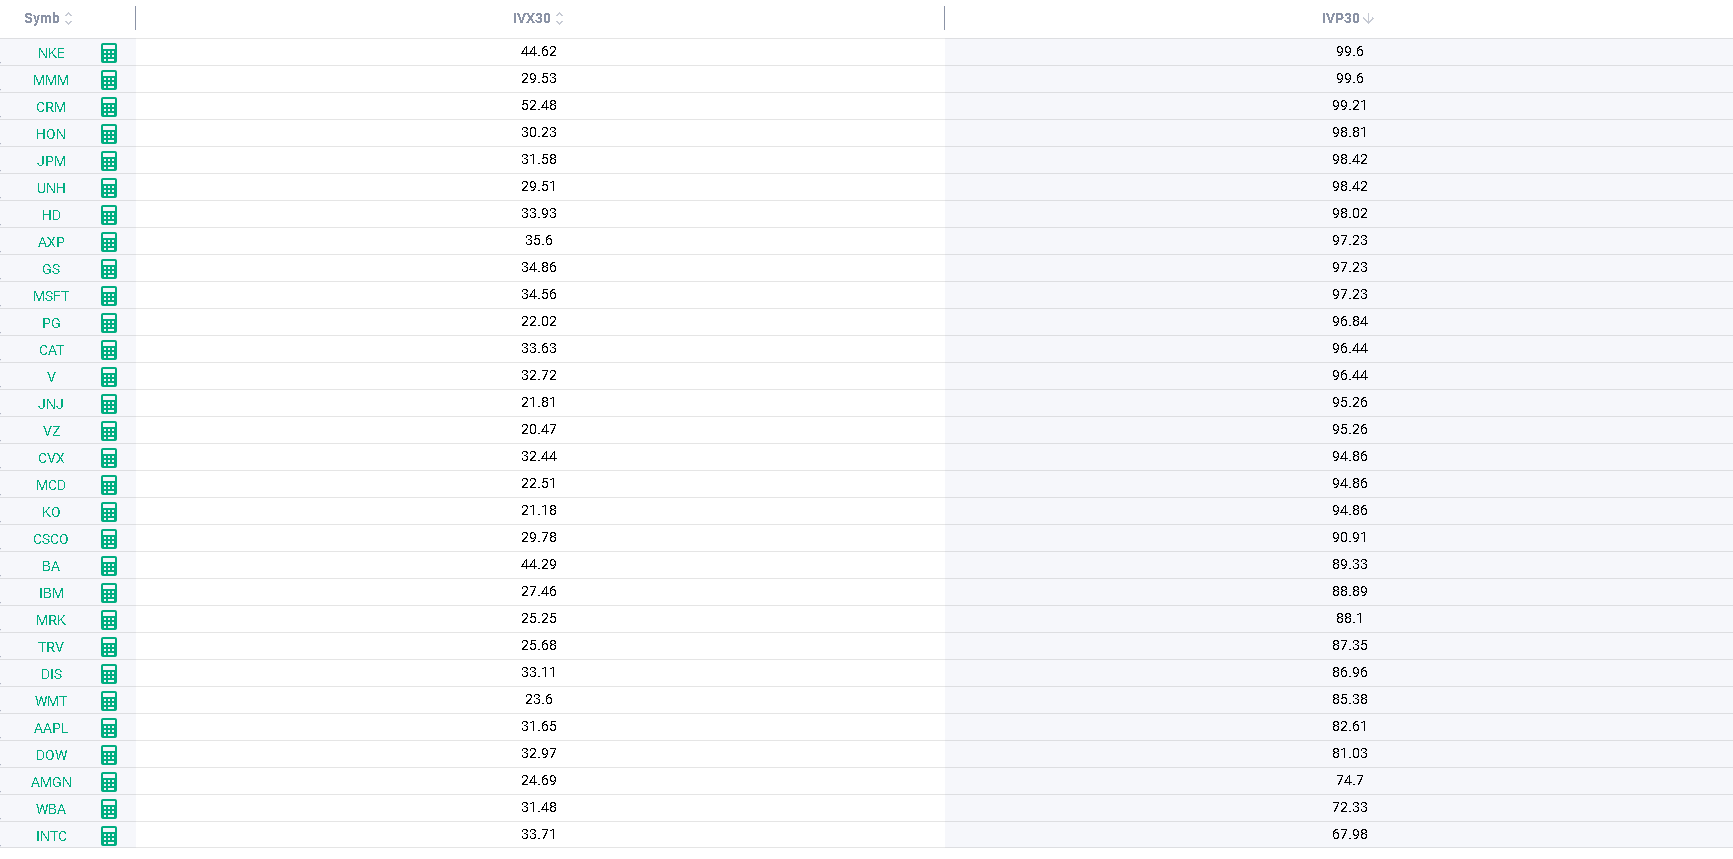
In the DOW, most implied volatilities measured by the IVX30 were trading above their 90th percentile at the close yesterday with some notable exceptions. |
|
Intel 30d IV has remained lower than other technology company, closing in its 68th percentile. AAPL also remains lower than the rest of the DOW components trading in its 82nd percentile. |
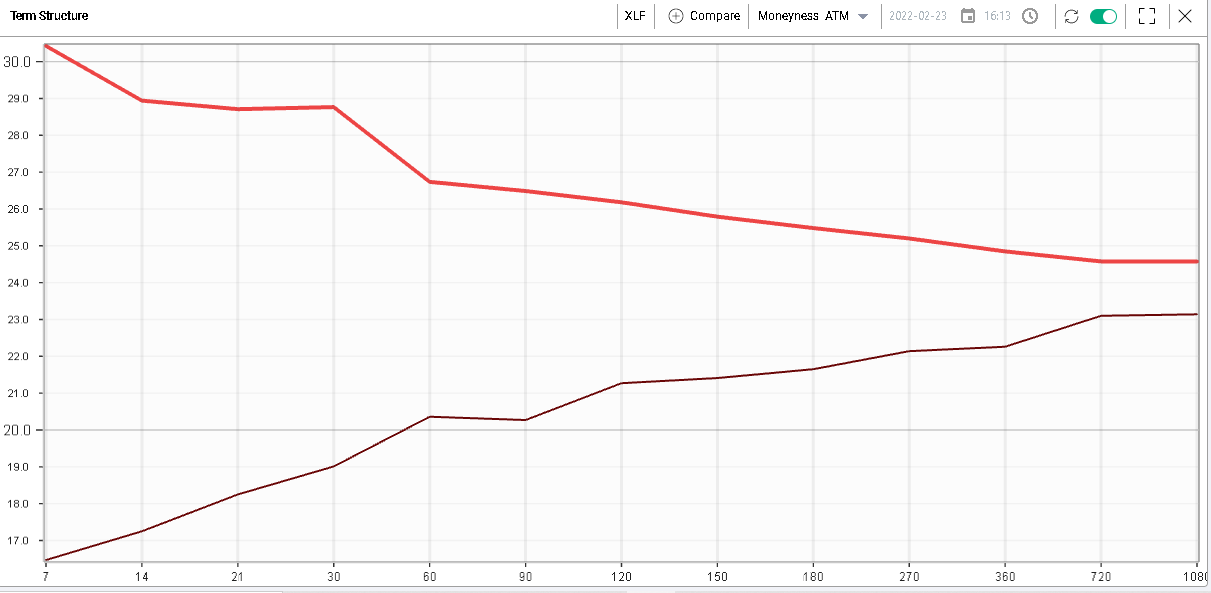
Another interesting sector to watch today will be the financials. The XLF closed down around 1.75% yesterday and European Banks are under heavy selling pressure, currently trading around 8% lower than the previous close. |
The XLF 30d IV closed around 28.8 yesterday, a level that is roughly in the 98th percentile for the ETF over the last 12 months. |
Comparing the term structure at the close yesterday with the shape it had on the last day of 2021, we can highlight a few important points: |
|
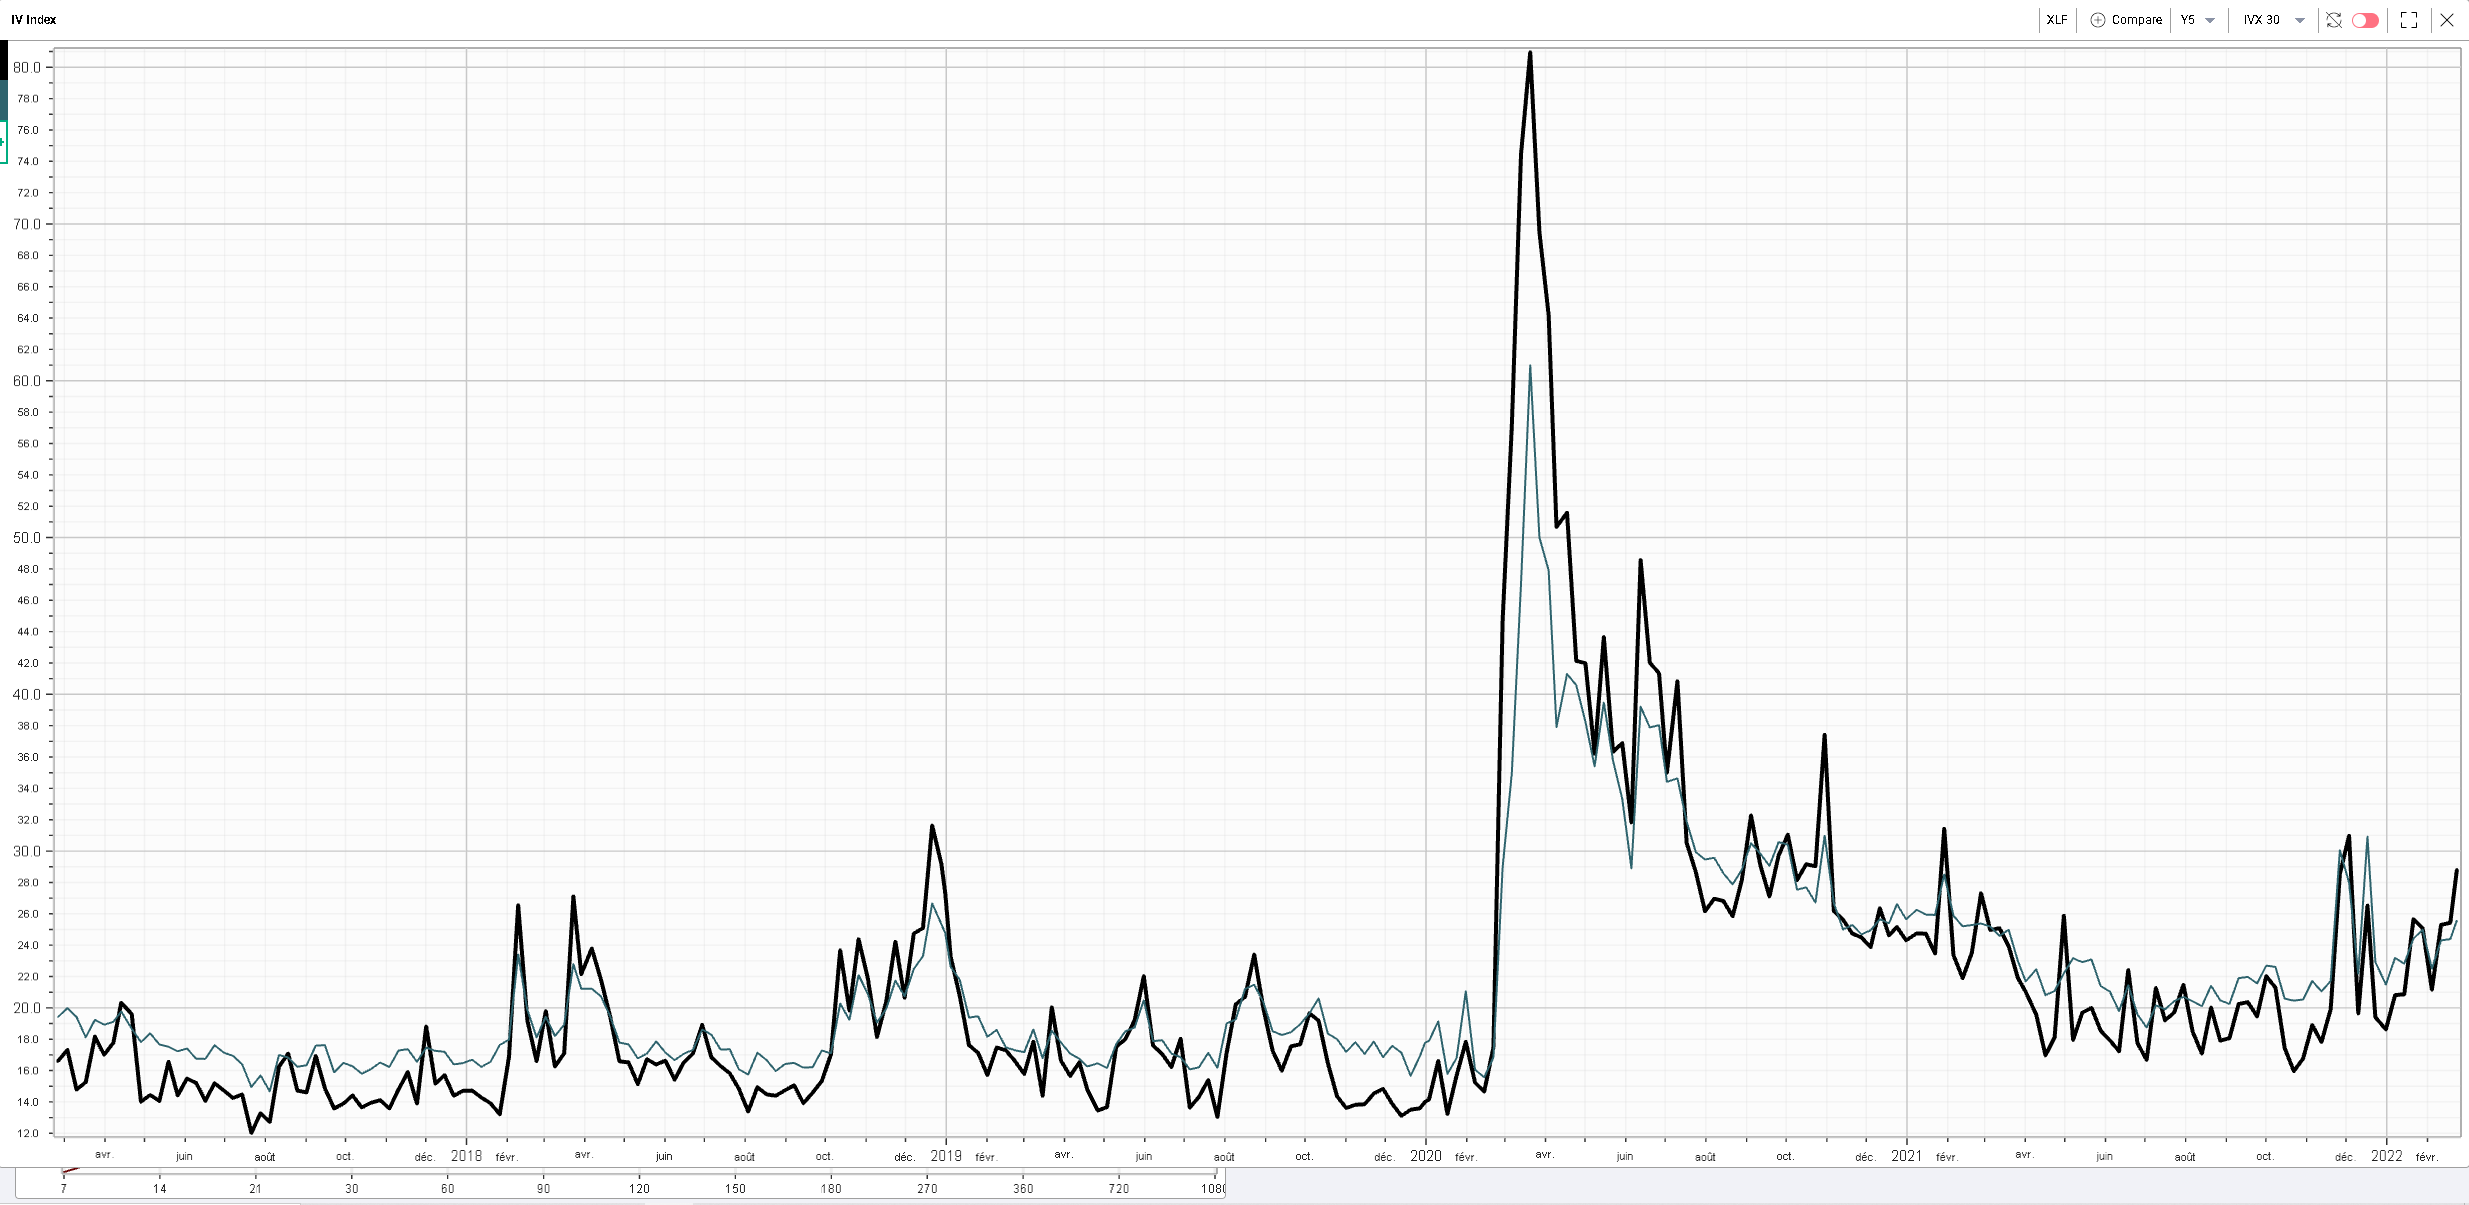
|
Looking at the 5-year weekly chart for the IVX30 and the IVX180, we can see that on a weekly basis, it is fairly rare for the IVX 30 (black line) to remain above the IVX 180 (blue line) for long periods of time. |
|
In particular, in 2021, we had multiple instances of inversions that were very rapidly corrected. It is obviously very difficult to estimate how things will play out this time. That will very much depend on the way the geopolitical tensions evolve but traders may find interesting to monitor those dislocations for possible signs of easing or increasing tensions. |
Using Charts in IVolLive, this can be done on any stock or index that is part of the universe we cover. |
| Disclaimer - This information is provided for general information and marketing purposes only. The content of the presentation does not constitute investment advice or a recommendation. IVolatility.com and its partners do not guarantee that this information is error free. The data shown in this presentation are not necessarily real time data. IVolatility.com and its partners will not be liable for any loss or damage, including without limitation, any loss of profit, which may arise directly or indirectly from the use or reliance on the information. When trading, you should consider whether you can afford to take the high risk of losing your money. You should not make decisions that are only based on the information provided in this video. Please be aware that information and research based on historical data or performance do not guarantee future performance or results. Past performance is not necessarily indicative of future results, and any person acting on this information does so entirely at their own risk. |