We offer multiple professional grade services to help you gain insight on volatility trading. Do not hesitate to try our products FOR FREE by clicking HERE |
The Market Update is a daily newsletter written by the team at iVolatility.com. Leveraging our analytics and data we are able to update you on key developments in the volatility market. To receive the Market Update directly into your inbox, please open a free account or visit our SITE where it is published every day. |
Market Update: 2022-02-25 |
This market is definitely one for active traders at the moment with an intraday turnaround yesterday that gave plenty of opportunities. Futures were sold very aggressively overnight but buyers managed to get in control as the US open approached and after the bell rang in New York, we never looked back. |
European equities felt more selling pressure partly because of the geographical and economical proximity. European Banks finished the day down more than 8% and did not enjoy any relief rally even after the US markets had opened. |
Headline indices in Europe finished the day in the red as well, both the German DAX and the French CAC were down 4% on the day. In the United States, the NDX managed to close up 3.5% while the SPX gained almost 2%. |
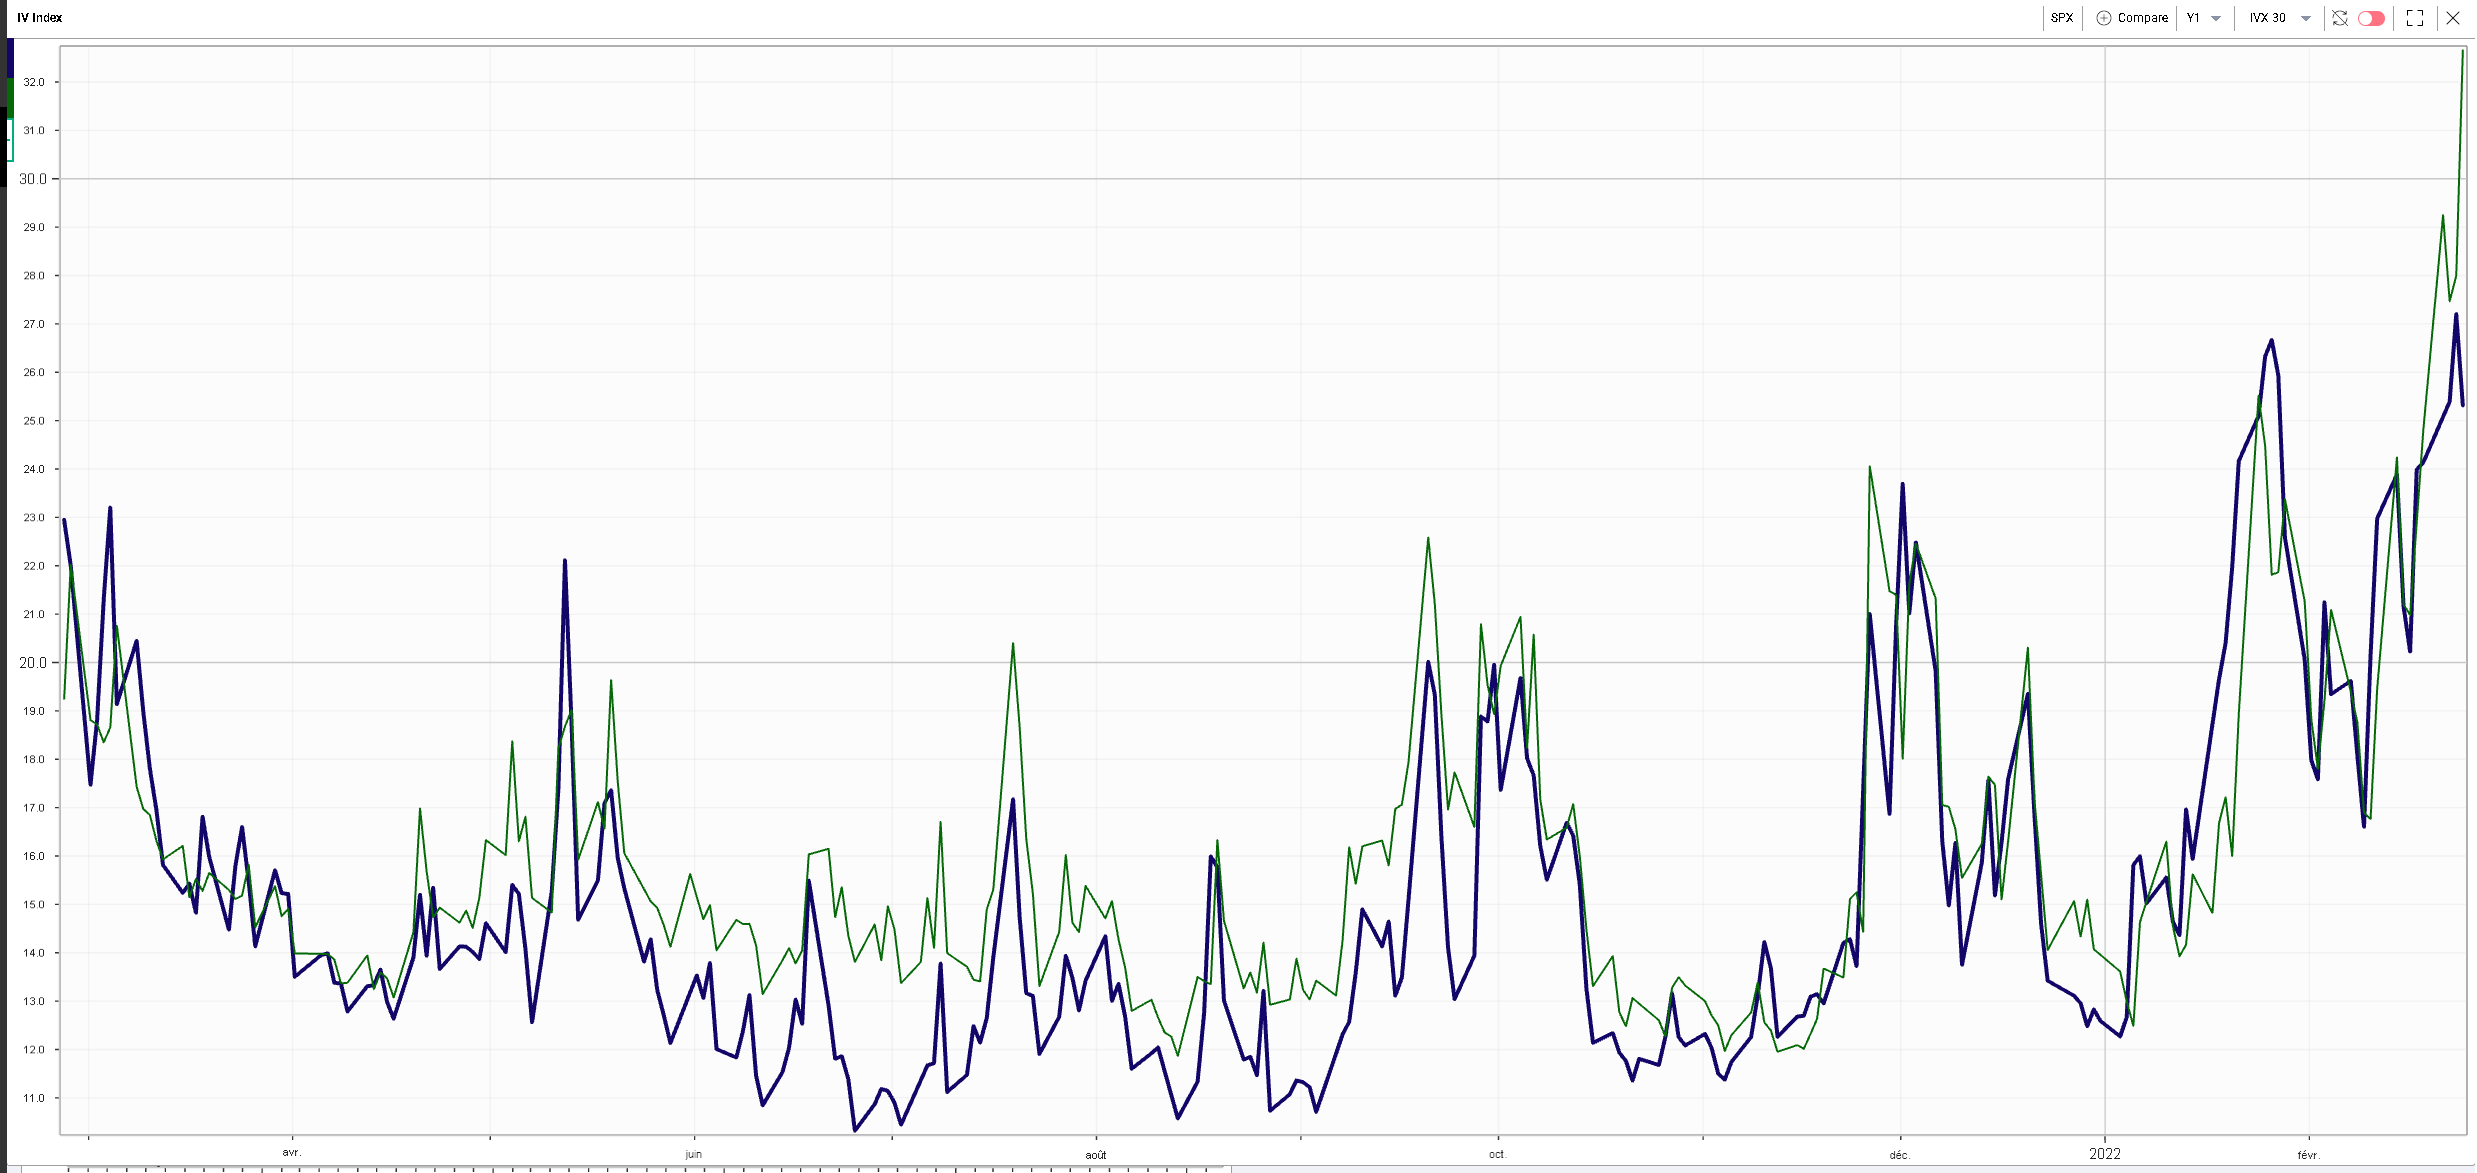
As a result, implied volatilities between European equities and US equities widened as Europe 30d IVs were up almost 4 points on the day while US 30d IVs were down about 2 points. |
|
The divergence between European and US implied volatilities is visible on the following chart showing the 30d IVX in the German DAX (in Green) and the 30d IVX for the SPX (in blue) over the past 12 months. That spread will almost surely converge today as European assets will partly catch up with their American counterparts. |
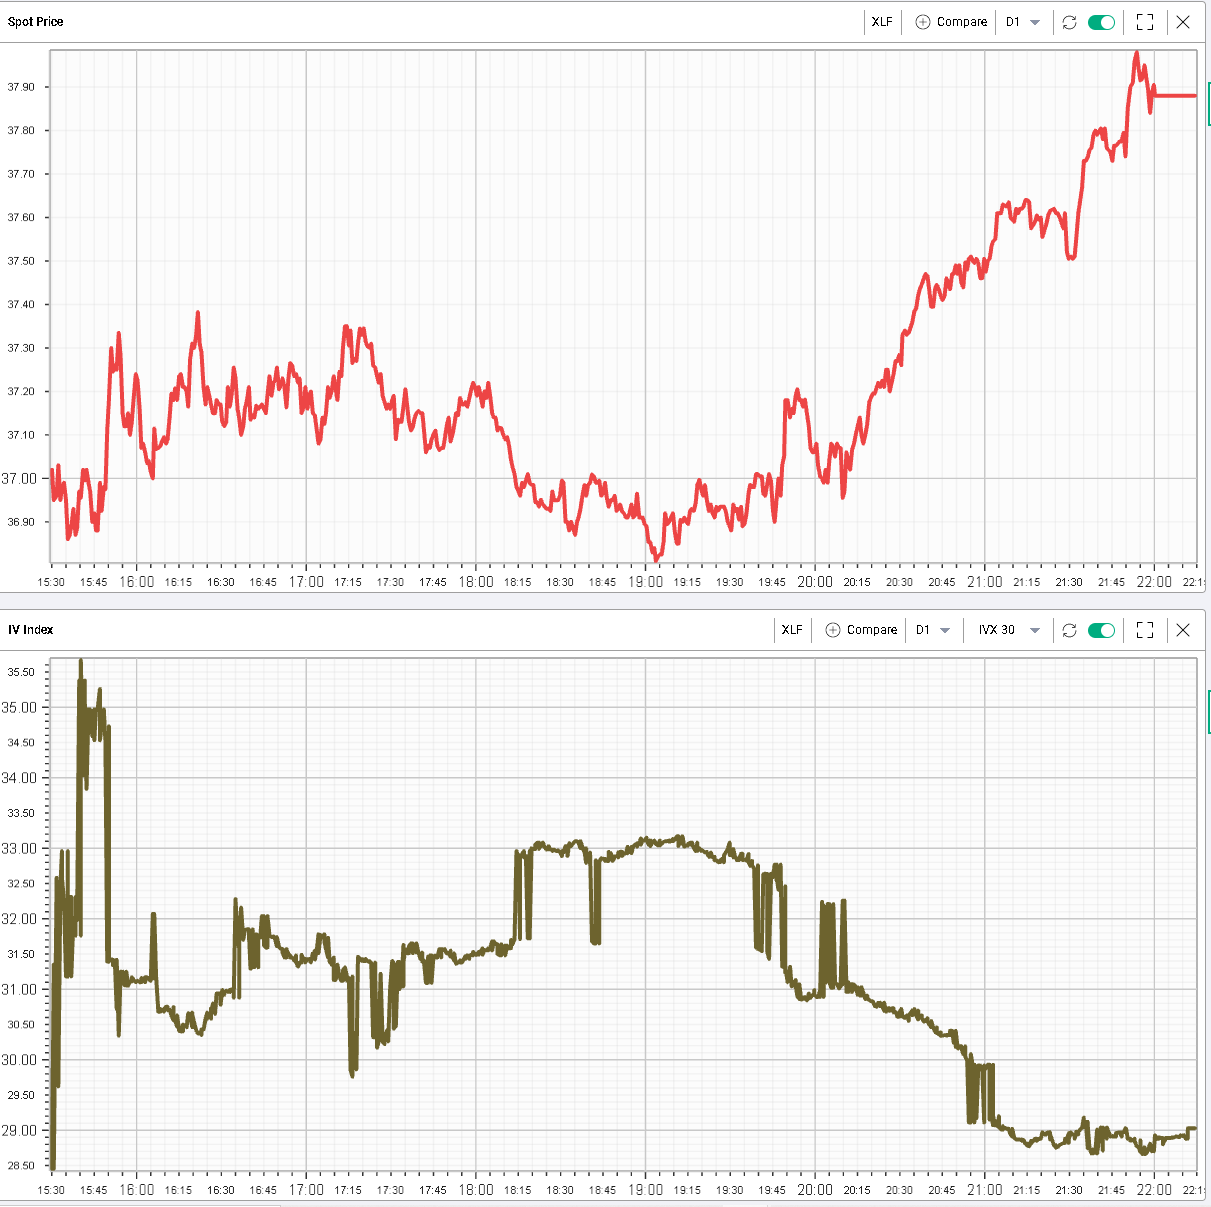
The bounce in US stocks was led by technology companies with Intel and Microsoft rebounding more than 5% on the day for instance. Banks felt a bit more pressure but nothing compared to what was seen over in Europe. The XLF closed down slightly more than 1% but with a late day rally that pushed implied vols back down to finish unchanged on the day. |
|
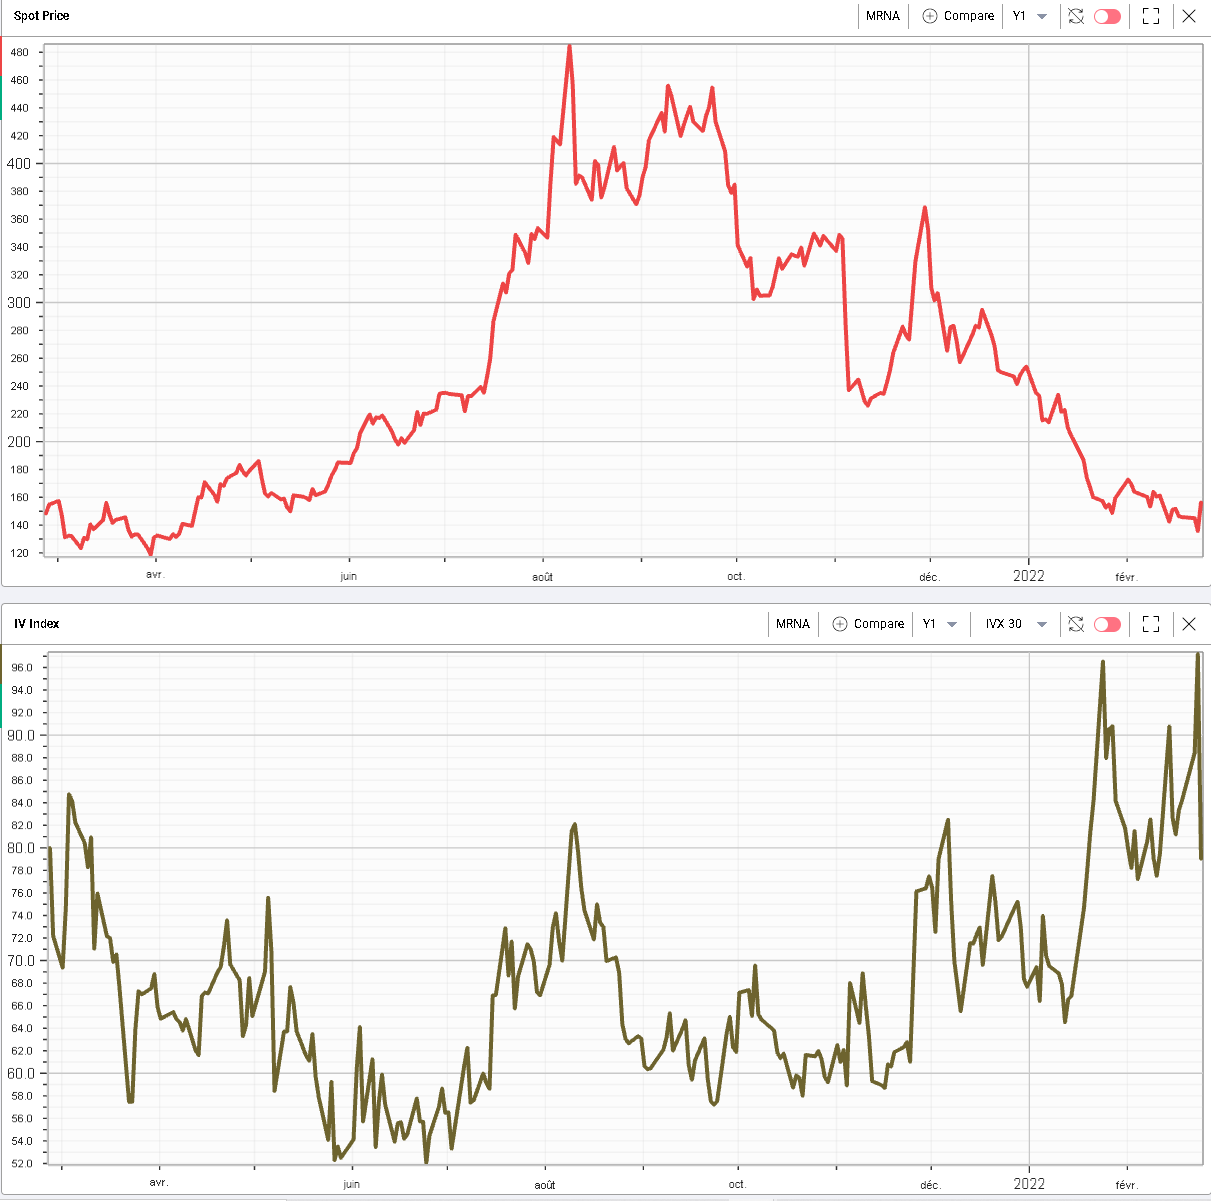
Other single stock story worth noticing was the price action in Moderna which finished the day up 15% after it released better numbers than the market had been anticipating. |
It will be very interesting to see how the stock reacts over the next few days as the company has sold off extensively on the year so far. 30d IVX in MRNA remains elevated historically around 80%, a sign that option traders continue to expect large moves up or down in the company over the next few weeks. |
|
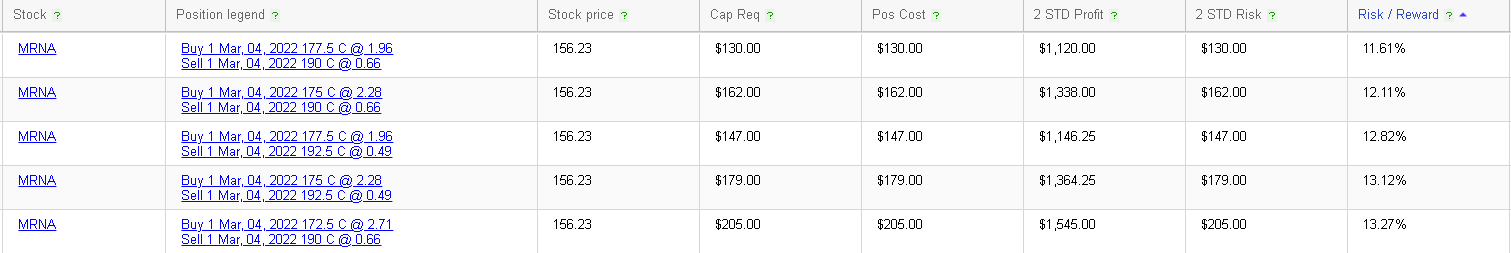
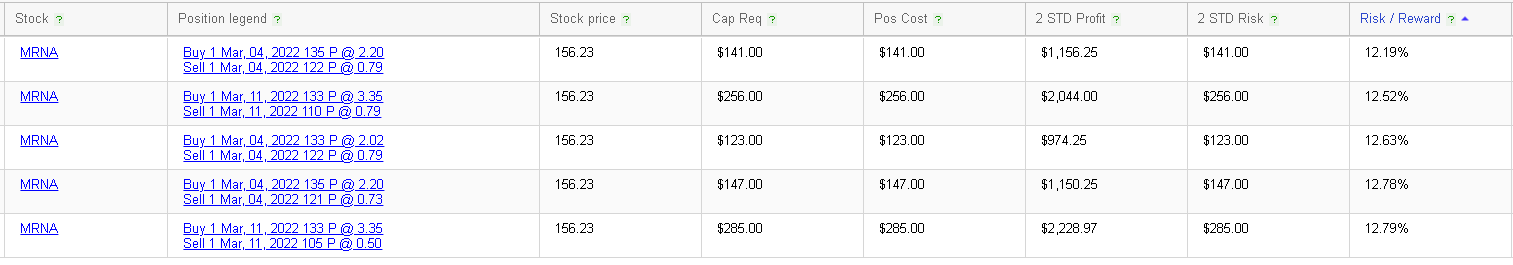
As usual, the RT Spread Scanner can be of significant help for traders looking to scan for bullish or bearish strategies in the name. We show below of few of those as examples with bull vertical spreads and bear vertical spreads giving reward to risk of almost 10 to 1 for some short-dated structures. |
|
|
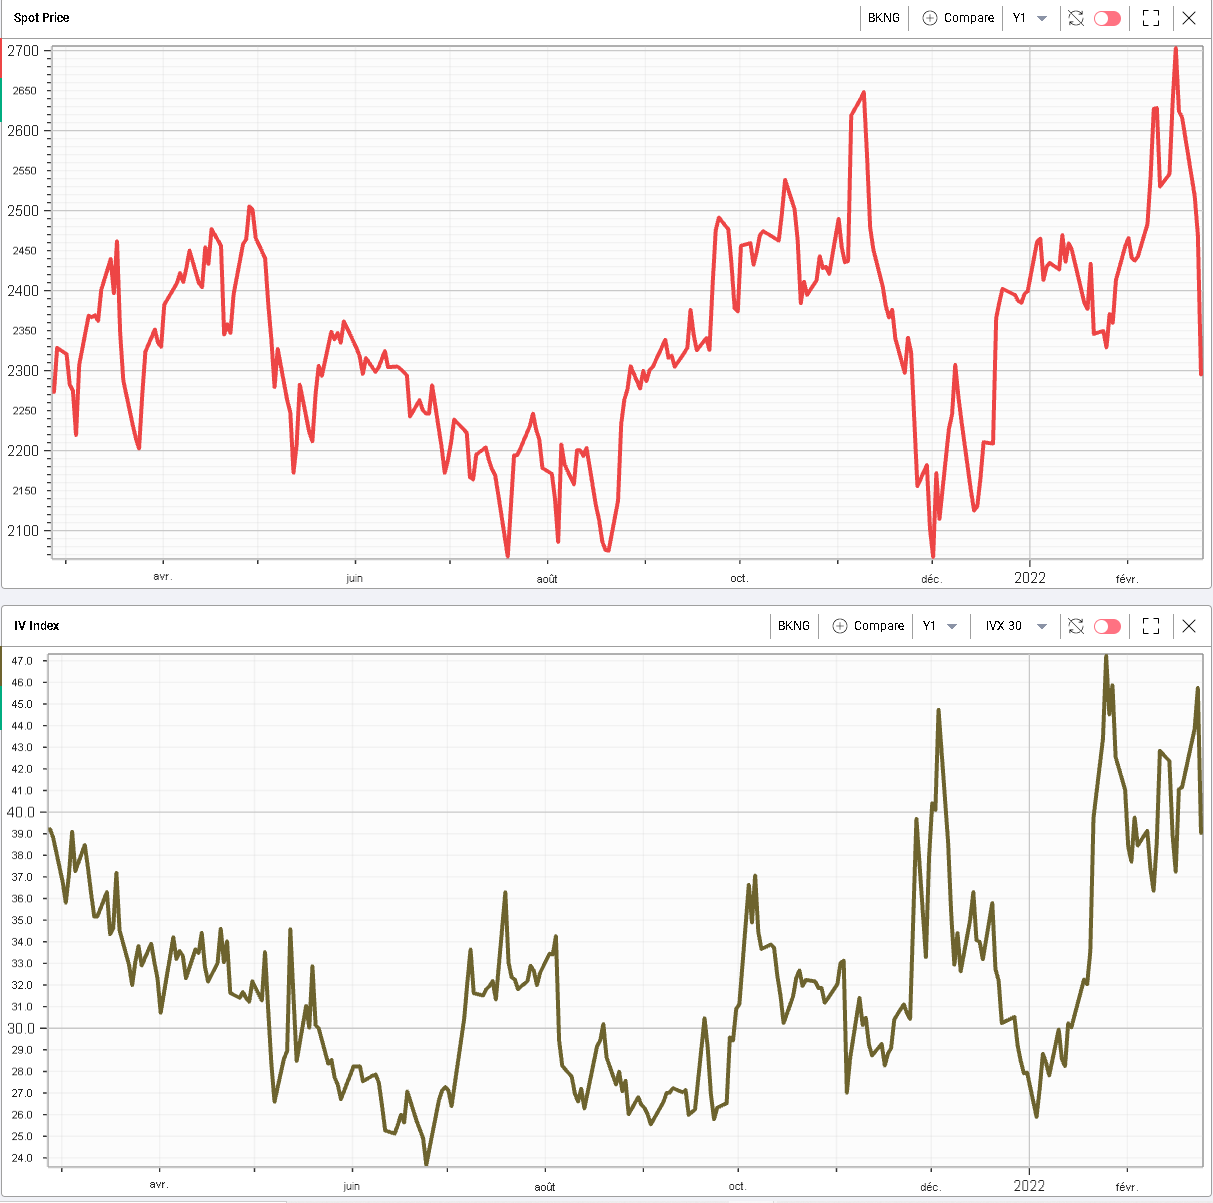
Booking price action over the day surprised many traders as the stock reported earnings that looked better than expected. The stock finished around 7% lower and 30d IVX closed down around 6 points in a typical post earnings IV crush. |
|
The talk on the street was mostly related to the fact that increased geopolitical tensions might result in the FED and other major central banks being forced to delay the implementation of their exit strategies, both on the rates front and on the assets side as well although the spike in some commodities prices over the past few weeks will most likely fuel inflation even higher creating a difficult situation for Central Banks and making the overall assessment of the situation even harder than it was prior to this conflict. |
The WTI Futures curve for instance remains firmly inverted. We reached a high point slightly above $100 per barrel on the front contract but the risk-on mode driven by US equities pushed Crude Oil back towards the mid–90s area. |
|
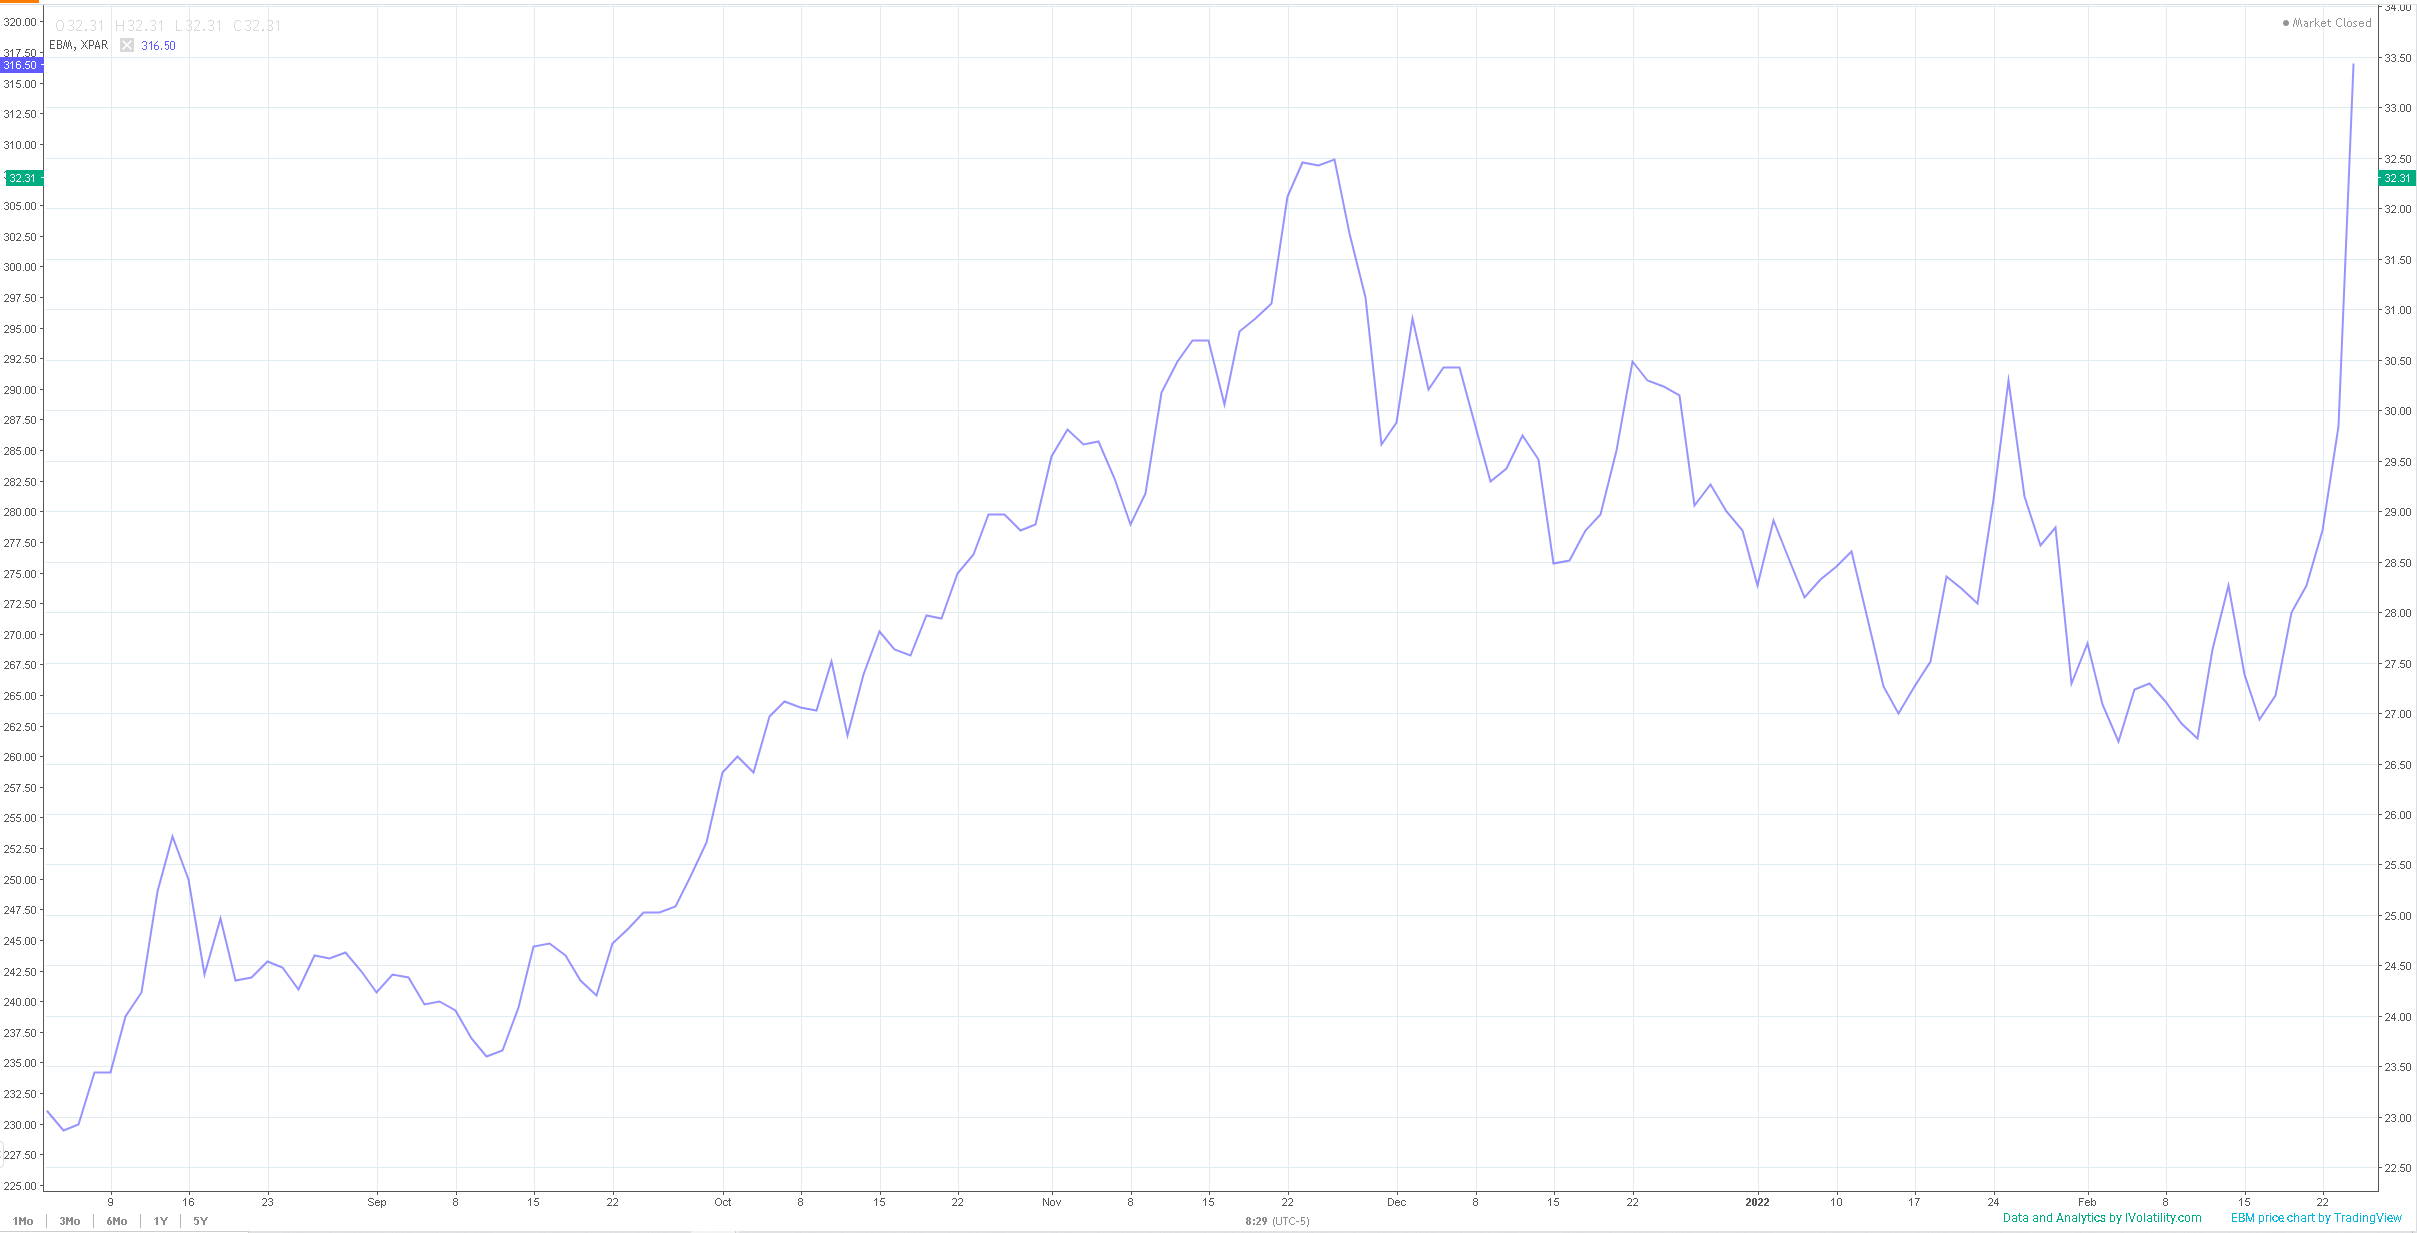
Wheat in Europe increased by about 20% from its recent lows with the front contract settling at $316.5 per ton after reaching a high point intraday of $344 per ton. |
|
| Disclaimer - This information is provided for general information and marketing purposes only. The content of the presentation does not constitute investment advice or a recommendation. IVolatility.com and its partners do not guarantee that this information is error free. The data shown in this presentation are not necessarily real time data. IVolatility.com and its partners will not be liable for any loss or damage, including without limitation, any loss of profit, which may arise directly or indirectly from the use or reliance on the information. When trading, you should consider whether you can afford to take the high risk of losing your money. You should not make decisions that are only based on the information provided in this video. Please be aware that information and research based on historical data or performance do not guarantee future performance or results. Past performance is not necessarily indicative of future results, and any person acting on this information does so entirely at their own risk. |