We offer multiple professional grade services to help you gain insight on volatility trading. Do not hesitate to try our products FOR FREE by clicking HERE |
The Market Update is a daily newsletter written by the team at iVolatility.com. Leveraging our analytics and data we are able to update you on key developments in the volatility market. To receive the Market Update directly into your inbox, please open a free account or visit our SITE where it is published every day. |
Market Update: 2022-03-01 |
With the announcement over the weekend of further sanctions on Russia including a partial ban from the SWIFT system, markets felt heavy again on Monday although the overall result shows that the selling is happening mostly in European equities rather than spreading globally. |
European Banks in particular those with close ties to Russia sold off particularly aggressively on the day. The SX7E, the index that tracks the top banks in the Eurozone finished the day around 6% lower and its 30 days implied volatility closed about 7 points higher. |
European indices finished between 1% and 1.5% lower while US headline indices were relatively unchanged over the day. |
Despite markets staying very resilient in the face of a rapidly deteriorating geopolitical situation, implied volatilities continued to expand. All major indices, including the NDX which closed about 0.35% higher on the day saw their 30d implied volatility increase. |
In the SPX which settled down 0.25%, 30 days and 60 days implied volatilities finished about 1.2 points higher while 6 months IV finished up about 0.75 points. |
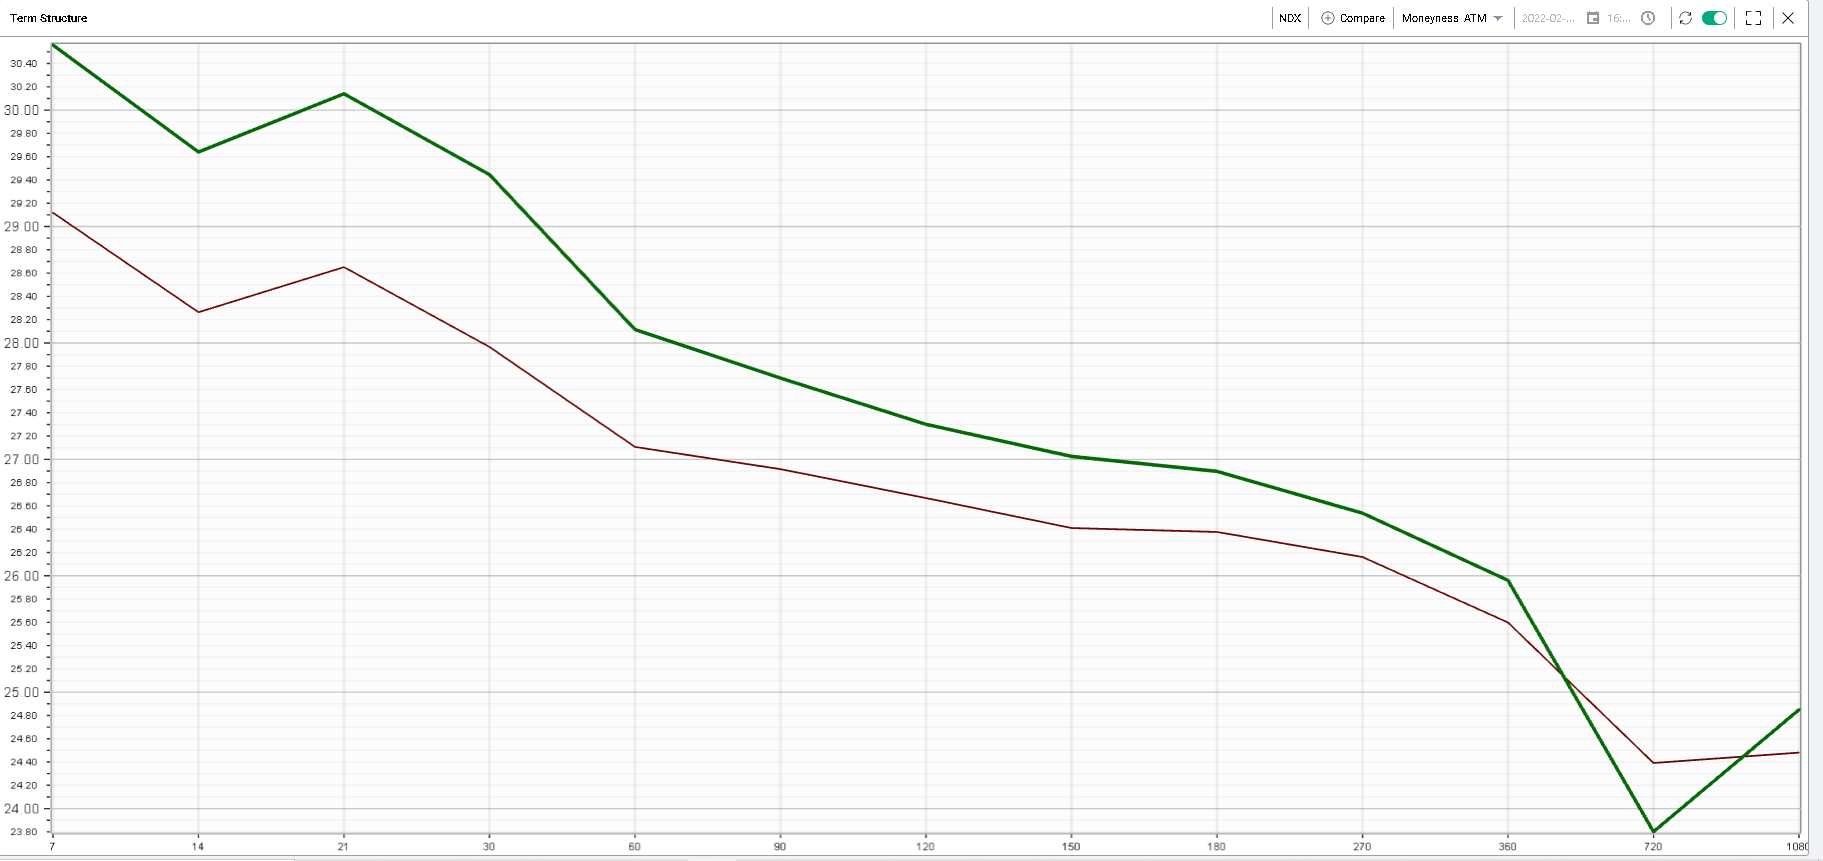
The below chart shows the term structure of the NDX and is quite telling from that perspective. If US indices have remained relatively resilient for now, options traders seem to be expecting higher volatility to resume in the short run. |
NDX Term Structure – Green = 2022-02-28 – Brown = 2022-02-25 |
One of the key events outside of the Ukraine/Russia situation will be seen on Friday with the February payroll report. Following the fairly strong January report it will be an important indicator of the potential continued strength in the labor market in the US. Consensus is currently seen around 440K. |
Adding to the recent rise of commodity prices with oil trading just below $100, it is creating a lot of focus on the FED meeting in March to see a rate hike that could be as high as 50 basis points. In fact, there seems to be almost no hesitation for market participants that the March meeting for the FED will be live, with the only question being whether the hike pushes the target range up 25 or 50 basis points. Raising rates will most likely continue to act as a support for US Banking stocks which have performed fairly well in comparison to their European counterparts. |
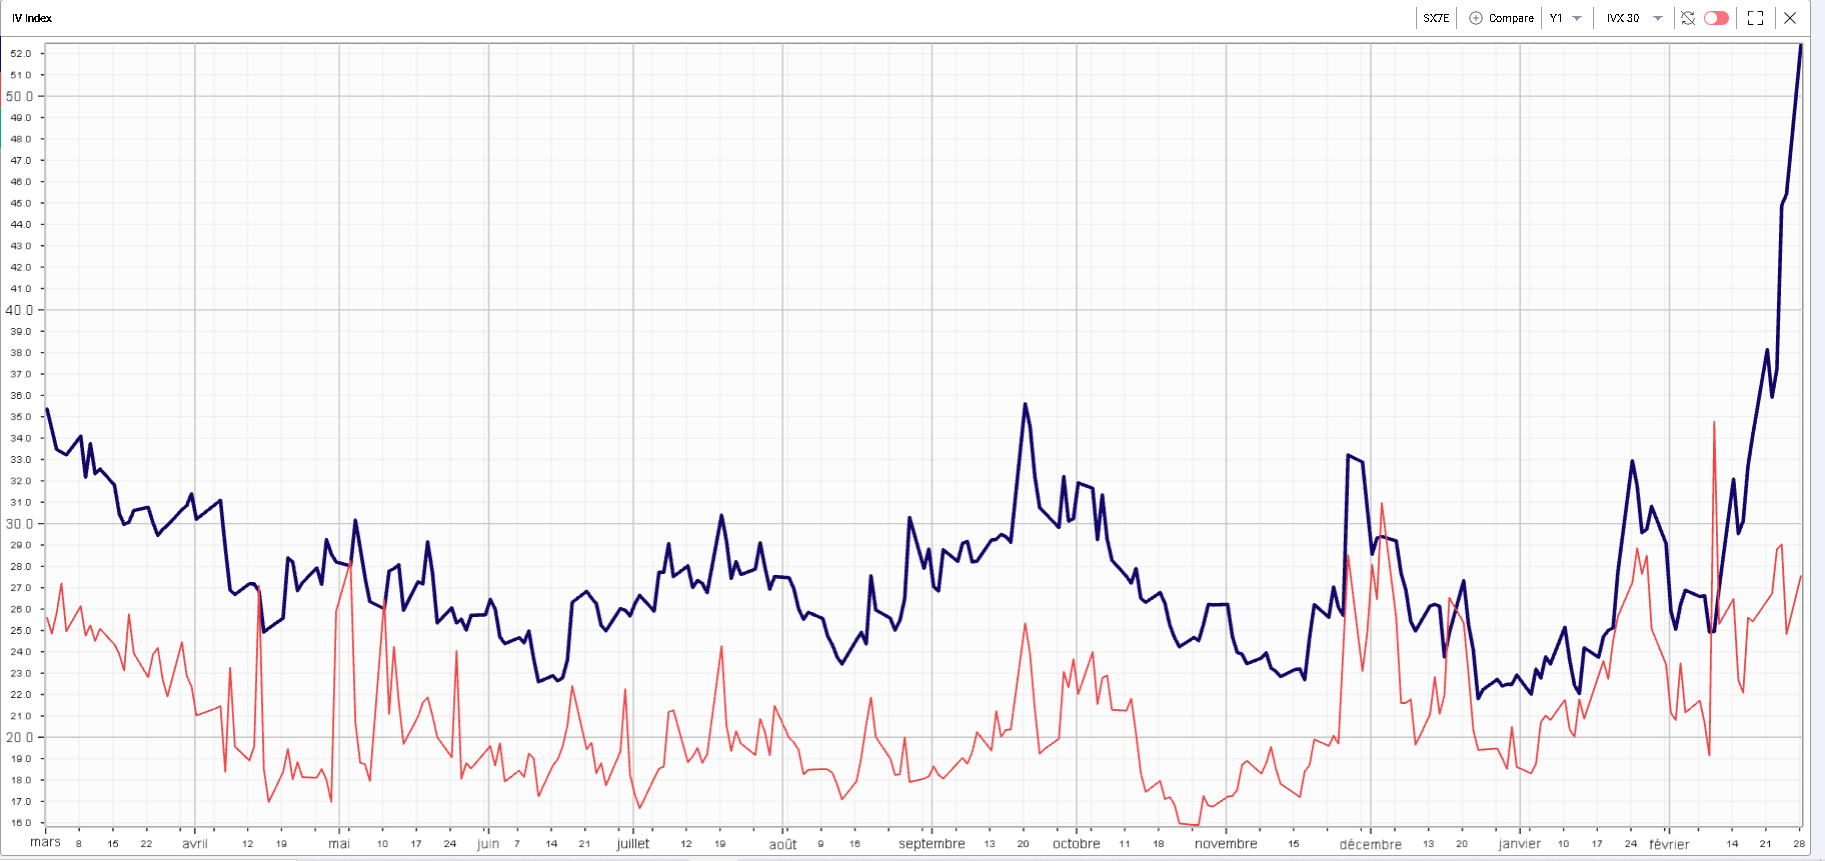
No better chart illustrates the divergence in how markets perceive risks between Europe and the US than the 30d IVX for European Banks (SX7E) compared to US Banks (XLF). |
SX7E 30d IVX in blue – XLF 30d IVX in red |
Over the last 12 months, we can see that, while European Banks remained more volatile than their US counterparts, the spread was relatively steady. It has completely exploded as the geopolitical tensions continue to rise. This trend is also visible on major and well diversified headline indices such as the Euro Stox 50 (SX5E) when compared to the SPX. |
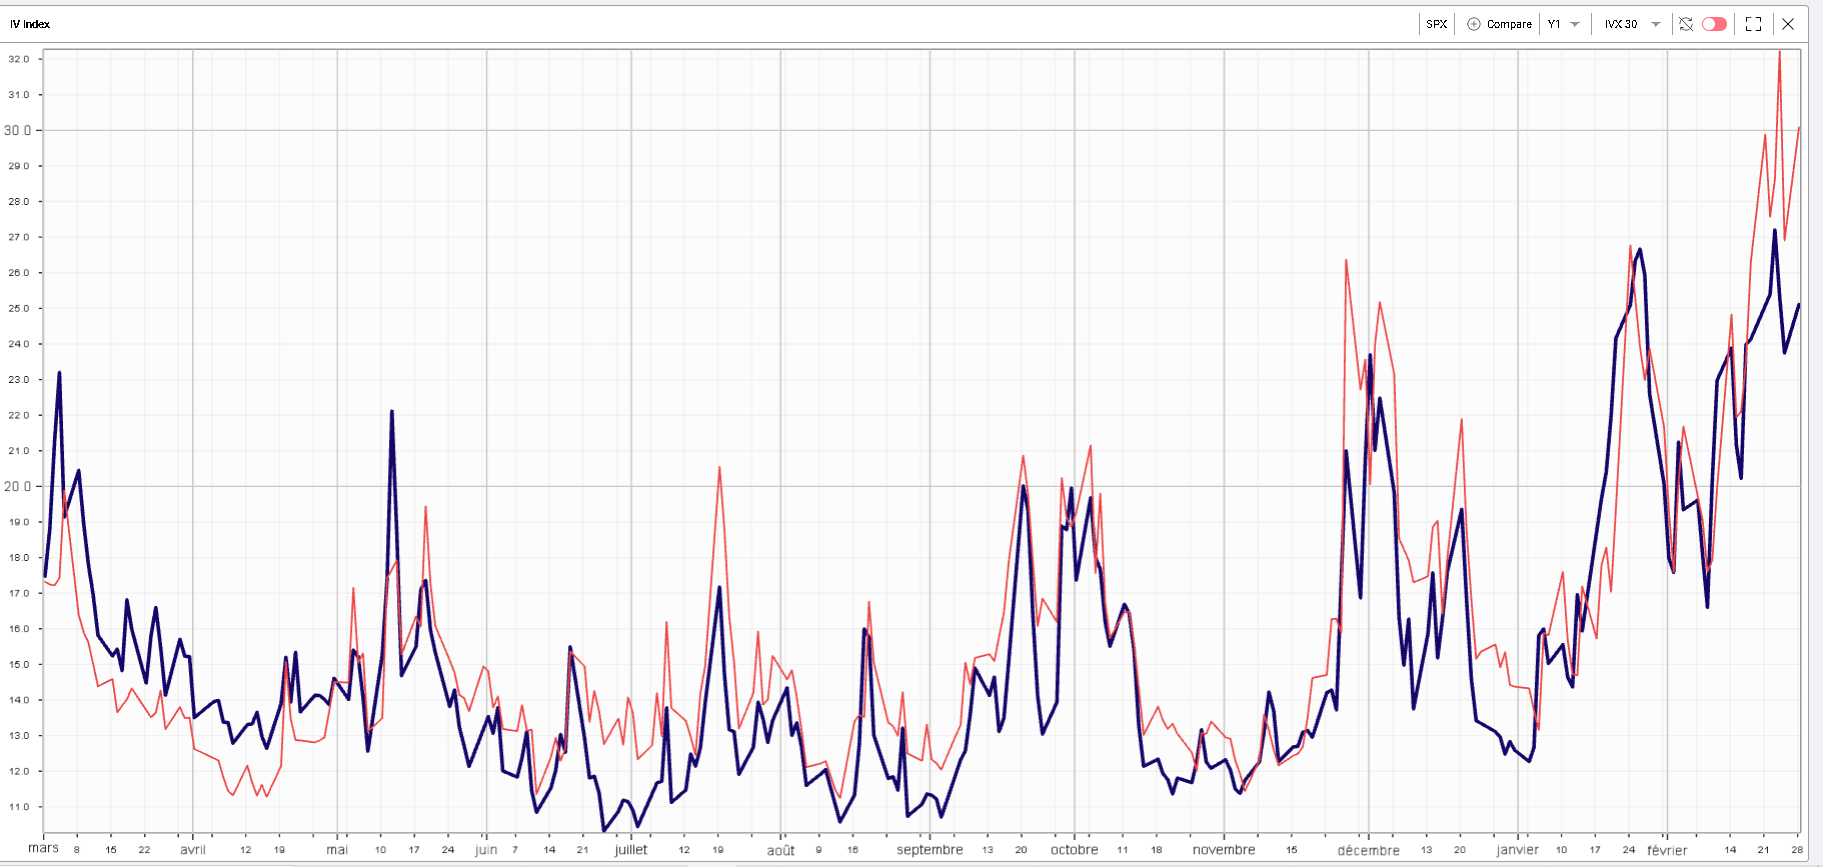
SPX 30d IVX in blue – SX5E 30d IVX in red |
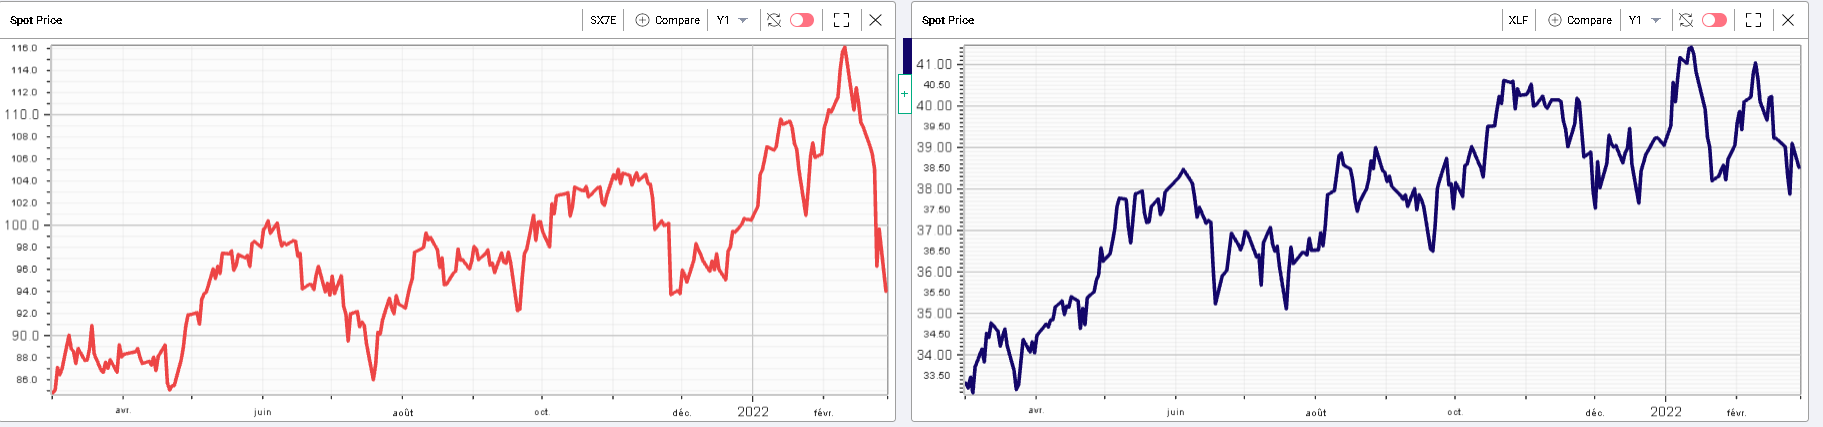
The following chart shows the difference between the performance over the past few weeks of European banks (in red) compared to that of US banks (in blue). |
|
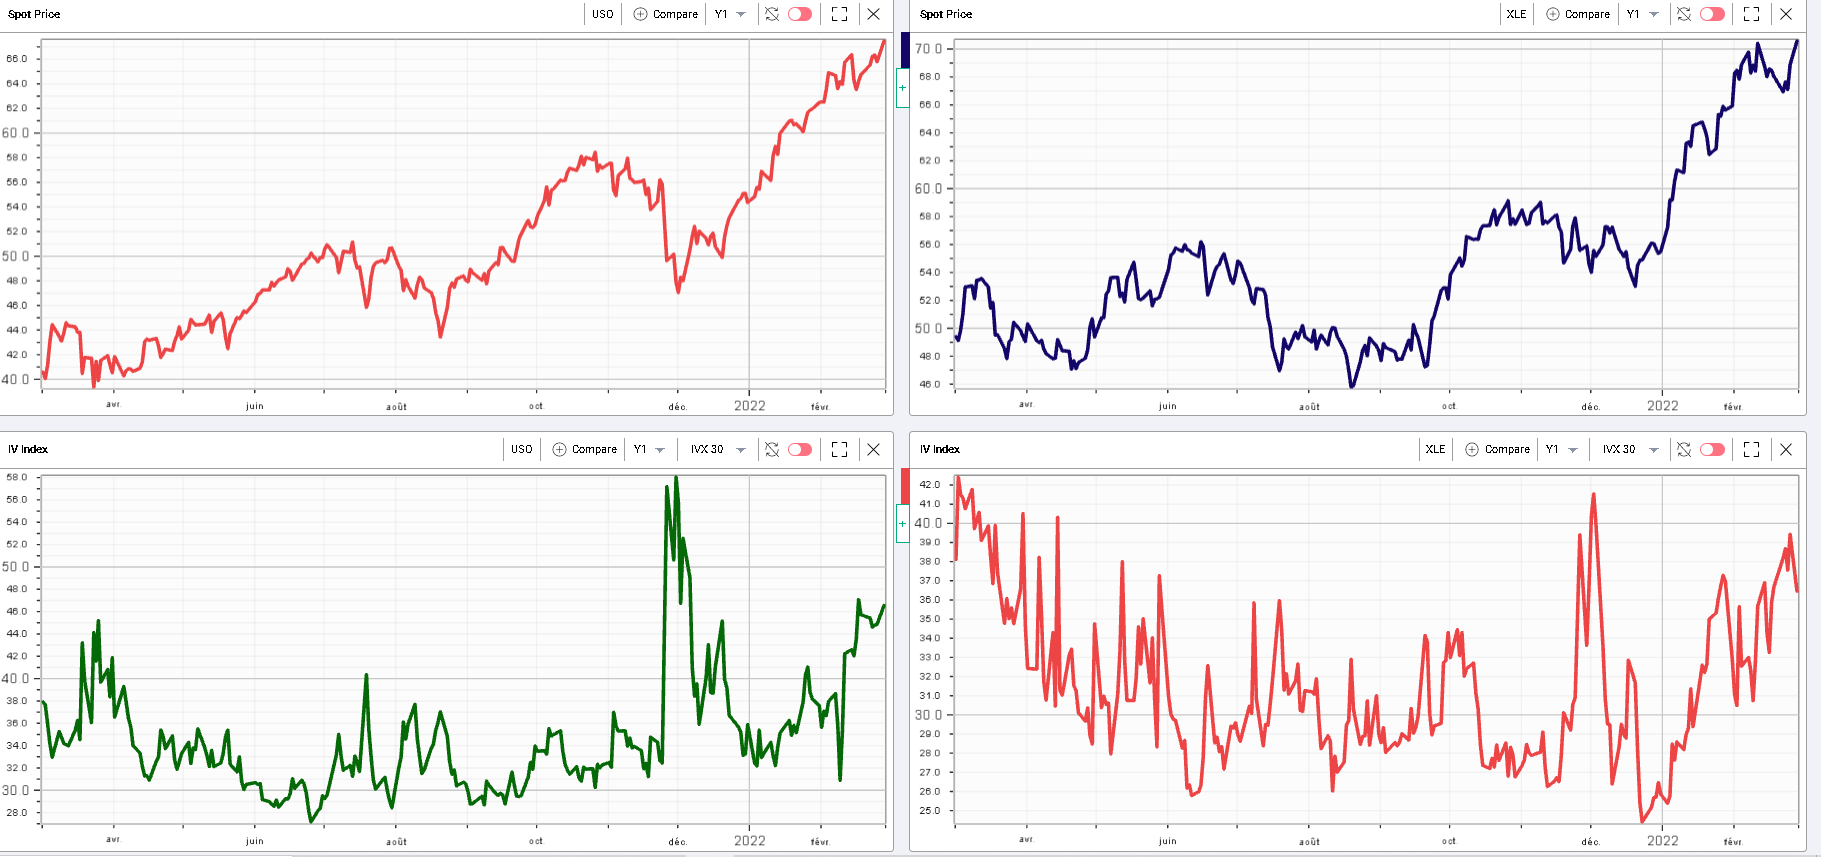
In the commodities space, the USO ETF continues to grind higher as Crude Oil approaches $100 per barrel. The XLE, the energy ETF has been going up as well while both USO and XLE 30d IVX have been grinding higher but remaining far below the highs seen towards the end of 2021. |
|
Despite this apparent stability at the index level in particular in the United States, the degree of dispersion between the performance of single stocks remains elevated, creating an attractive environment for stock pickers and single stock traders. |
Yesterday for instance saw JPM and C both finish about 4% lower while TSLA and LMT were about 7% higher. |
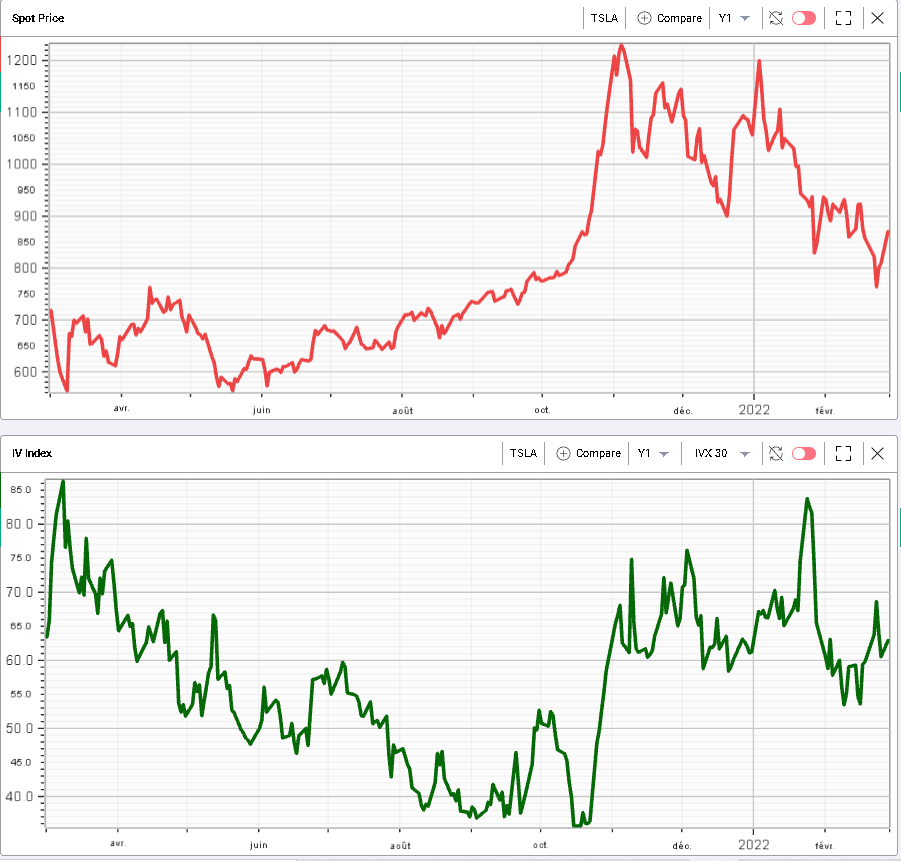
On Tesla, the talk centered around the possibility of the current geopolitical tensions forcing an acceleration towards electric vehicle adoption as crude oil prices continue to increase. The below chart illustrates that the stock remains far off its highs of last year while the 30d IV index remains around the 60% mark. |
|
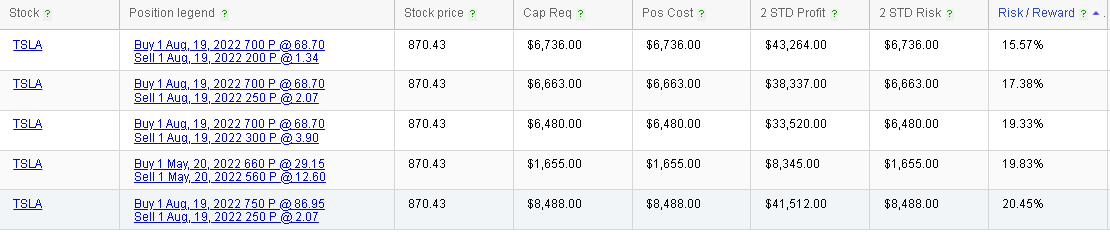
Traders looking to gain exposure on the upside in the name may find a lot of valuable information in our RT Spread Scanner. The system highlights the below bull vertical spreads as offering the most attractive risk to reward ratios for mid-term plays. |
|
At the same time, traders looking to fade this move can scan for bearish structures such as bear vertical spreads. The RT Spread Scanner highlights the following strategies as being the most appealing from a risk/reward perspective. |
|
| Disclaimer - This information is provided for general information and marketing purposes only. The content of the presentation does not constitute investment advice or a recommendation. IVolatility.com and its partners do not guarantee that this information is error free. The data shown in this presentation are not necessarily real time data. IVolatility.com and its partners will not be liable for any loss or damage, including without limitation, any loss of profit, which may arise directly or indirectly from the use or reliance on the information. When trading, you should consider whether you can afford to take the high risk of losing your money. You should not make decisions that are only based on the information provided in this video. Please be aware that information and research based on historical data or performance do not guarantee future performance or results. Past performance is not necessarily indicative of future results, and any person acting on this information does so entirely at their own risk. |