We offer multiple professional grade services to help you gain insight on volatility trading. Do not hesitate to try our products FOR FREE by clicking HERE |
The Market Update is a daily newsletter written by the team at iVolatility.com. Leveraging our analytics and data we are able to update you on key developments in the volatility market. To receive the Market Update directly into your inbox, please open a free account or visit our SITE where it is published every day. |
Market Update: 2022-03-02 |
Before we start talking about markets, for traders who are interested in getting historical market data, please note that Ivolatility.com is currently running at 30% discount on all historical data purchases and 10% discount on updates and API. Get in touch before the end of March via this FORM |
European equities continued to feel the pressure of the conflict between Ukraine and Russia with headline indices in Europe closing down about 4% on the day. In the US, stocks sold off but continue to remain more insulated from trader’s perspective with the SPX and NDX both closing about 1.5% lower. |
At the same time, implied volatilities continue to expand across all major EU and US indices with 30d IV about 6 points higher in Europe and about 3 points higher in the US. |
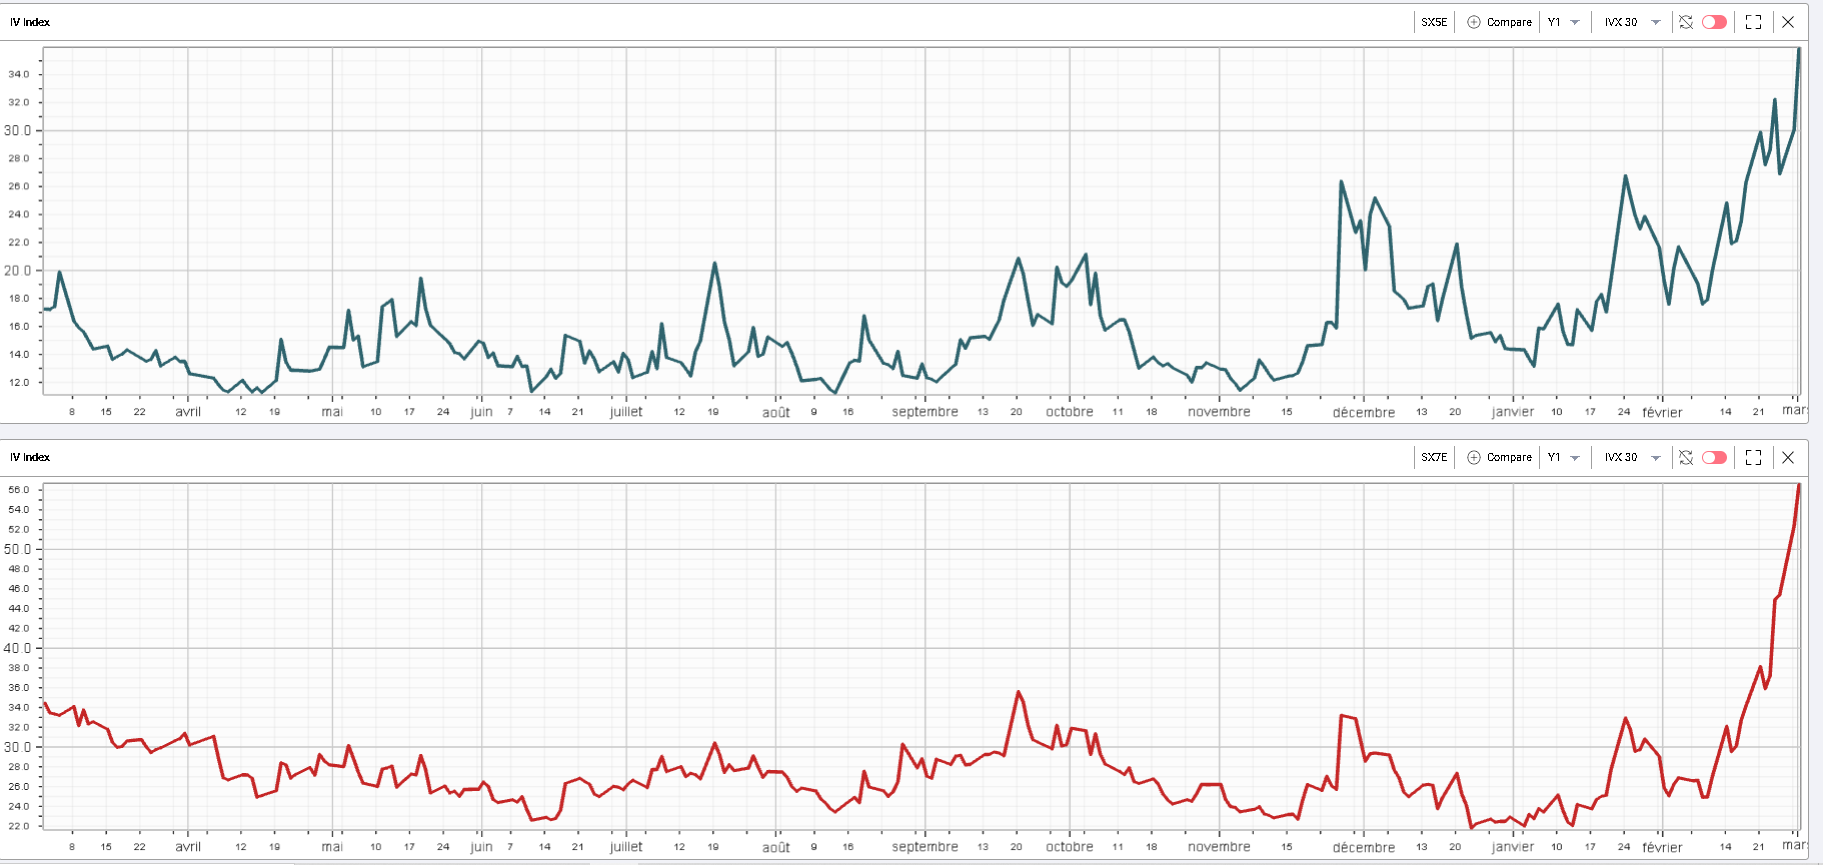
Interestingly the SX7E (Eurozone Banks) which is one of the most affected sectors in Europe and is down about 25% from its peak this year, saw its 30d IV underperform yesterday in comparison to the IV of wider indices like Euro Stoxx 50 or the DAX. The 30d IV in the SX7E was up only 4 points while the index itself closed down more than 6%. |
|
The chart above shows in blue the IVX30 for the SX5E and in red the IVX30 for the SX7E. The recent spike in the Banks shows that most traders got caught by surprise by the violent reaction in underlying prices and have very aggressively remarked implied volatilities higher. |
In that context, the underperformance yesterday of the SX7E implied volatility relative to more diversified headline indices such as the SX5E / DAX may be a sign that some are now considering that the premium for Banks over the wider market is too elevated. |
In the United States, the only sector that managed to eke out some gains was the energy space. The XLE closed about 1% higher with 30d IVs about 5 points higher as oil has not broken past the psychological $100 mark and seems to continue to squeeze violently reaching above $110 this morning. |
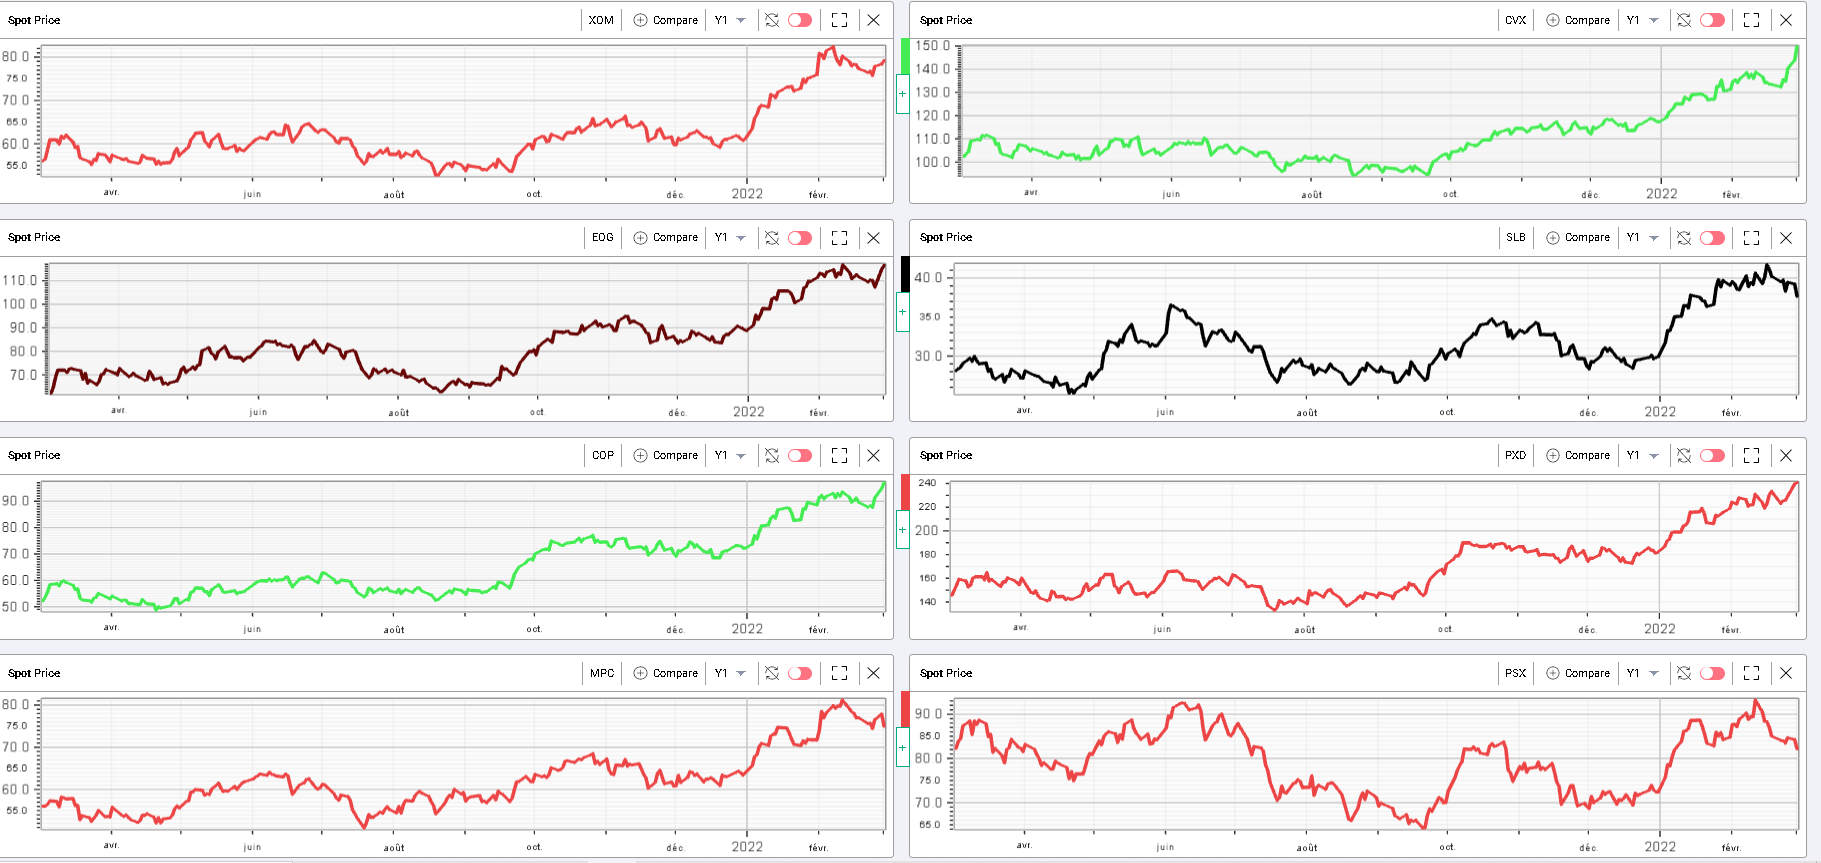
It remains vitally important to realize that even within that space not all stocks are equal. In fact, SLB was one of the worst performers across large caps finishing the day down 4% and with 30d IV up almost 6 points. On the other hand, CVX continues to proceed higher closing about 4% up for the day with a 30d IV that finished about 4 points higher as well. |
The following chart showing the 12 months history for the spot price of 8 of the largest companies in the energy space confirms that dispersion in performance. Almost all names gained on the initial rally in oil but as the impact of the sanctions became clearer, some turned away from their recent 12m highs while others continue to push higher. |
|
In other sectors, the performance of the XLF stands out with the ETF finishing almost 4% lower on the day and with 30d IV closing about 5 points higher. |
The price action in names like JPM remains very heavy. The stock reached a 12 months low yesterday and is down more than 20% from its 2022 peak. |
|
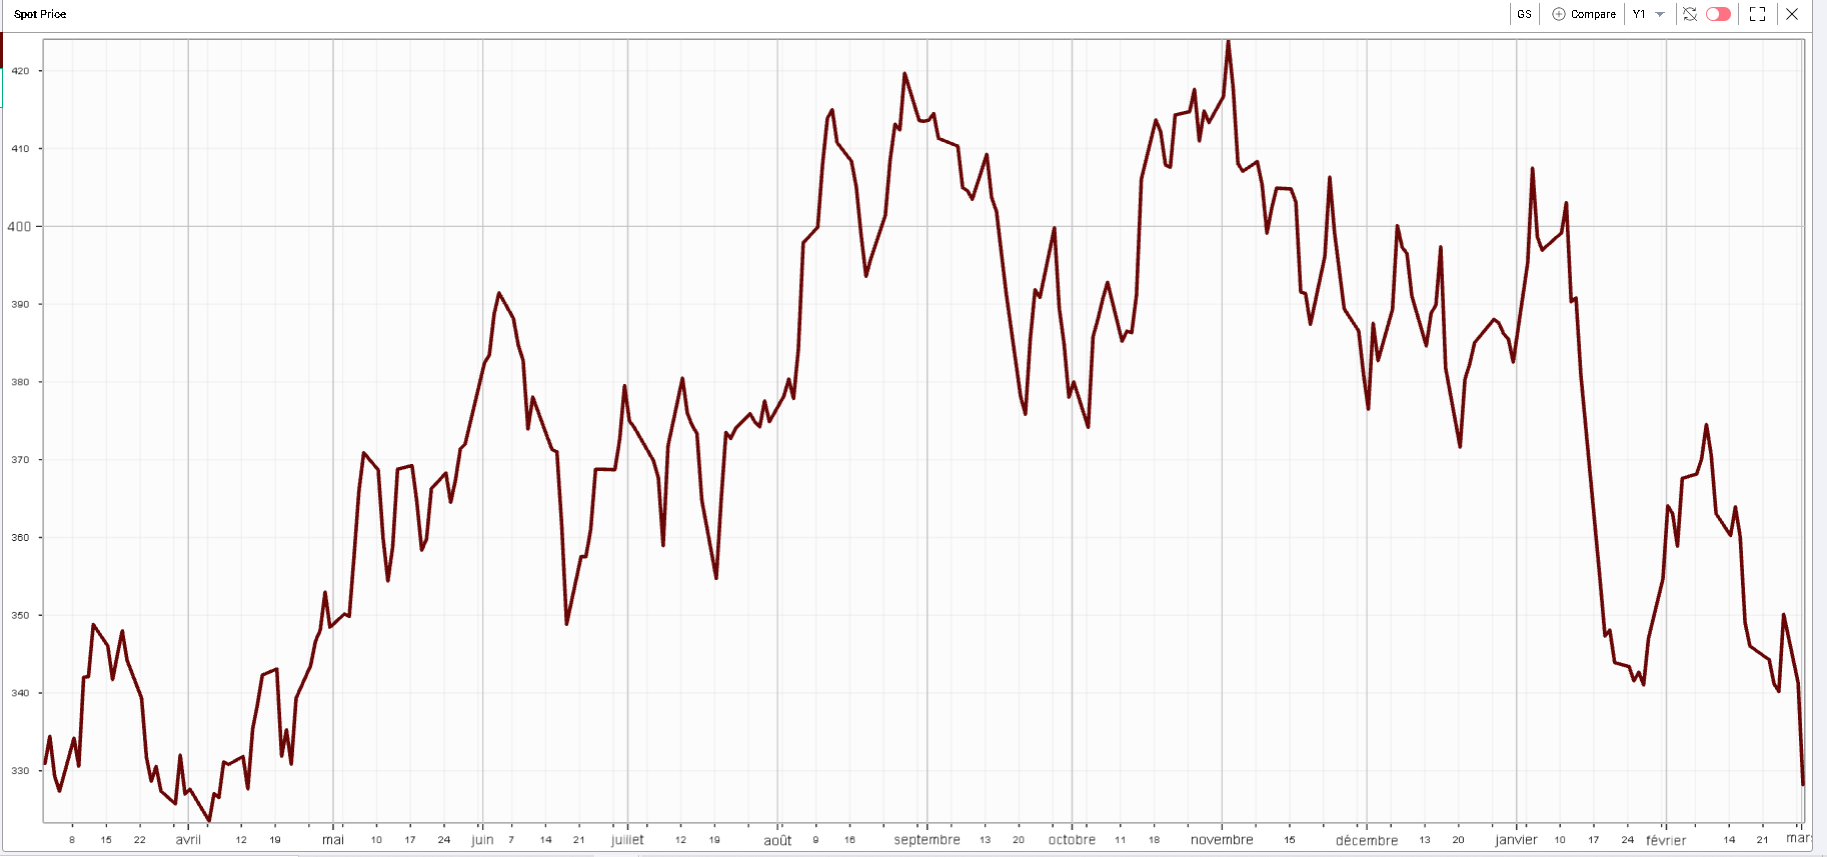
Even investment banks like GS remain under pressure despite higher volatility generally resulting in higher revenues for those businesses. |
|
The ramifications of the sanctions on Russia will take some time before becoming clear and traders remain highly concerned about the potential exposure that some companies might have. This is mostly visible in Europe with a handful of large caps closing more than 10% lower yesterday. Those include banks like ING. At time of writing, the Dutch lender is down almost 30% over the past 5 days. |
Other names impacted include aircraft makers AIRBUS and SAFRAN which both closed more than 10% down as flight restrictions are impacting overall sentiment. |
German companies who are known to be strong global exporters are also feeling the brunt of the recent developments. Continental, the German automotive parts maker closed down almost 10%. Volkswagen was about 8% lower and BMW about 4% down on the day. |
In the United States, multiple names were also under significant pressure. AMD suffered and finished about 7.5% lower on the day. AXP closed down 8% and SCHW finished 7.8% lower. Other impacted names include BKNG and GM both down about 5%. |
On a more positive note, TGT managed to gain about 10% on the back of its earnings and guidance while LMT pushes higher up about 5% on the day. |
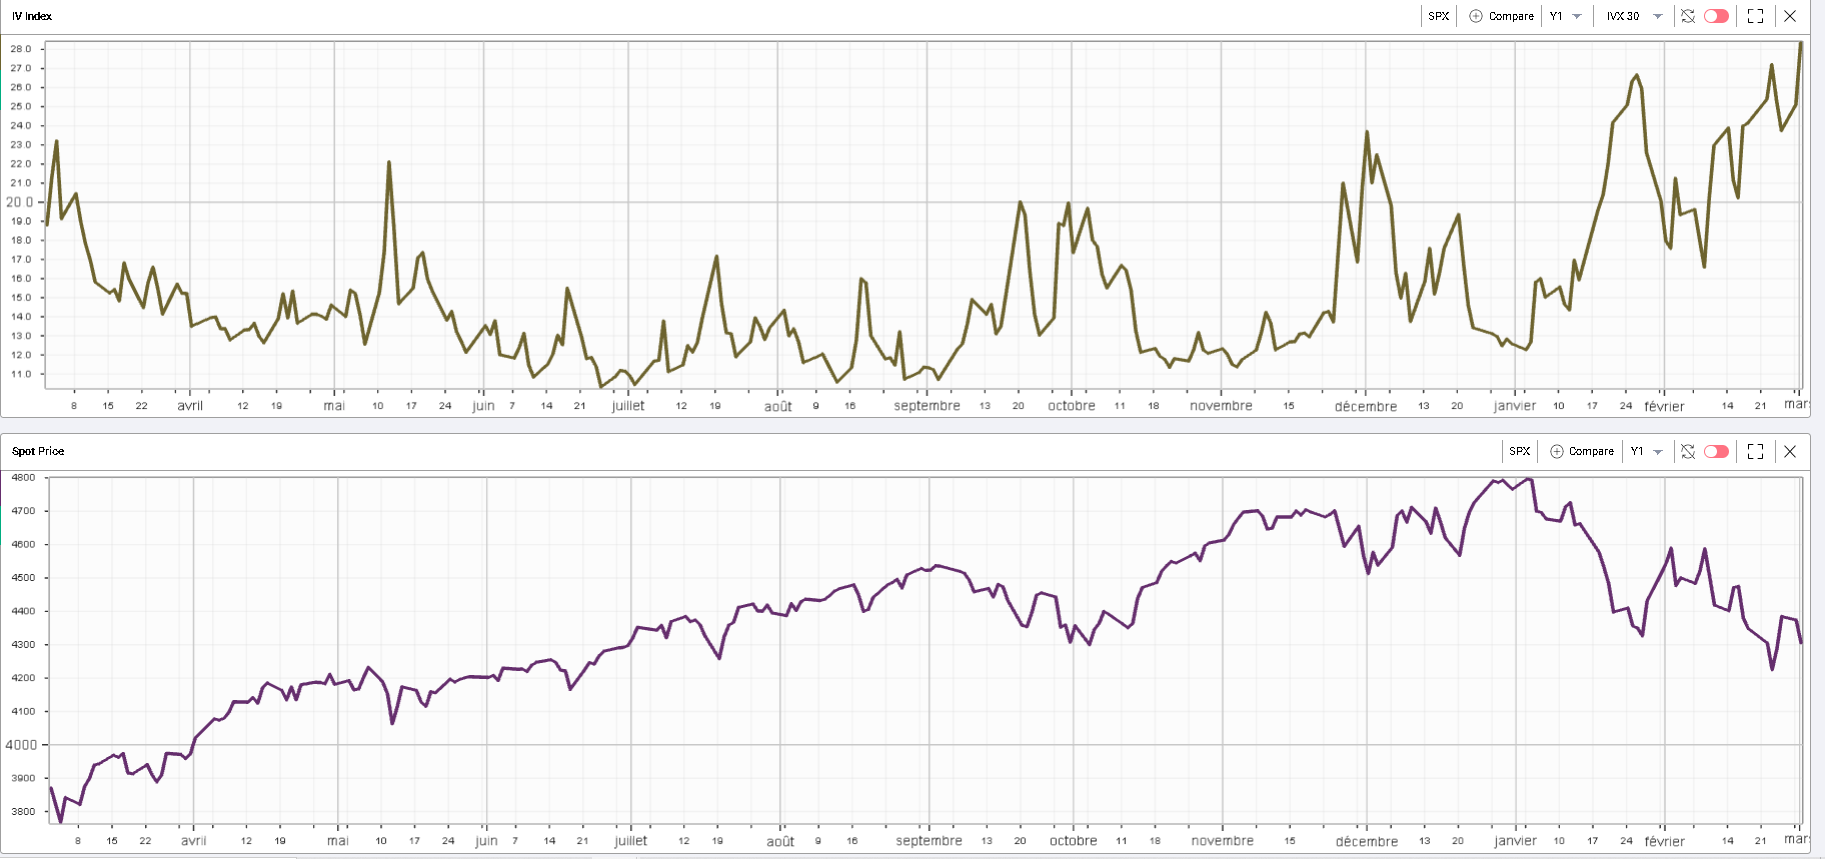
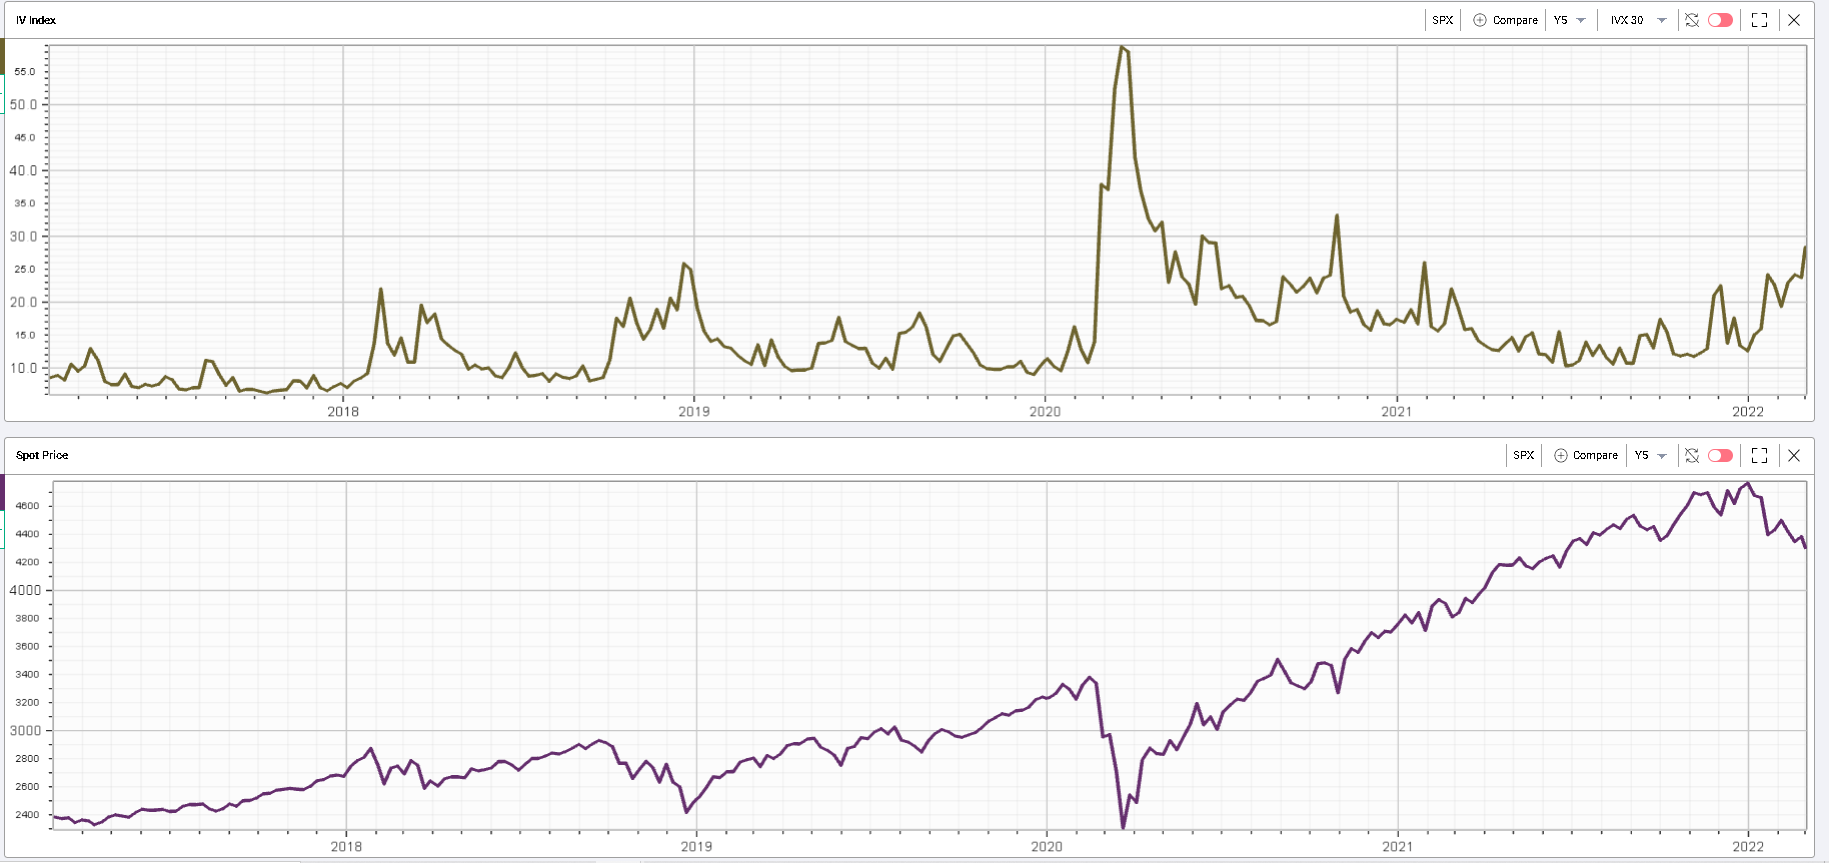
The two charts below show the disconnect that we are witnessing between implied volatility and spot prices at the moment. The top chart shows that 30d IVX has reached its highest level in the last 12 months while spot price reaction remains far more muted. |
|
Zooming out to a 5 years chart, we can see that the last time the 30d IVX for the SPX reached the level where it is trading now, the SPX index was itself printing levels closer to 3600. It goes without saying that the spot-vol relationship is pretty weak over long periods of time but it shows that the current worries in the options market continue to increase despite spot resilience. |
|
Disclaimer - This information is provided for general information and marketing purposes only. The content of the presentation does not constitute investment advice or a recommendation. IVolatility.com and its partners do not guarantee that this information is error free. The data shown in this presentation are not necessarily real time data. IVolatility.com and its partners will not be liable for any loss or damage, including without limitation, any loss of profit, which may arise directly or indirectly from the use or reliance on the information. When trading, you should consider whether you can afford to take the high risk of losing your money. You should not make decisions that are only based on the information provided in this video. Please be aware that information and research based on historical data or performance do not guarantee future performance or results. Past performance is not necessarily indicative of future results, and any person acting on this information does so entirely at their own risk. |