We offer multiple professional grade services to help you gain insight on volatility trading. Do not hesitate to try our products FOR FREE by clicking HERE |
The Market Update is a daily newsletter written by the team at iVolatility.com. Leveraging our analytics and data we are able to update you on key developments in the volatility market. To receive the Market Update directly into your inbox, please open a free account or visit our SITE where it is published every day. |
Market Update: 2022-03-03 |
Before we start talking about markets, for traders who are interested in getting historical market data, please note that Ivolatility.com is currently running at 30% discount on all historical data purchases and 10% discount on updates and API. Get in touch before the end of March via this FORM |
US indices managed to gain between 1.5% and 2% yesterday and 30d implied volatilities deflated to finish about 2.5 points lower on the day. |
Traders found comfort in a possible second round of talks between Ukraine and Russia when a ceasefire could be discussed while FED Powell acknowledged the likelihood of a rate hike in March but warned that the geopolitical tensions could have an impact on the pace adopted by the central bank. |
Sector wise, Financials were at the forefront of the move higher with the XLF finishing up more than 2.5% on the day. The Energy space continued its advance as Crude Oil broken $110 and finished up slightly more than 2% on the day. |
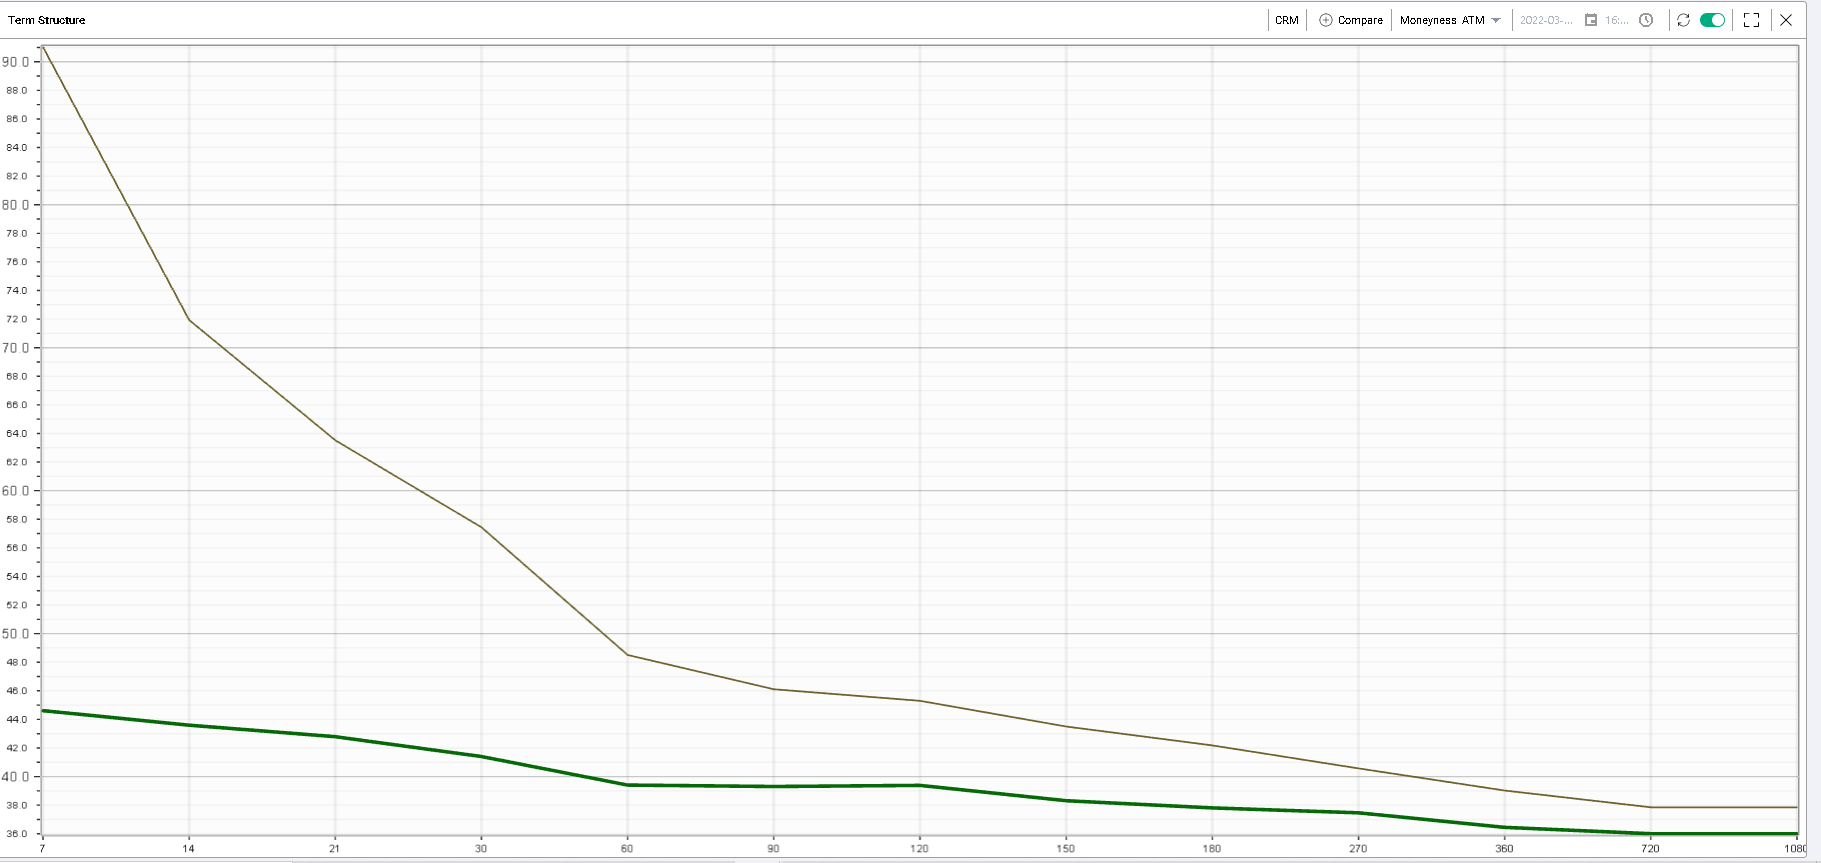
Within the DOW, INTC had one of the strongest performances up almost 4.5% while CRM illustrated how violent the IV crush can be following earnings with the stock finishing about 0.7% higher and with 30d IV down 16 points. |
|
The chart above shows the change of the IV for various terms with the volatility level as of Tuesday’s close in brown and the volatility as of Wednesday’s close in green. |
A lot of the stocks that suffered the most over the past few weeks saw a rebound yesterday. This was the case for US banks with JPM finishing up 2% on the day while its 30d implied volatility dropped almost 5 points yesterday. |
Looking at the below table from our Stock Monitor, we can see that JPM remains the name where implied volatility is the highest compared to its 12 months history. |
|
At the same time, its underlying spot price is trading very close to the 52 weeks lows. INTC on the other hand scans as having the lowest percentile (within the DJIA components) for its IV over the last 12 months while the underlying price is also very close to its 52 weeks lows. |
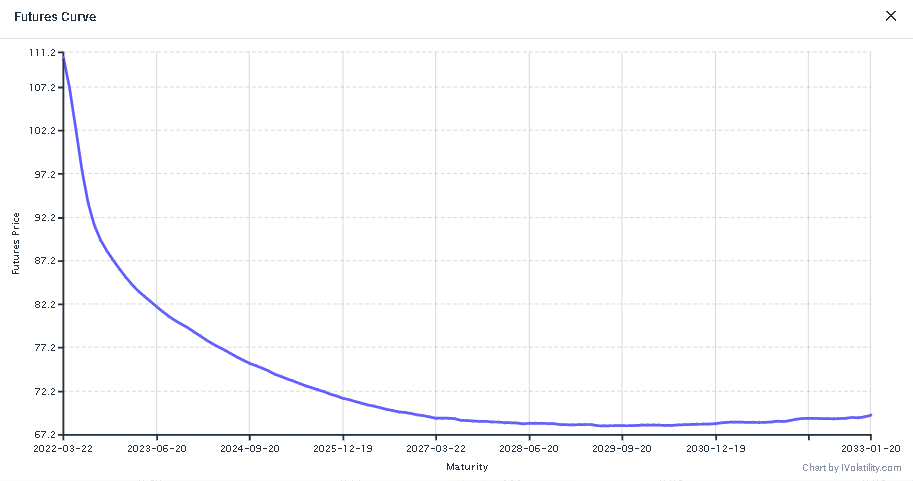
Oil remained in focus yesterday and traded above $110. The Futures curve is firmly inverted with the front-end settling above $100 while contracts from June onwards are trading below $100 already. In a way the oil market seems to be seeing the current oil price movements as transitory and mostly front-loaded with the possibility of "normalization" over time. |
|
It will be interesting to see how fracking companies react and if they see the current prices as attractive enough to restart their operations adding to the possible supply in the market. |
Over in Europe, the picture was a bit more mixed despite headline indices gaining almost 2% on the day. A lot of companies exposed to global growth remained under pressure with Volkswagen and BMW closing down about 2%. On the other hand, banks which have been selling off over the past few weeks managed to rebound slightly with BNP closing up 2% and INGA up more than 4%. |
All eyes will remain on tomorrow’s employment report as well as the possible outcome of the discussions between Ukraine and Russia. In the meantime, it seems that bonds will continue to act as a useful indicator of the general mood of the market. |
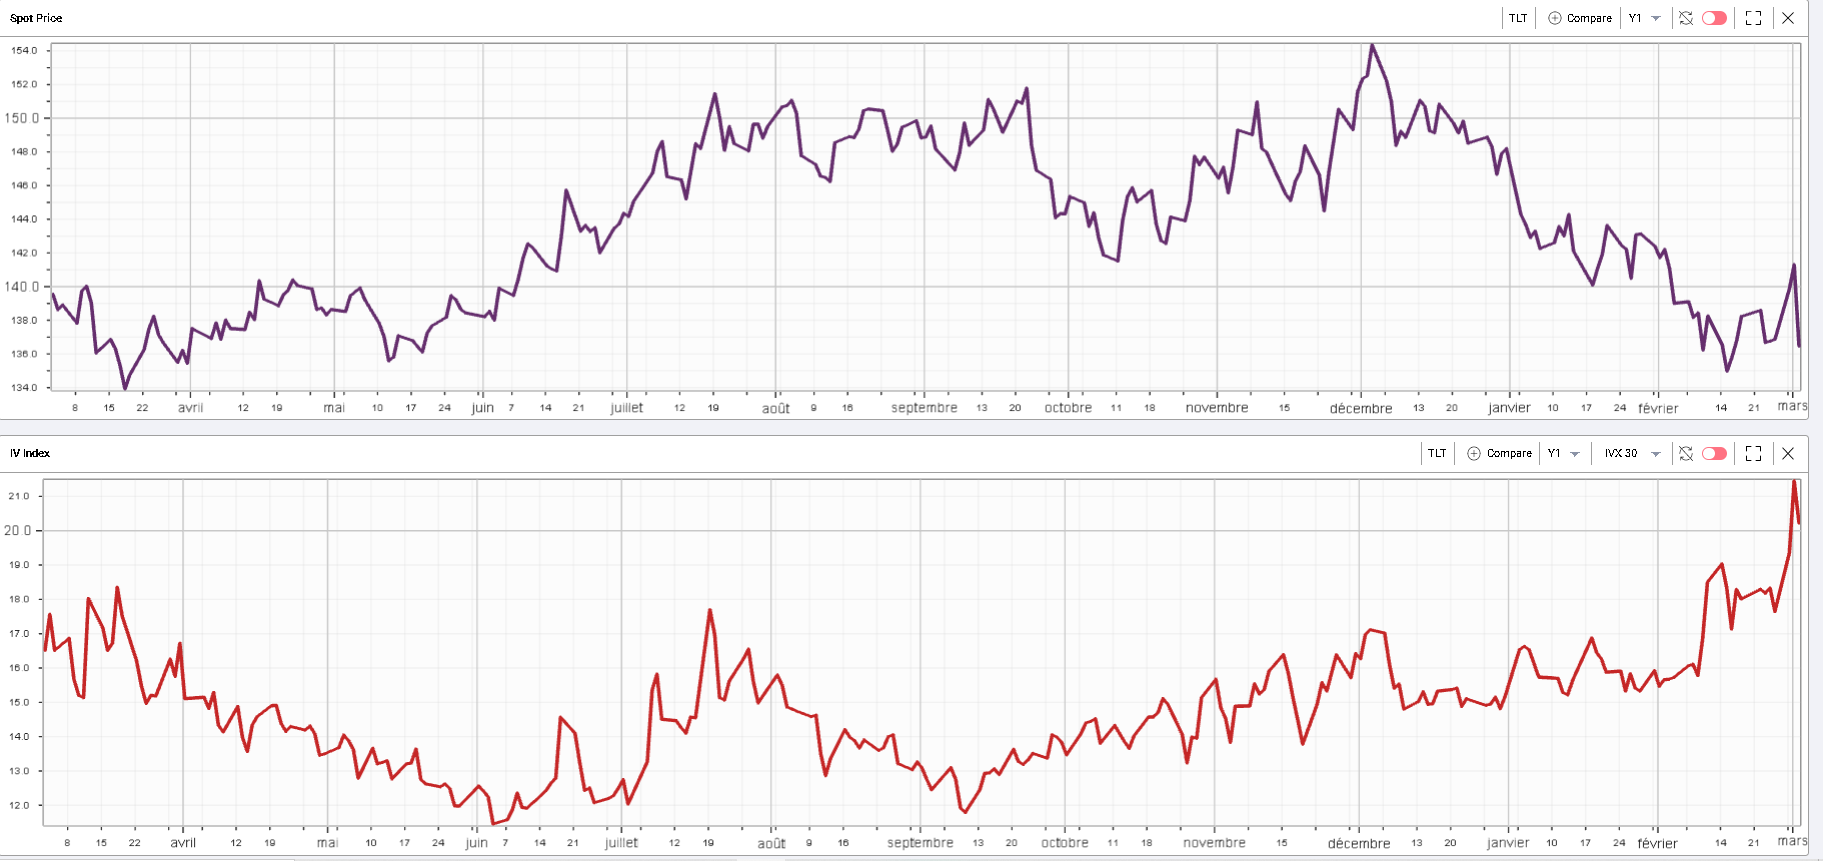
An ETF like TLT which aims to replicate the performance of a portfolio of bonds with remaining maturities greater than 20 years resumed its move lower yesterday. The selloff had been interrupted by the increase in geopolitical tensions as investors were happy to use it as a safe heaven. |
|
Do note that implied volatility in TLT remains very elevated and trades pretty much at its highest level of the last 12 months. That sign itself from Fixed Income investors should continue to act as a warning sign for Equity investors to remain vigilant in their trading. |
Disclaimer - This information is provided for general information and marketing purposes only. The content of the presentation does not constitute investment advice or a recommendation. IVolatility.com and its partners do not guarantee that this information is error free. The data shown in this presentation are not necessarily real time data. IVolatility.com and its partners will not be liable for any loss or damage, including without limitation, any loss of profit, which may arise directly or indirectly from the use or reliance on the information. When trading, you should consider whether you can afford to take the high risk of losing your money. You should not make decisions that are only based on the information provided in this video. Please be aware that information and research based on historical data or performance do not guarantee future performance or results. Past performance is not necessarily indicative of future results, and any person acting on this information does so entirely at their own risk. |