We offer multiple professional grade services to help you gain insight on volatility trading. Do not hesitate to try our products FOR FREE by clicking HERE |
The Market Update is a daily newsletter written by the team at iVolatility.com. Leveraging our analytics and data we are able to update you on key developments in the volatility market. To receive the Market Update directly into your inbox, please open a free account or visit our SITE where it is published every day. |
Market Update: 2022-03-04 |
Before we start talking about markets, for traders who are interested in getting historical market data, please note that Ivolatility.com is currently running at 30% discount on all historical data purchases and 10% discount on updates and API. Get in touch before the end of March via this FORM |
European indices resumed their selloff yesterday while their US counterparts continued to outperform. The German DAX finished down almost 2.5% while the SPX closed around 0.5% lower. |
Today will see the payroll numbers which will be highly scrutinized as being one of the last major data points available before the highly anticipated FOMC meeting on the 16th Mar’22. |
In today’s market update I want to take a step back and look at how things have broadly evolved over the past ten days both from a spot and a volatility perspective. |
When looking at the performance since the 17th February 2022, it is very clear that irrespective of the level of analysis that you adopt, you will find three categories of assets. Those that have been directly impacted by the geopolitical tensions, those that have broadly benefited from the paradigm shift and those that have been insulated. |
Looking at headline indices, we can see that European shares have on average been far more impacted than their US counterparts. The Germany DAX is down about 10% and the SX7E, an index tracking the top eurozone banks is down about 20% in 10 days. In comparison, US indices are only down about 2% over the same period. |
As a result, the difference in performance and realized volatility has translated into widening implied volatility conditions between Europe and the United States. Over the last 10 days, European headline indices saw their 30d IV expand by around 12 points while US headline indices saw a move higher of only a few points. |
As a result, the 30d IVX for the SPX has moved from 24 to 26 between the 17th Feb’22 and the 3rd Mar’22 while the 30d IVX for the DAX has moved from 22.9 to 35.6 during the same period. |
In Asia, the performance of Chinese stocks listed in Hong Kong has been very weak as well, pretty much in line with the performance of European assets while not being as directly exposed as EU companies. At the same time, the 30d IVX in the HSCEI is up only a few points, in line with the performance of US major indices from a volatility perspective, a strange hybrid situation overall. |
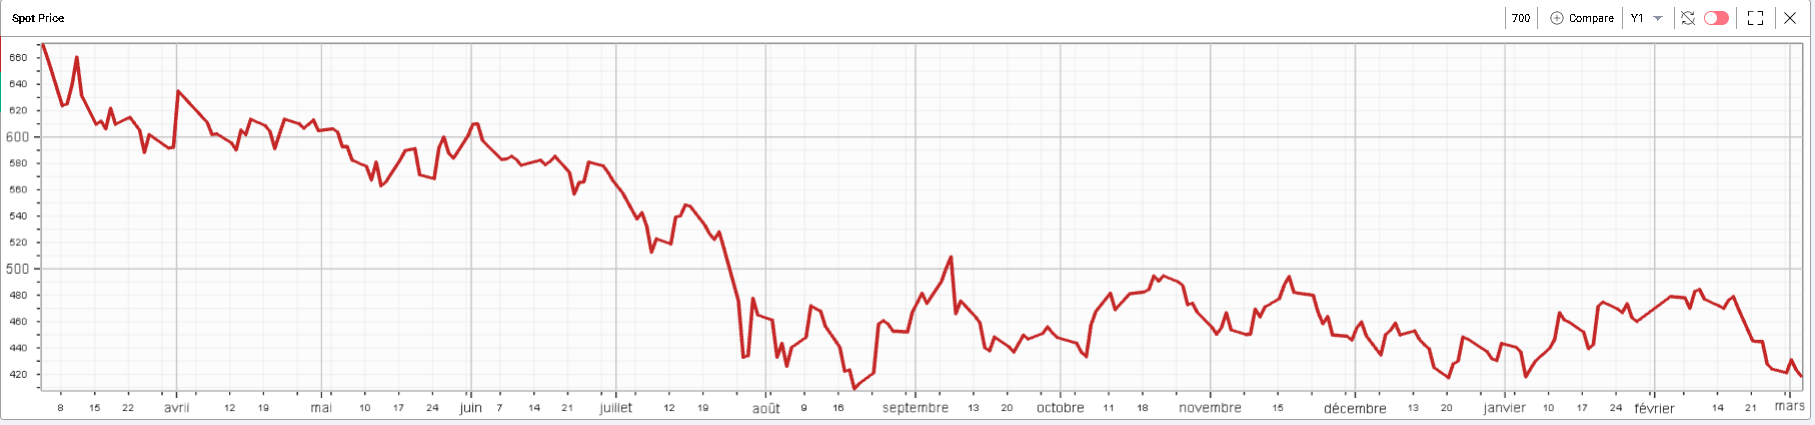
One possible explanation for this underperformance of Hong Kong shares seems to be the weak performance of tech companies as shown in the below spot prices charts. |
Tencent (700:HK) spot price over last 12 months |
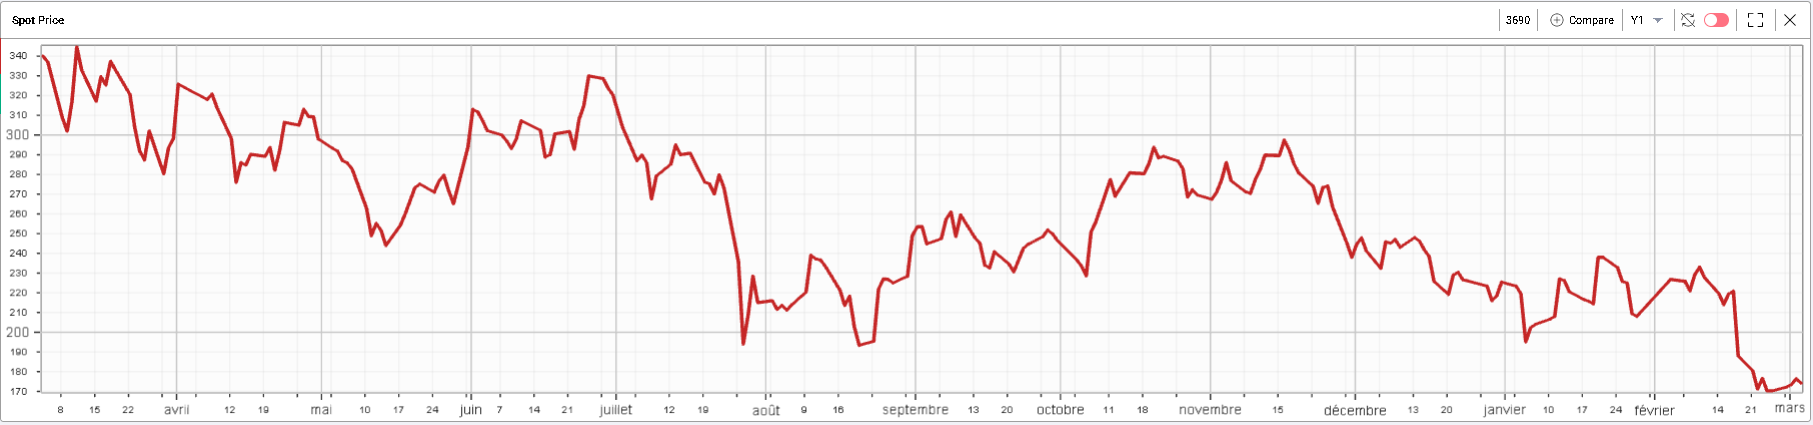
Meituan (3690:HK) spot price over 12 months |
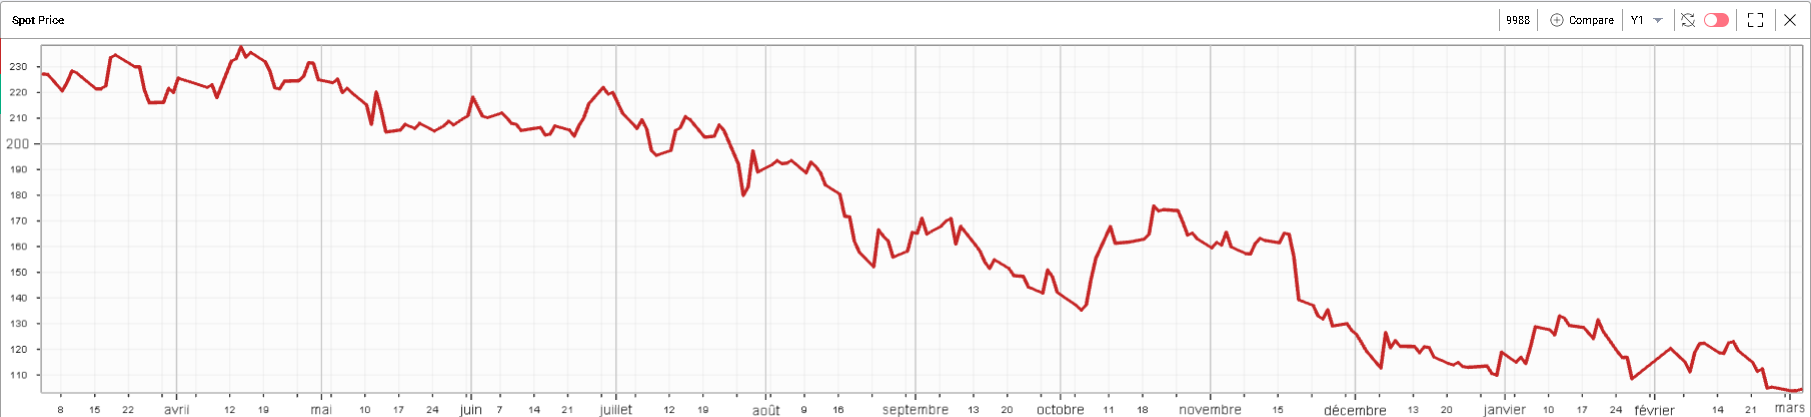
BABA (9988:HK) spot price over 12 months |
Beyond the geopolitical tensions, traders seem concerned about a possible increase in regulatory supervision on the space. This will be an interesting universe to keep watching especially as some of those Chinese stocks are also listed on the Nasdaq (BABA for example). |
Back in Europe, the underperformance of the DAX vs the SPX is worth putting in historical context. Over the past 10 days, the DAX underperformed the SPX by almost 10%. In historical context, since 1995, this is the 21st worst period of underperformance for the DAX vs the SPX. |
Bigger periods of underperformance for the DAX vs the SPX include September 2001, the 1998 Russian financial crisis, the 2020 pandemic and the beginning of 2008 when SocGen unwound the positions taken by Kerviel. |
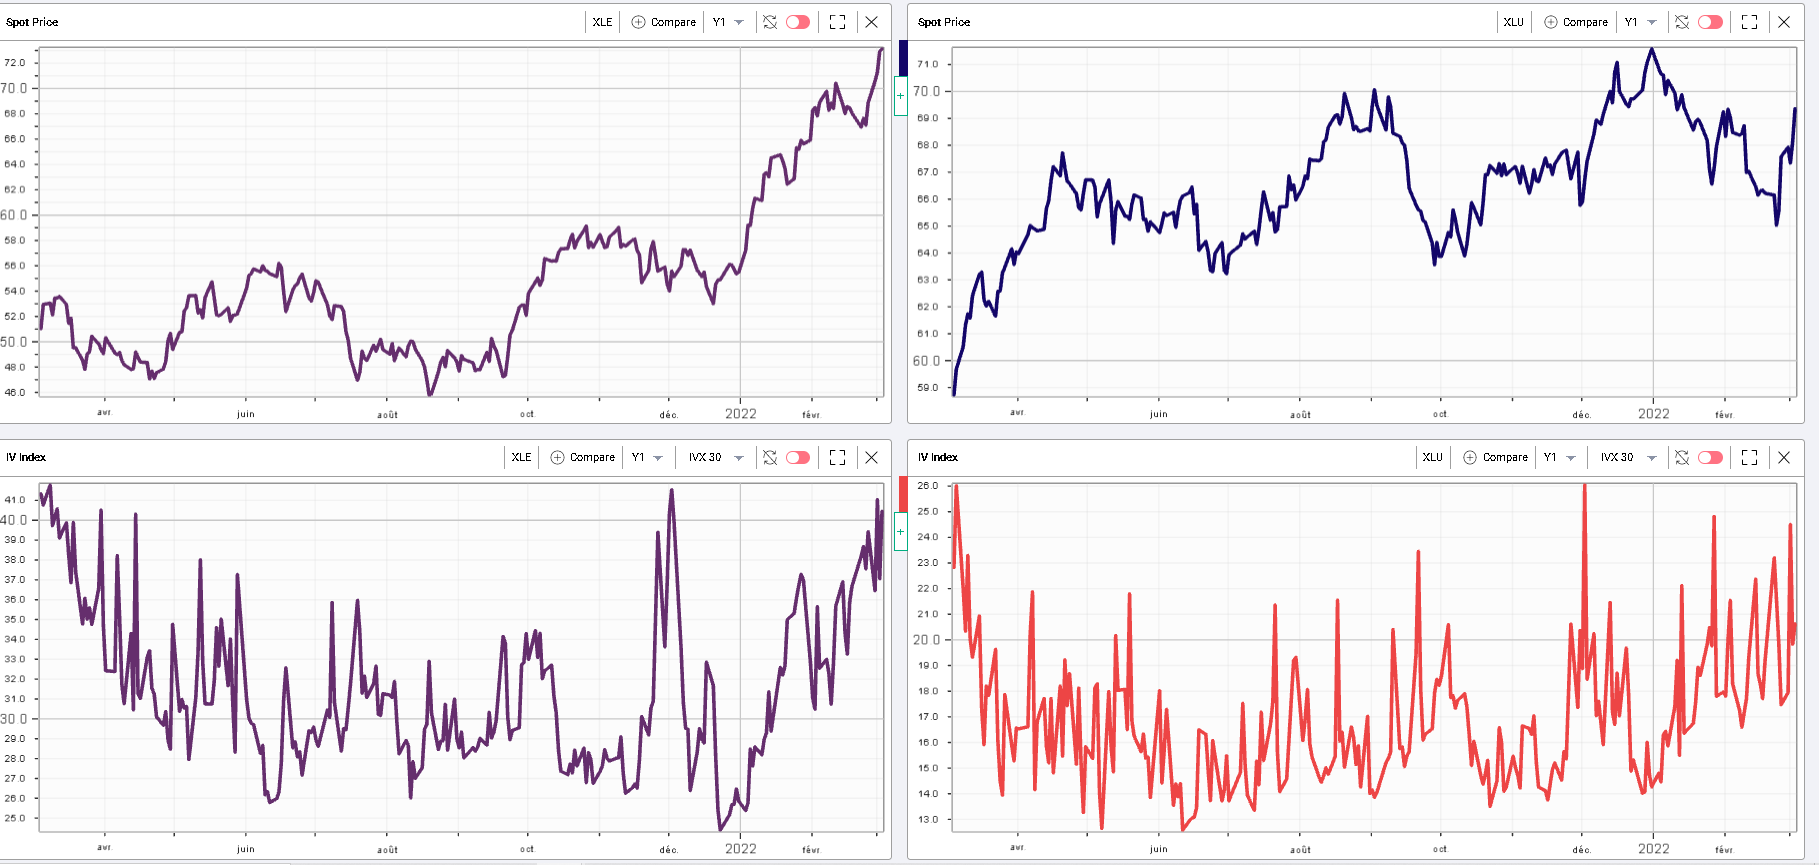
Looking at US sectors, we can see 4 sectors that really stand out. On the upside, the utilities and the energy space have both gained over the past 10 days with the XLE up more than 7% and the XLU up more than 4%. Interestingly for those ETFs, we saw a spot up, vol up scenario, a sign interpreted by some as evidence of nervousness from options traders about the capacity of the market to remain around the levels reached. |
The two top charts below show the spot prices of the XLE and the XLU while the bottom charts show the 30 days IVX for the XLE and the XLU. |
|
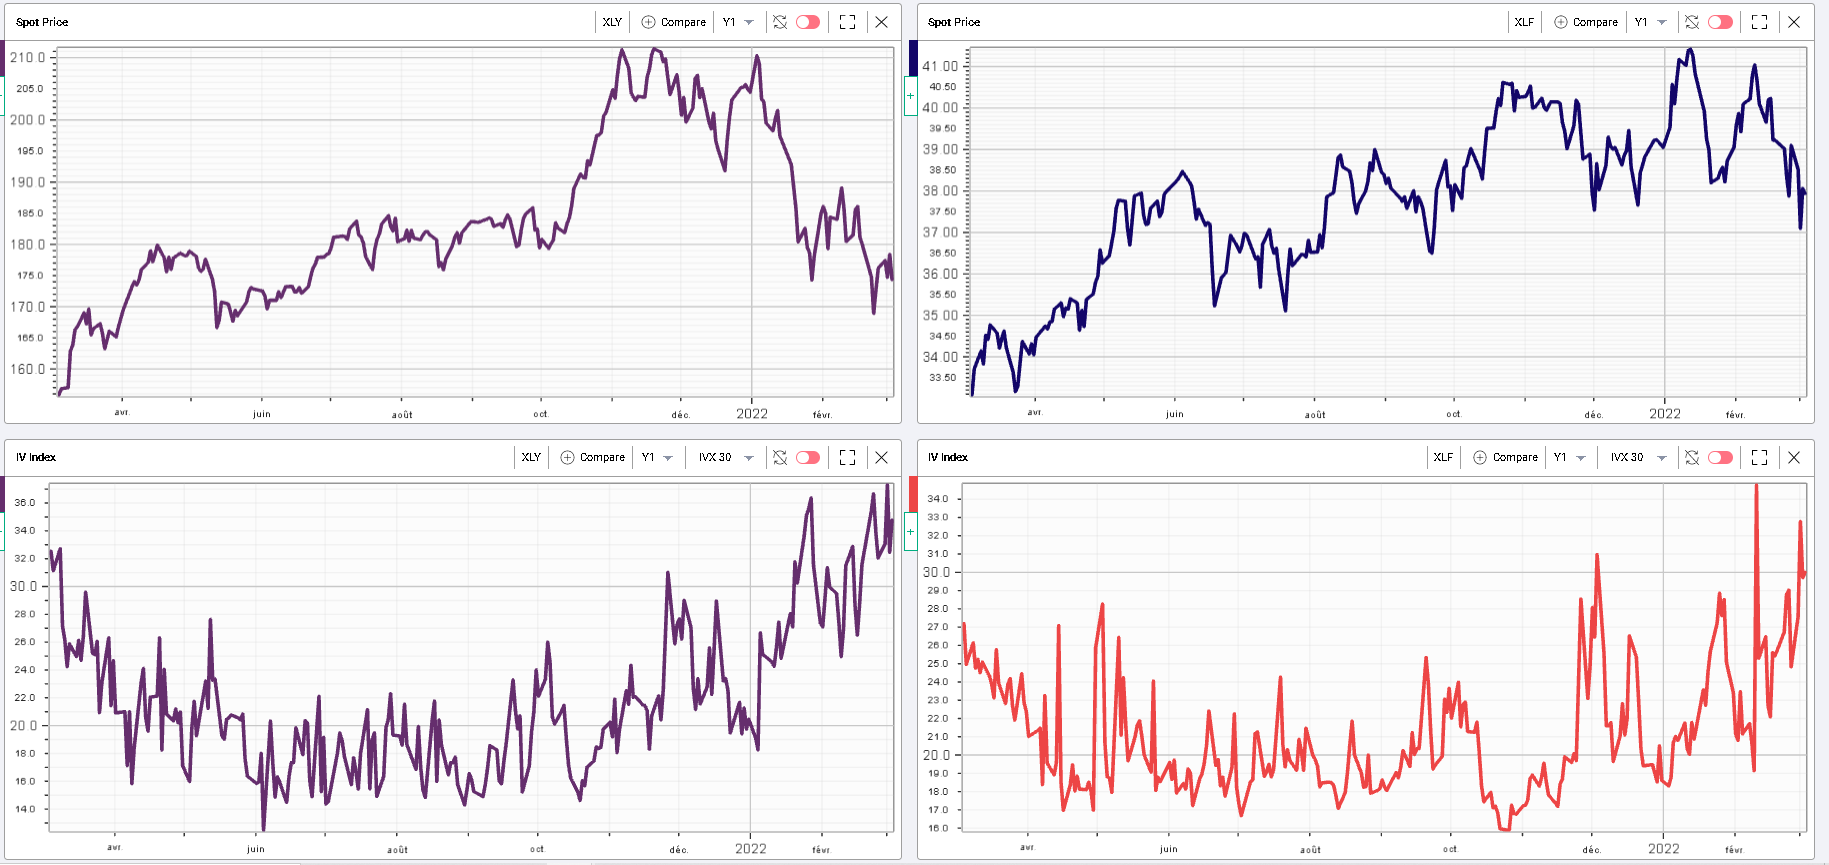
On the other hand, the consumer discretionary space as well as the banks have seen most of the selling pressure down around 4% over the past 10 days. For those ETFs as well, implied volatilities remarked higher with 30d IVX up more than 4 points in both sectors. Top charts below show the XLY and XLF spot prices while bottom charts show the XLY and XLF 30d IVX. |
|
The other 7 sectors were basically pretty unchanged both in spot and in implied volatility over the period. |
Turning on to US stock stories, we will focus mostly on components of the DJIA which is well diversified with a limited number of components allowing for a rapid understanding of the themes at play. |
Out of 30 components, 7 names sold off more than 5% over the past 10 days, 1 rallied more than 5% and the rest of the space was contained between -5% and +5%. On the implied volatility front, 7 names saw their 30d IVX drop over the past 10 days while the remaining 23 have seen their 30d IVX increase. |
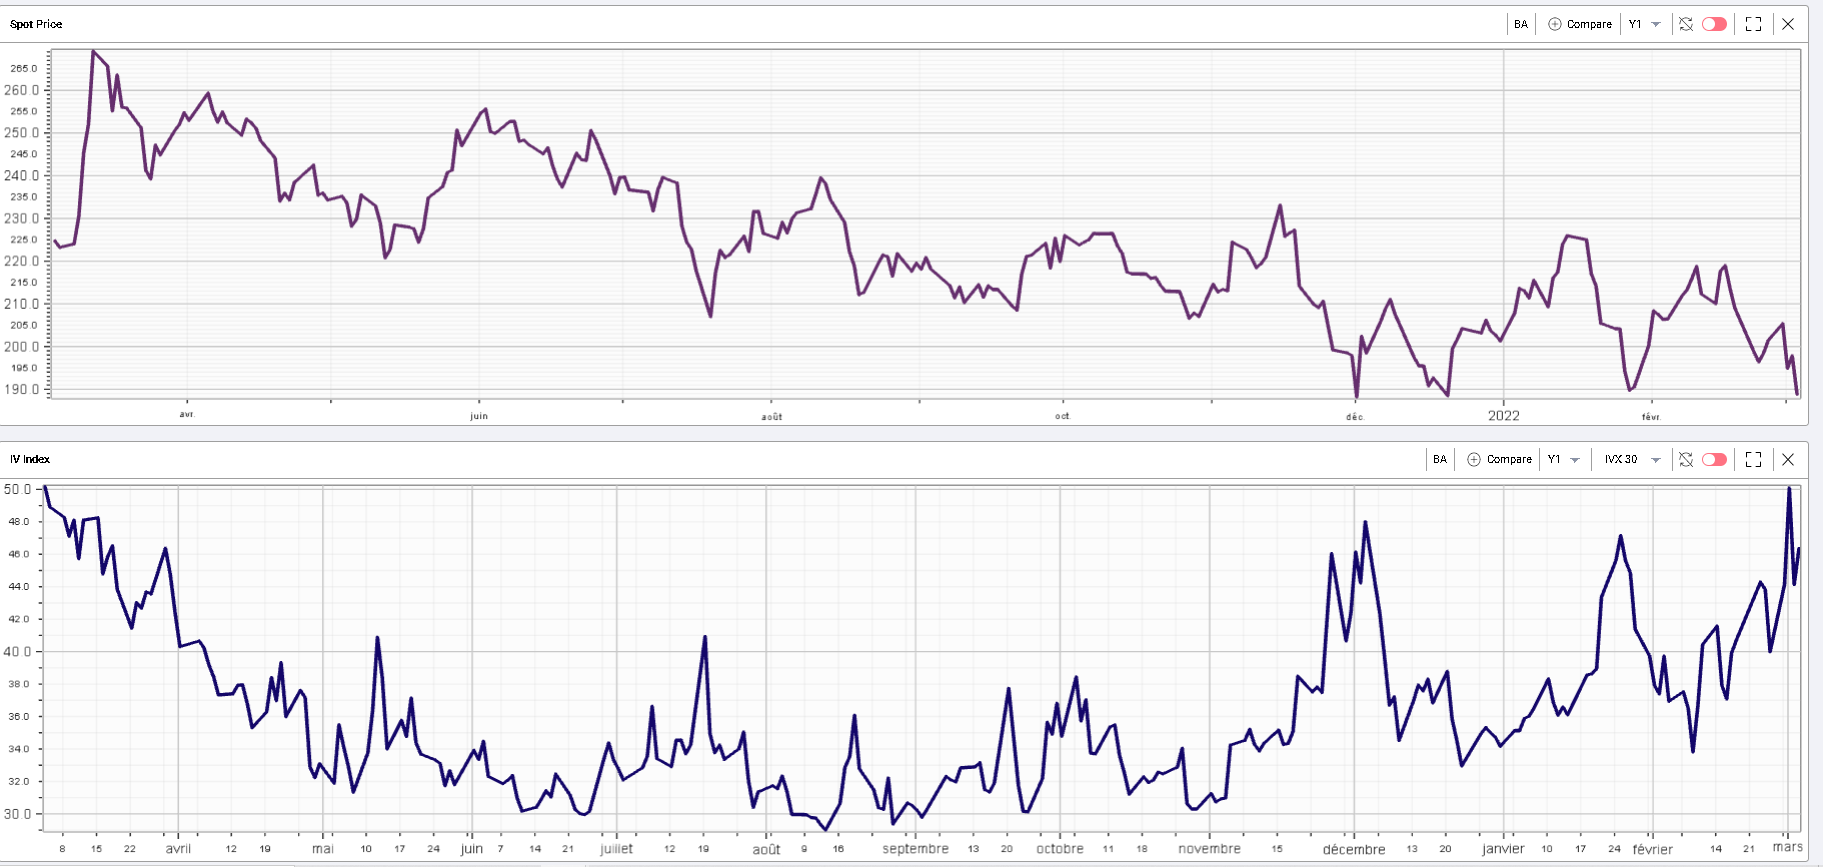
The most affected name has been BA as the company suspended its operations in Russia. The stock dropped more than 10% over the past 10 days and 30d IVX remarked about 5 points higher as shown on the chart below. |
|
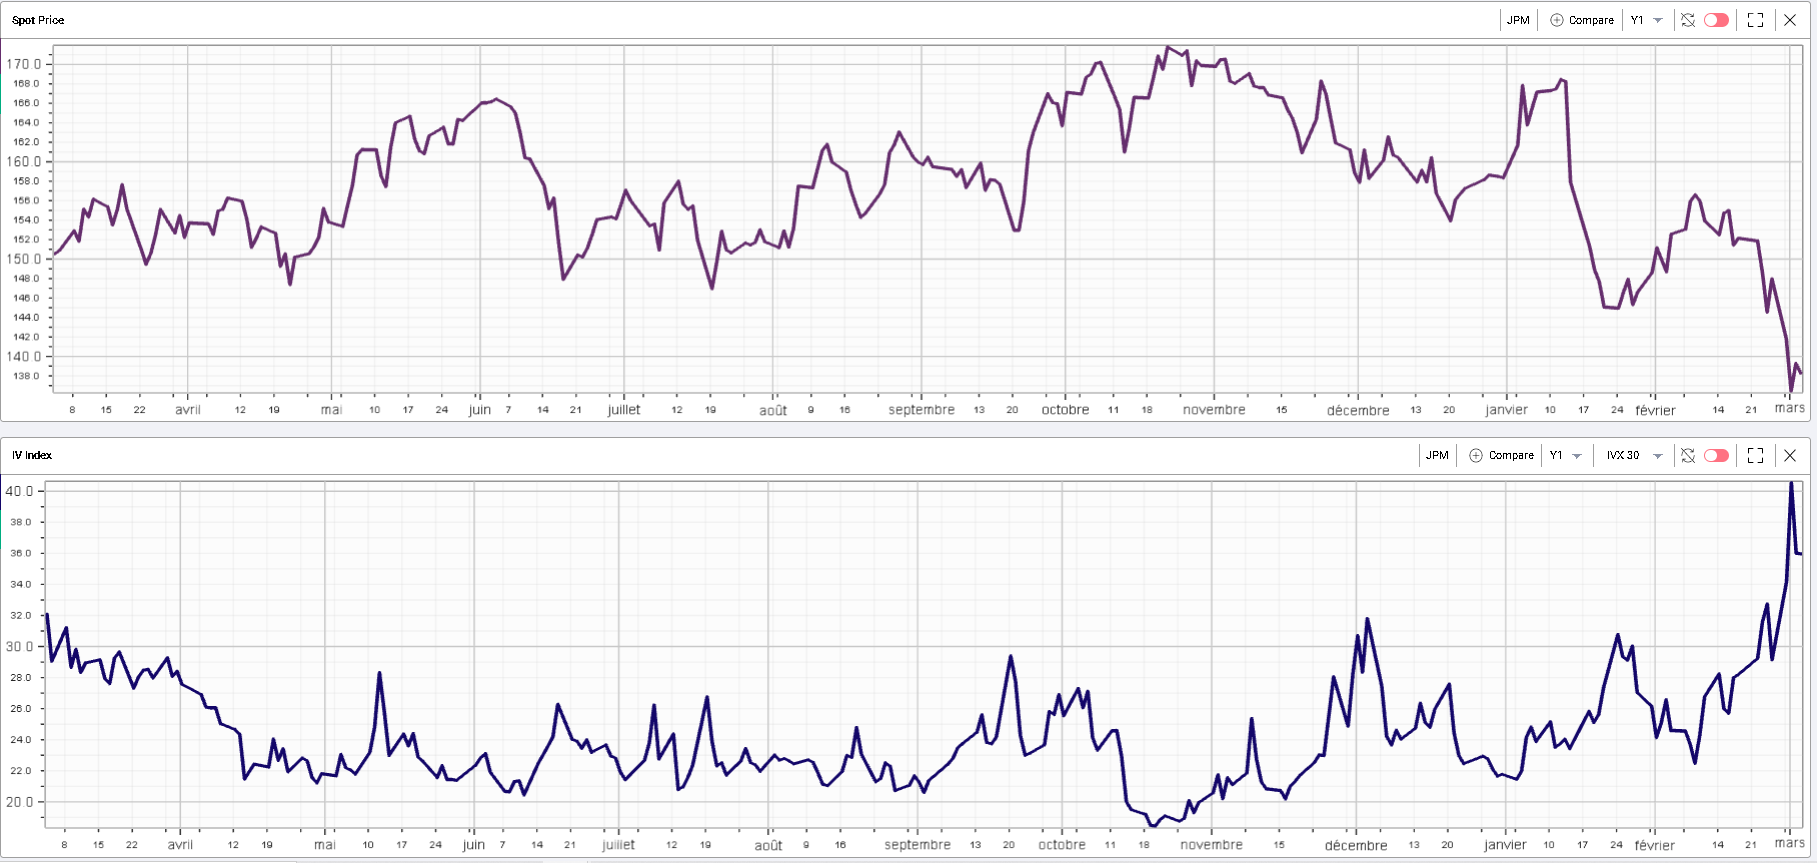
In the banking sector, JPM is down 10% over the last 10 days and its 30d IVX has increased by around 7 points. Â The market has been concerned about the possible exposure that US banks have to Russia and as such, traders have adopted a cautious approach with the stock. The below chart shows the 12 months 30d IVX for JPM against its 12 months spot price history. |
|
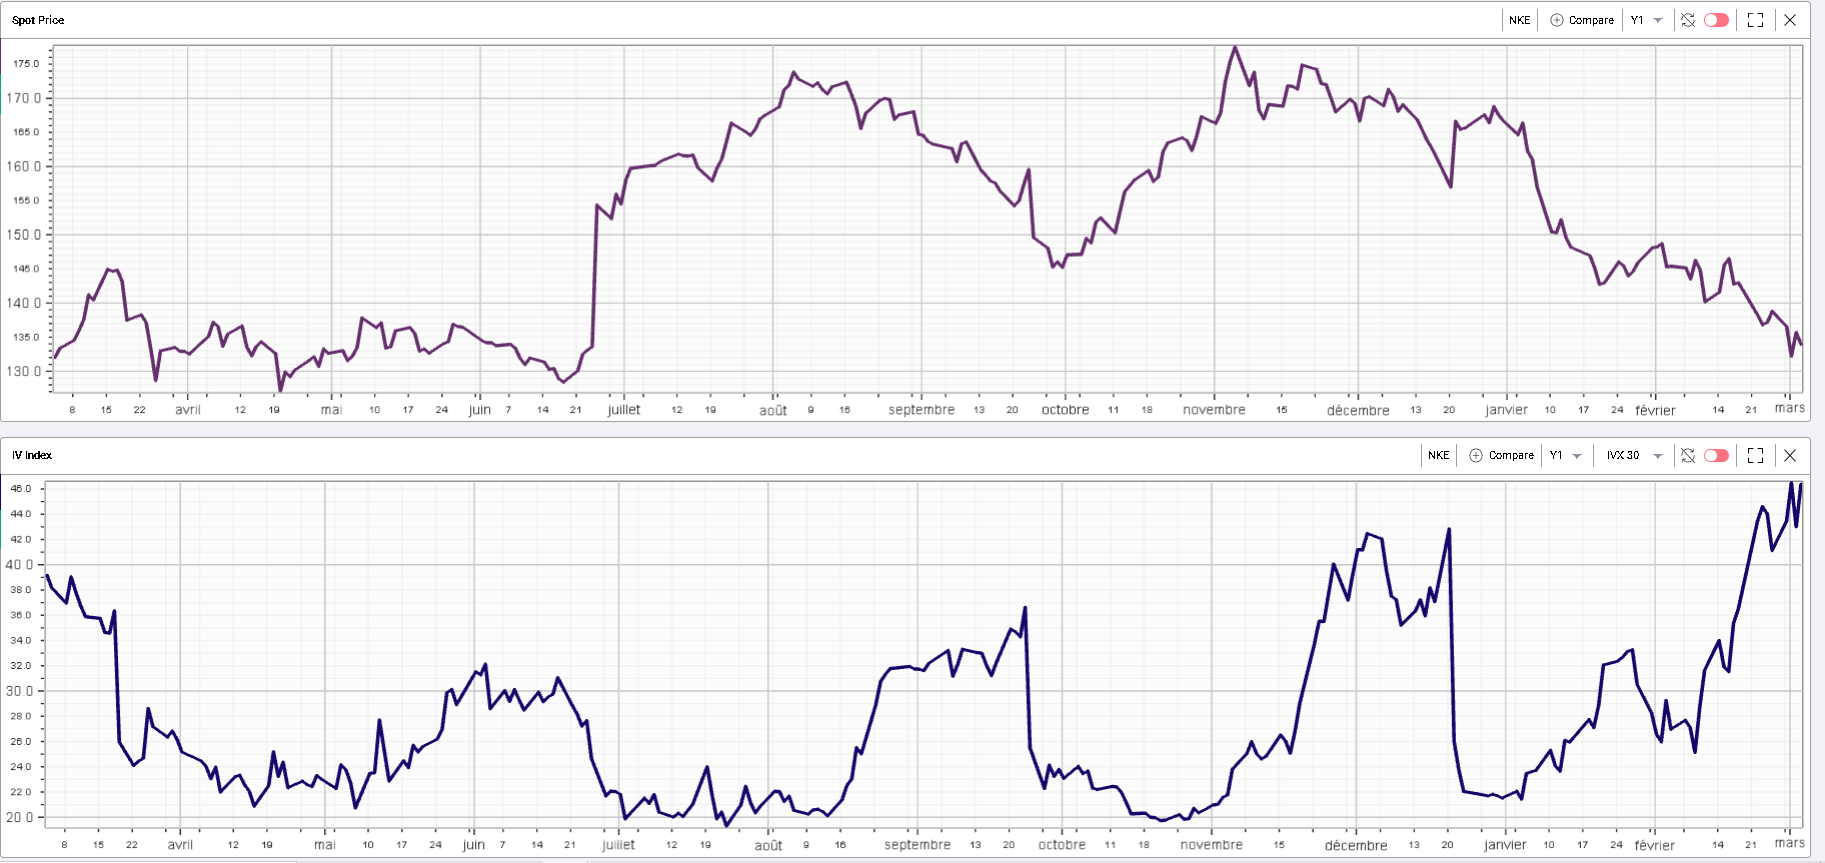
In the consumer space, NKE is the component of the DJIA that has seen its 30d IVX remark the most with a move higher of more than 10 points over the past 10 days. The company had been struggling in 2022 already but has since announced that it would be closing its stores in Russia. Below, the 12 months spot price and 12 months history of the 30d IVX for NKE. |
|
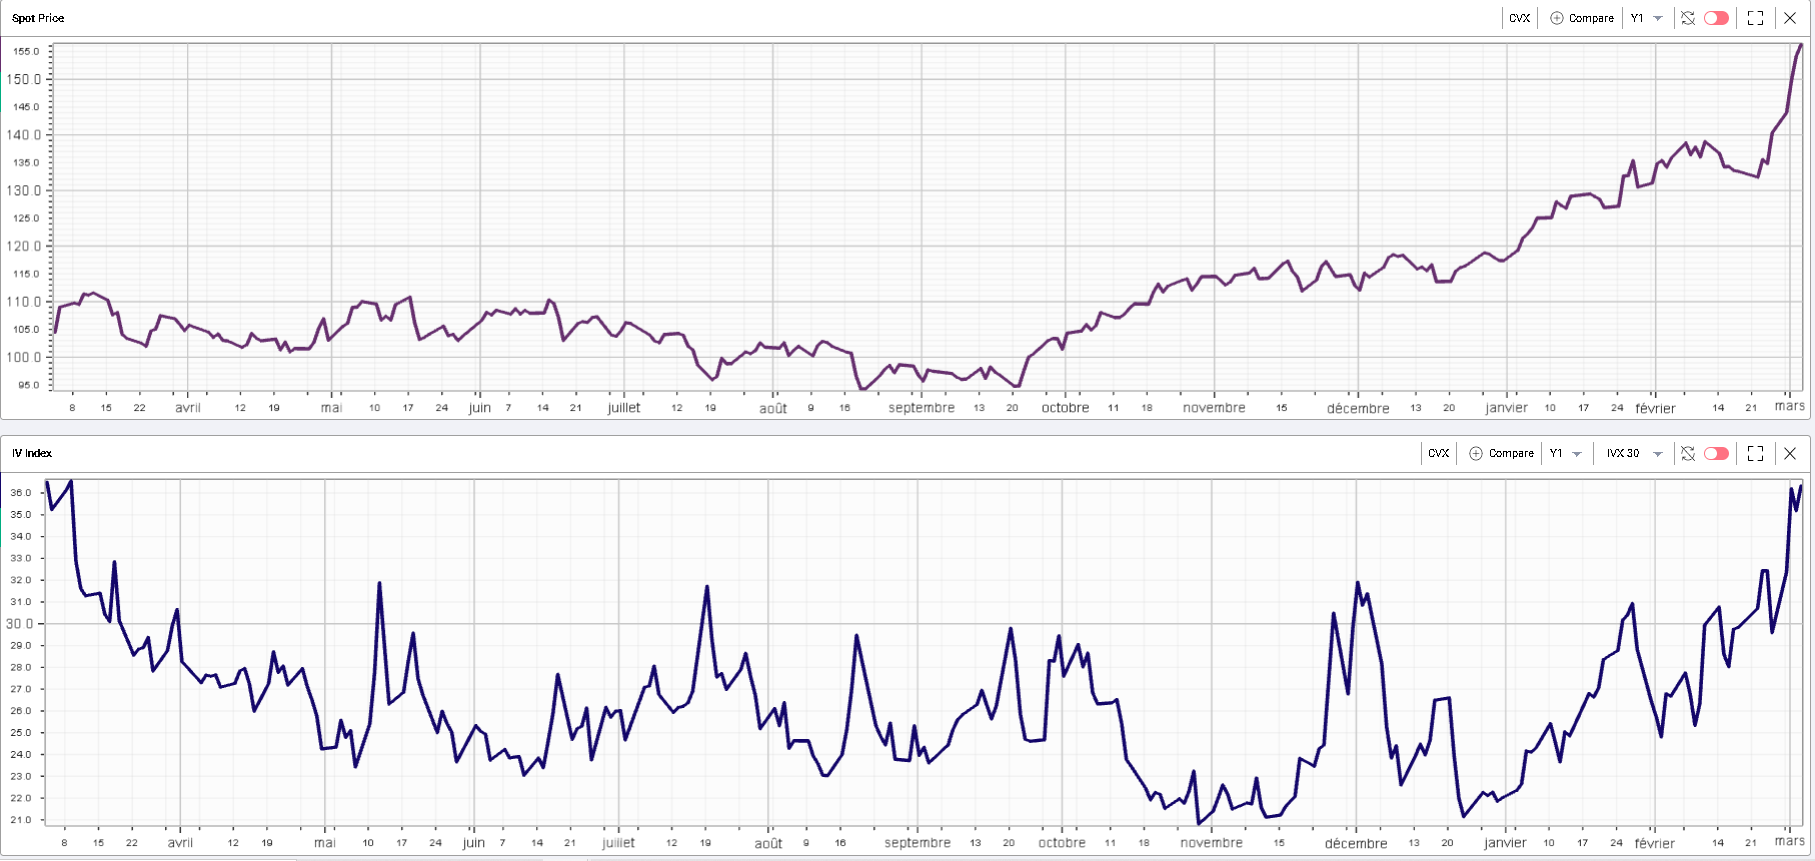
On the upside, it is with no surprise that we find that CVX is the best performing stock of the DJIA over the past 10 days. The company has been supported particularly because of its small exposure to Russia and is expected to benefit from the increase in Oil Prices. The below shows the 12 months history of both spot and 30d IVX for CVX. |
|
There are many other stories out there that we could have pointed out. For traders looking at European markets, a large number of names are now down about 20% over the past 10 days. Those include large companies such as BMW, INGA, BNP. |
As we have been pointing out for the last 10 days, traders should not only consider the performance of headline indices in such market environments but should also try to study and understand what is happening at a single stock level. |
It is worth keeping in mind that when the market is focused on macro developments it generally tends to neglect micro stories and vice versa, giving some opportunities to single stock traders. |
Disclaimer - This information is provided for general information and marketing purposes only. The content of the presentation does not constitute investment advice or a recommendation. IVolatility.com and its partners do not guarantee that this information is error free. The data shown in this presentation are not necessarily real time data. IVolatility.com and its partners will not be liable for any loss or damage, including without limitation, any loss of profit, which may arise directly or indirectly from the use or reliance on the information. When trading, you should consider whether you can afford to take the high risk of losing your money. You should not make decisions that are only based on the information provided in this video. Please be aware that information and research based on historical data or performance do not guarantee future performance or results. Past performance is not necessarily indicative of future results, and any person acting on this information does so entirely at their own risk. |