We offer multiple professional grade services to help you gain insight on volatility trading. Do not hesitate to try our products FOR FREE by clicking HERE |
The Market Update is a daily newsletter written by the team at iVolatility.com. Leveraging our analytics and data we are able to update you on key developments in the volatility market. To receive the Market Update directly into your inbox, please open a free account or visit our SITE where it is published every day. |
Market Update: 2022-03-05 |
Before we start talking about markets, for traders who are interested in getting historical market data, please note that Ivolatility.com is currently running at 30% discount on all historical data purchases and 10% discount on updates and API. Get in touch before the end of March via this FORM |
US indices traded marginally lower on Friday with the SPX closing 0.8% lower and the NDX finishing down 1.4%. This moderate performance was in stark contrast to the large liquidation that took place across European assets. The German DAX finished 4.4% lower on the day. |
This has created a difficult situation for volatility traders focused on US indices. On the one hand, implied volatilities remain fairly supported because of the general risk aversion that is taking place in markets. On the other hand, the lack of reaction from US headline indices to geopolitical developments sees realized volatility remaining very contained making it hard for implied volatility to break higher. |
Looking at the term structure for the SPX and the DAX this lack of reaction from the US headline index is quite visible. In green we see the IVX term structure as of last Friday’s close for the SPX while the blue line shows the term structure as of the 25th Feb’22. The second chart shows in red the DAX term structure as of last Friday compared with the term structure as of the 25th Feb’22 in yellow. |
|
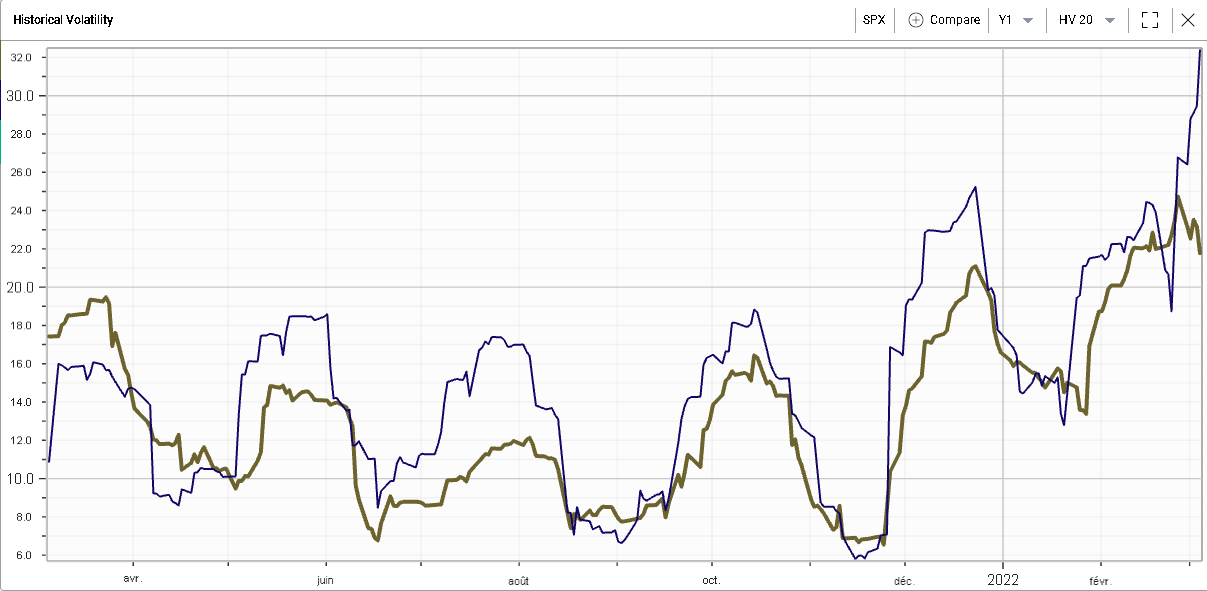
On the other hand, the chart below shows the 20 days realized volatility for the SPX in yellow and for the DAX in blue. The recent divergence between both assets has been one of the key features of this crisis so far. |
|
If this trend remains in place, it will be interesting to see how US companies with large exposures to Europe react during this tense period. It seems that the concerns expressed by market participants this week were focused on the ramifications of the sanctions taken by Europe on its own economy, first via the banking system which is showing relatively large financial exposures to the Russian economy and second with a risk that growth on the European continent could be severely hit as a result. |
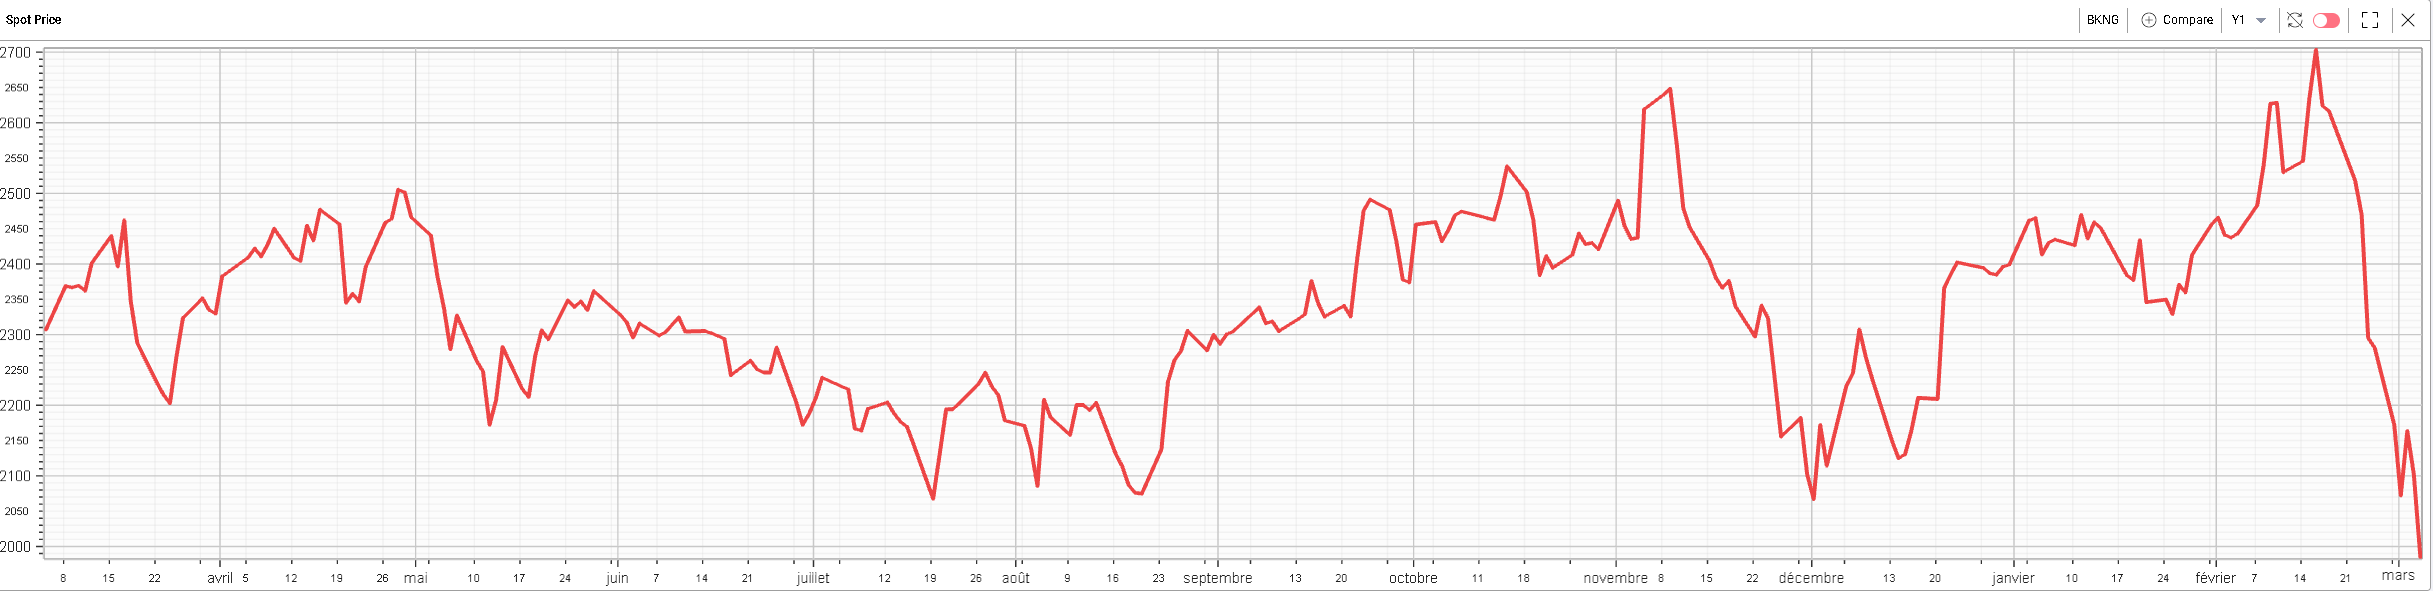
Over in the US, some stocks have already started to be more impacted than the broader market. For instance, BKNG has been in focus with its annual report of 2021 showing that almost 80% of revenues the company makes are booked in Europe. This being said, in all cases it is very important to read the fine prints of those documents to get a clearer picture of things. As explained by the company, it is entirely possible for a trip booked by a US client for a NYC hotel to be considered out of US revenues. This makes it more difficult to ascertain the real revenue exposure to the region. Nevertheless, the stock price of BKNG has suffered recently as travelling has become more difficult and global and regional growth risks have increased. |
On Friday, BKNG was down almost 6% and the company was trading more than 25% lower from its 2022 peak as shown below. |
|
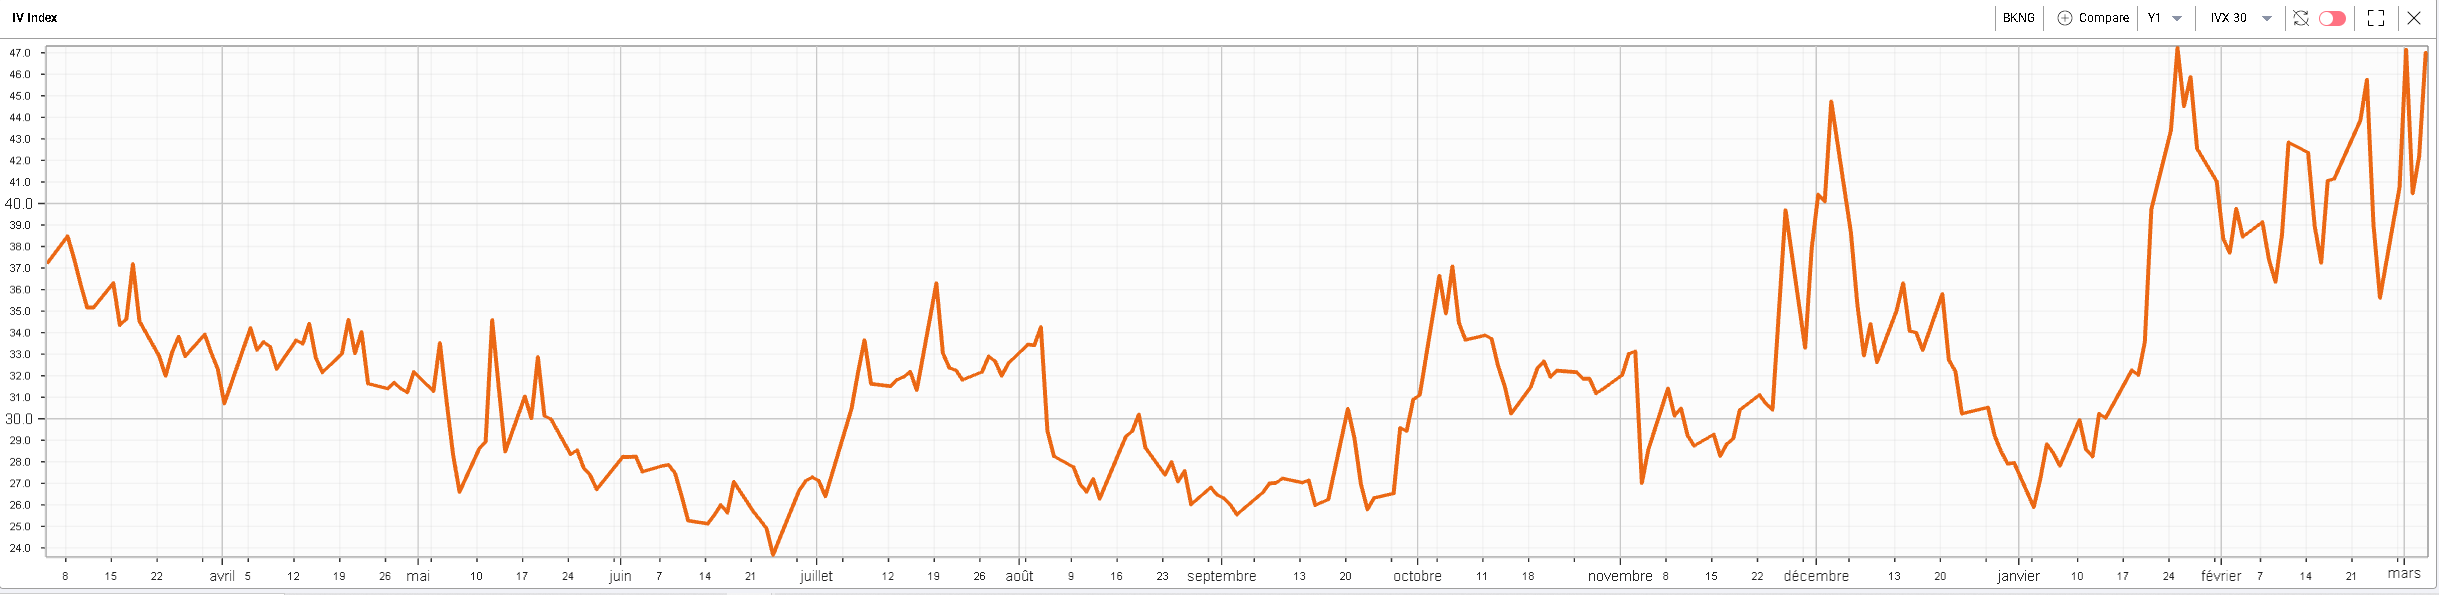
Interestingly the 30d IVX in the name has failed to make new highs despite the spot being under significant pressure over the past few weeks. |
|
As concerns have grown about a large slowdown in Europe, the EURUSD FX pair has remained under significant pressure over the past few weeks. This has been accentuated by the fact that FED members have for now continued to indicate that rate hikes are still more likely than not in the near future. |
On Friday, the pair reached its lowest point since the pandemic below 1.09 and has sold off from 1.22 back in the middle of 2021. This large move, if sustained might also impact companies’ profitability in multiple ways: |
– Could European companies who export most of their products outside of Europe’s borders suddenly become more competitive following a more than 10% depreciation in the currency vs the USD? |
– On the other hand, how will American companies that report a lot of revenues in Europe be able to cope with this sudden depreciation in the pair? |
– Is this move a sign that a recession in Europe could be happening on the back of higher commodity prices and the possible impact from sanctions or is this simply a flight to safety bid to the USD? |
Many other companies could be exposed to this crisis and the point of this market update is not to give an exhaustive list of all names impacted but rather to discuss the big picture themes observed in the market. |
At a sector level in the US, the trends we flagged on Thursday remained in place for the final day of the week. The energy sector gained almost 3% while utilities were up more than 2% on the day. This adds to their recent outperformance for reasons that we discussed in the market update on Thursday. |
On the downside, financials trailed and finished about 2% lower while consumer discretionary also sold off more than 1.5%. |
One key aspect of the outperformance of US markets over their European counterparts was found in the Technology sector which has been fairly resilient. The large cap names will play an important role in the coming weeks as in those types of market their price action carries a lot of weight first because they make up a large portion of the headline indices that we all look at but also because they are widely followed and observed. |
Looking at AMZN – AAPL – MSFT and TSLA, the spot prices of the first two have managed to hold their lows of the beginning of February while the last two have already established new lows for 2022. |
|
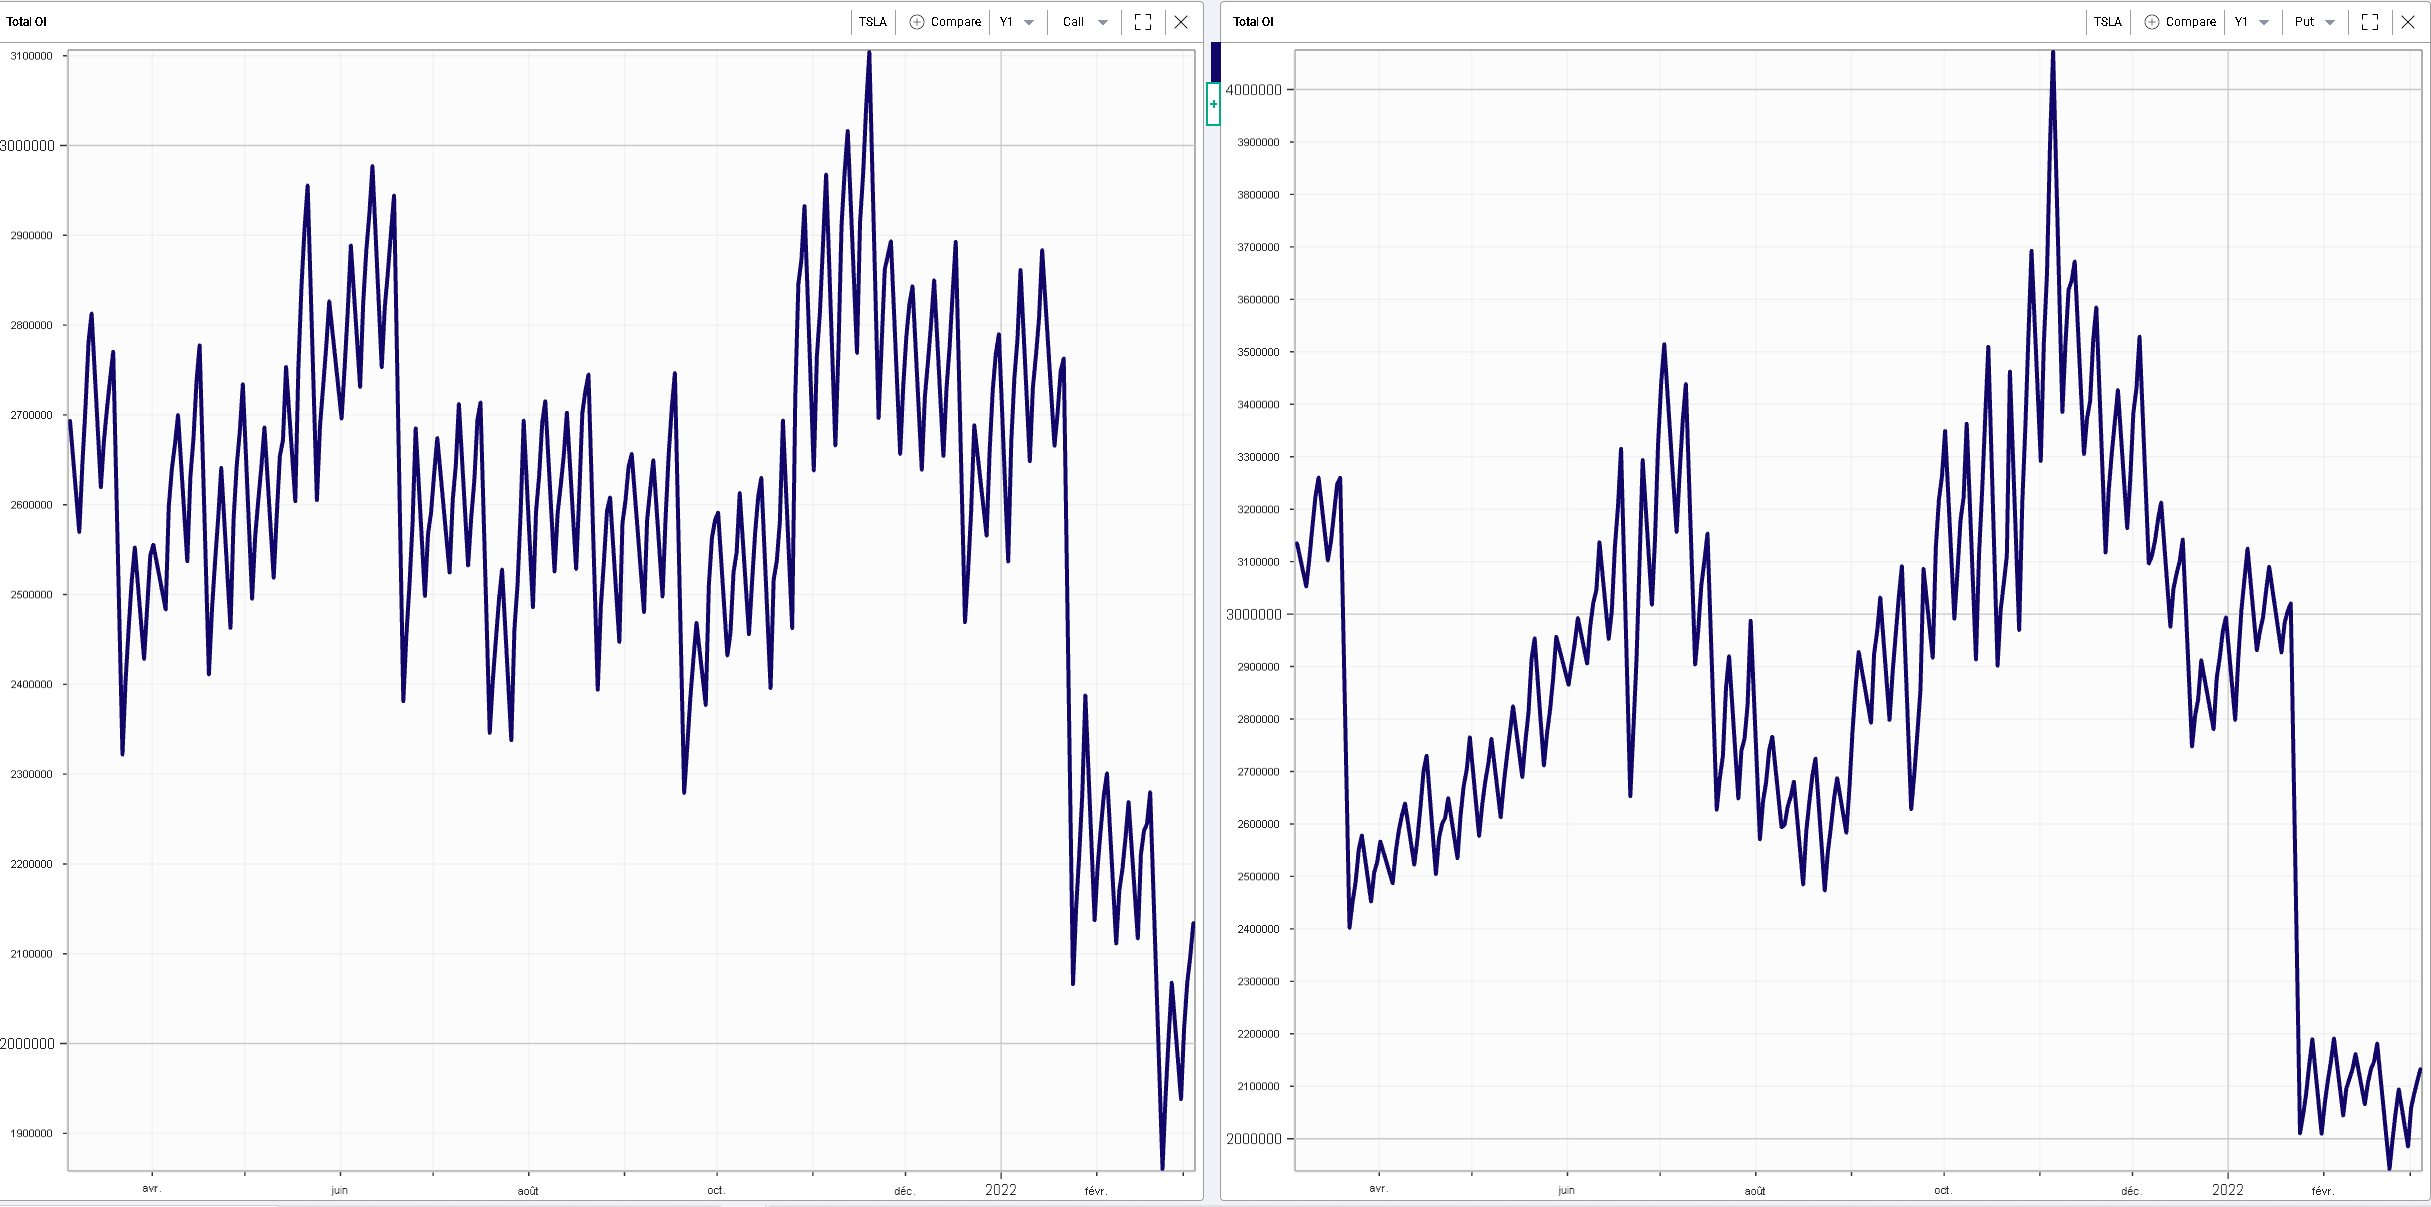
It is also interesting to look at that price action in conjunction with the open interest, which we use to proxy activity in the names on the options front. |
First in TSLA, we see that the open interest for both calls and puts is pretty much at its lows for the last 12 months. |
TSLA Open Interest – Calls on the left / Puts on the right – Last 12 months |
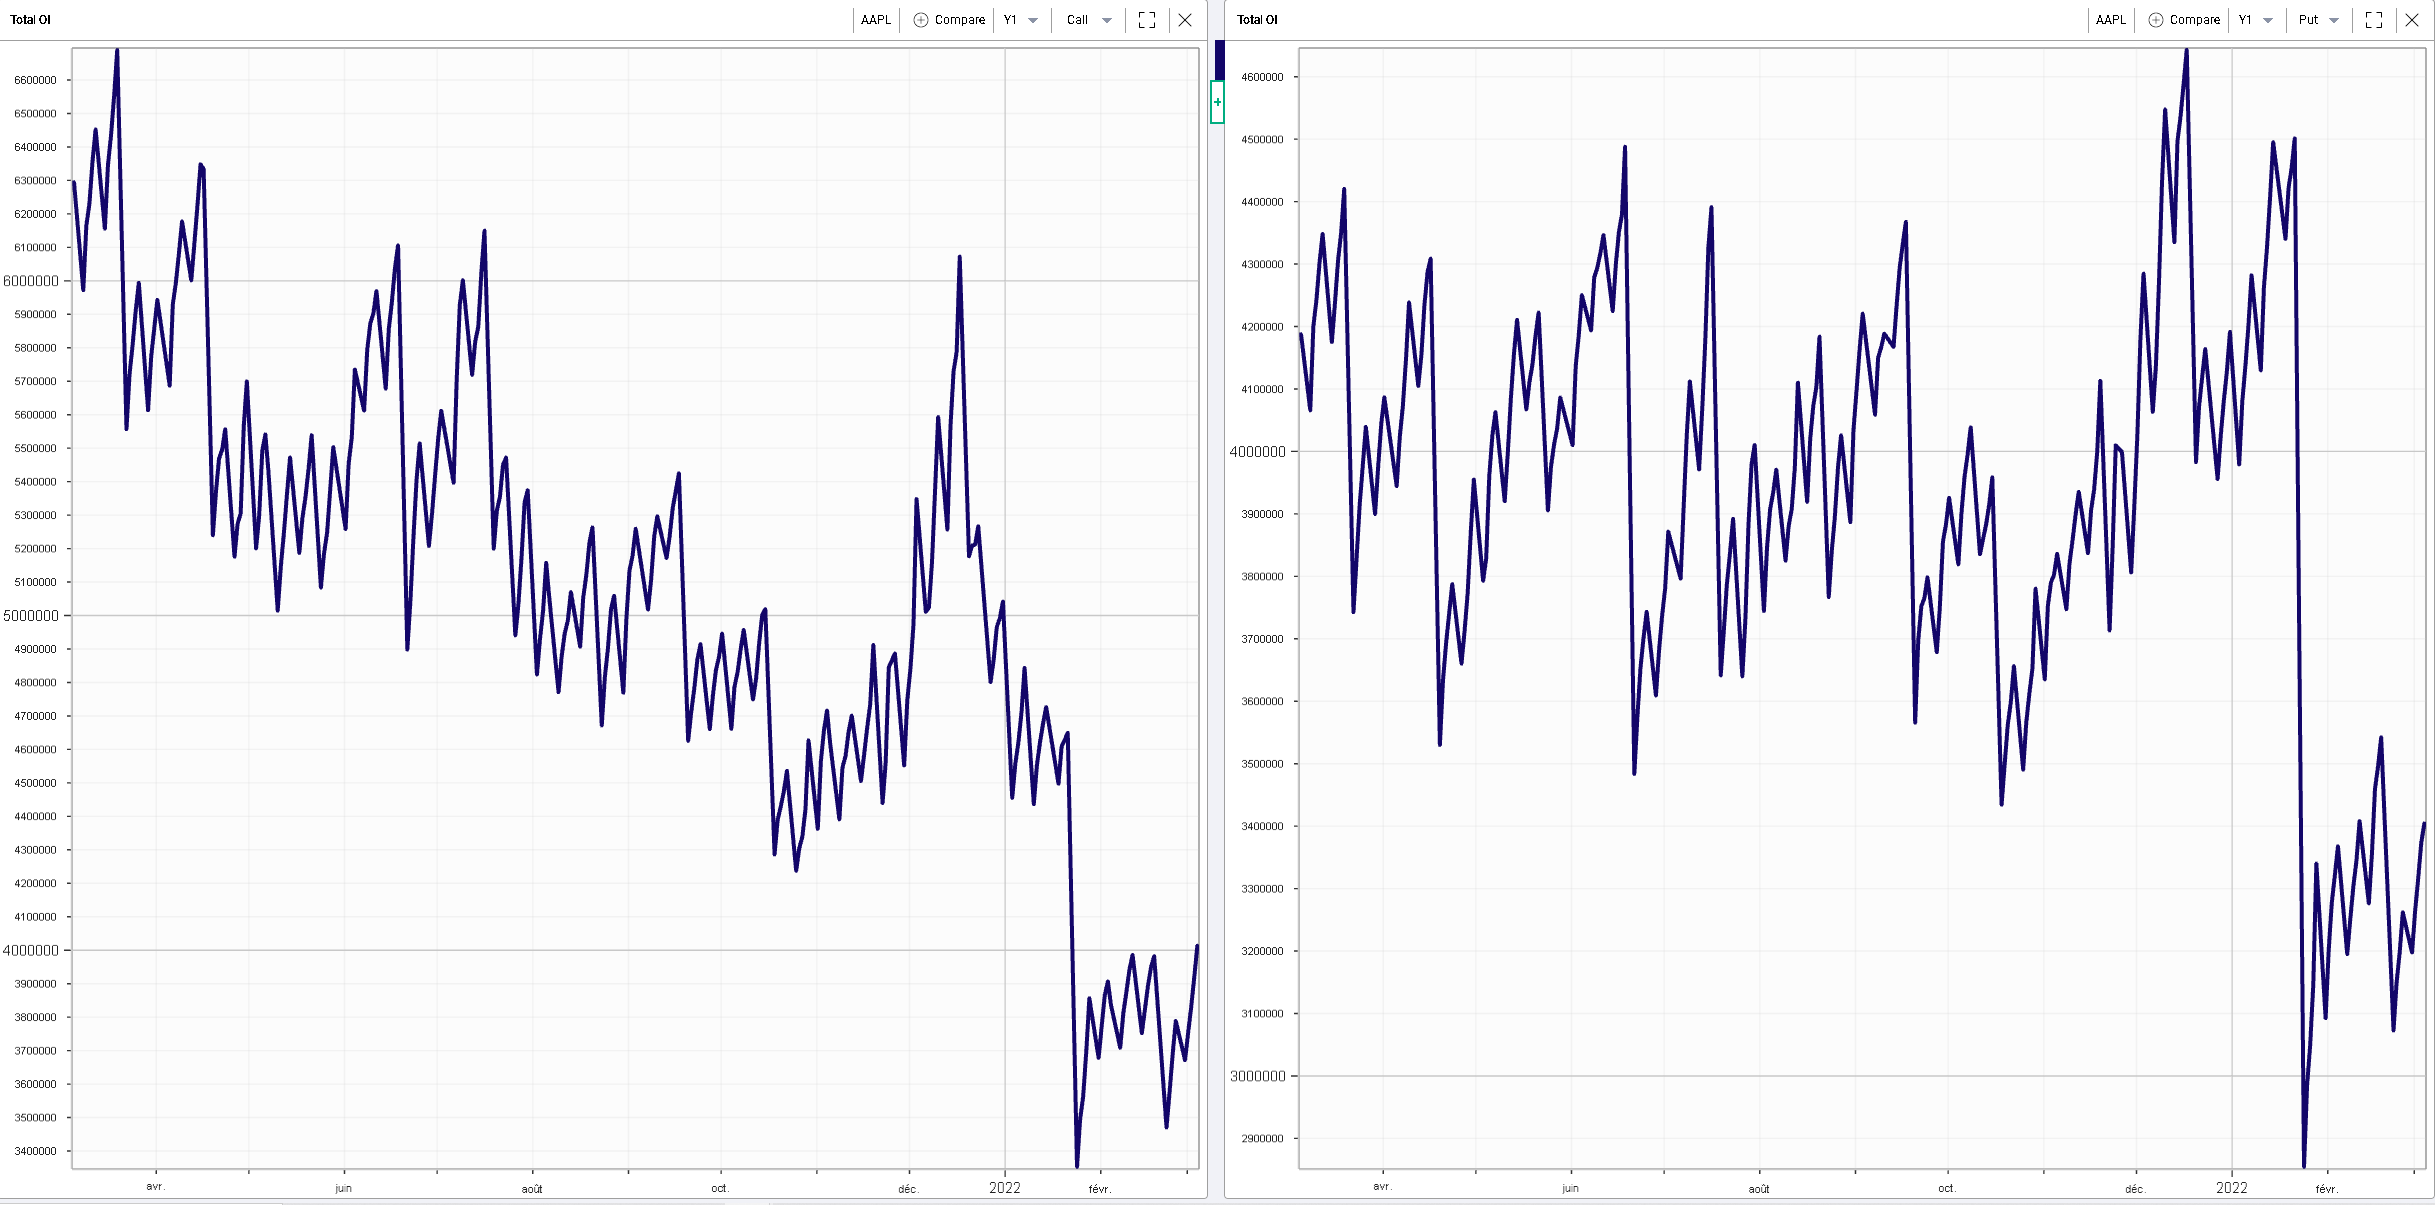
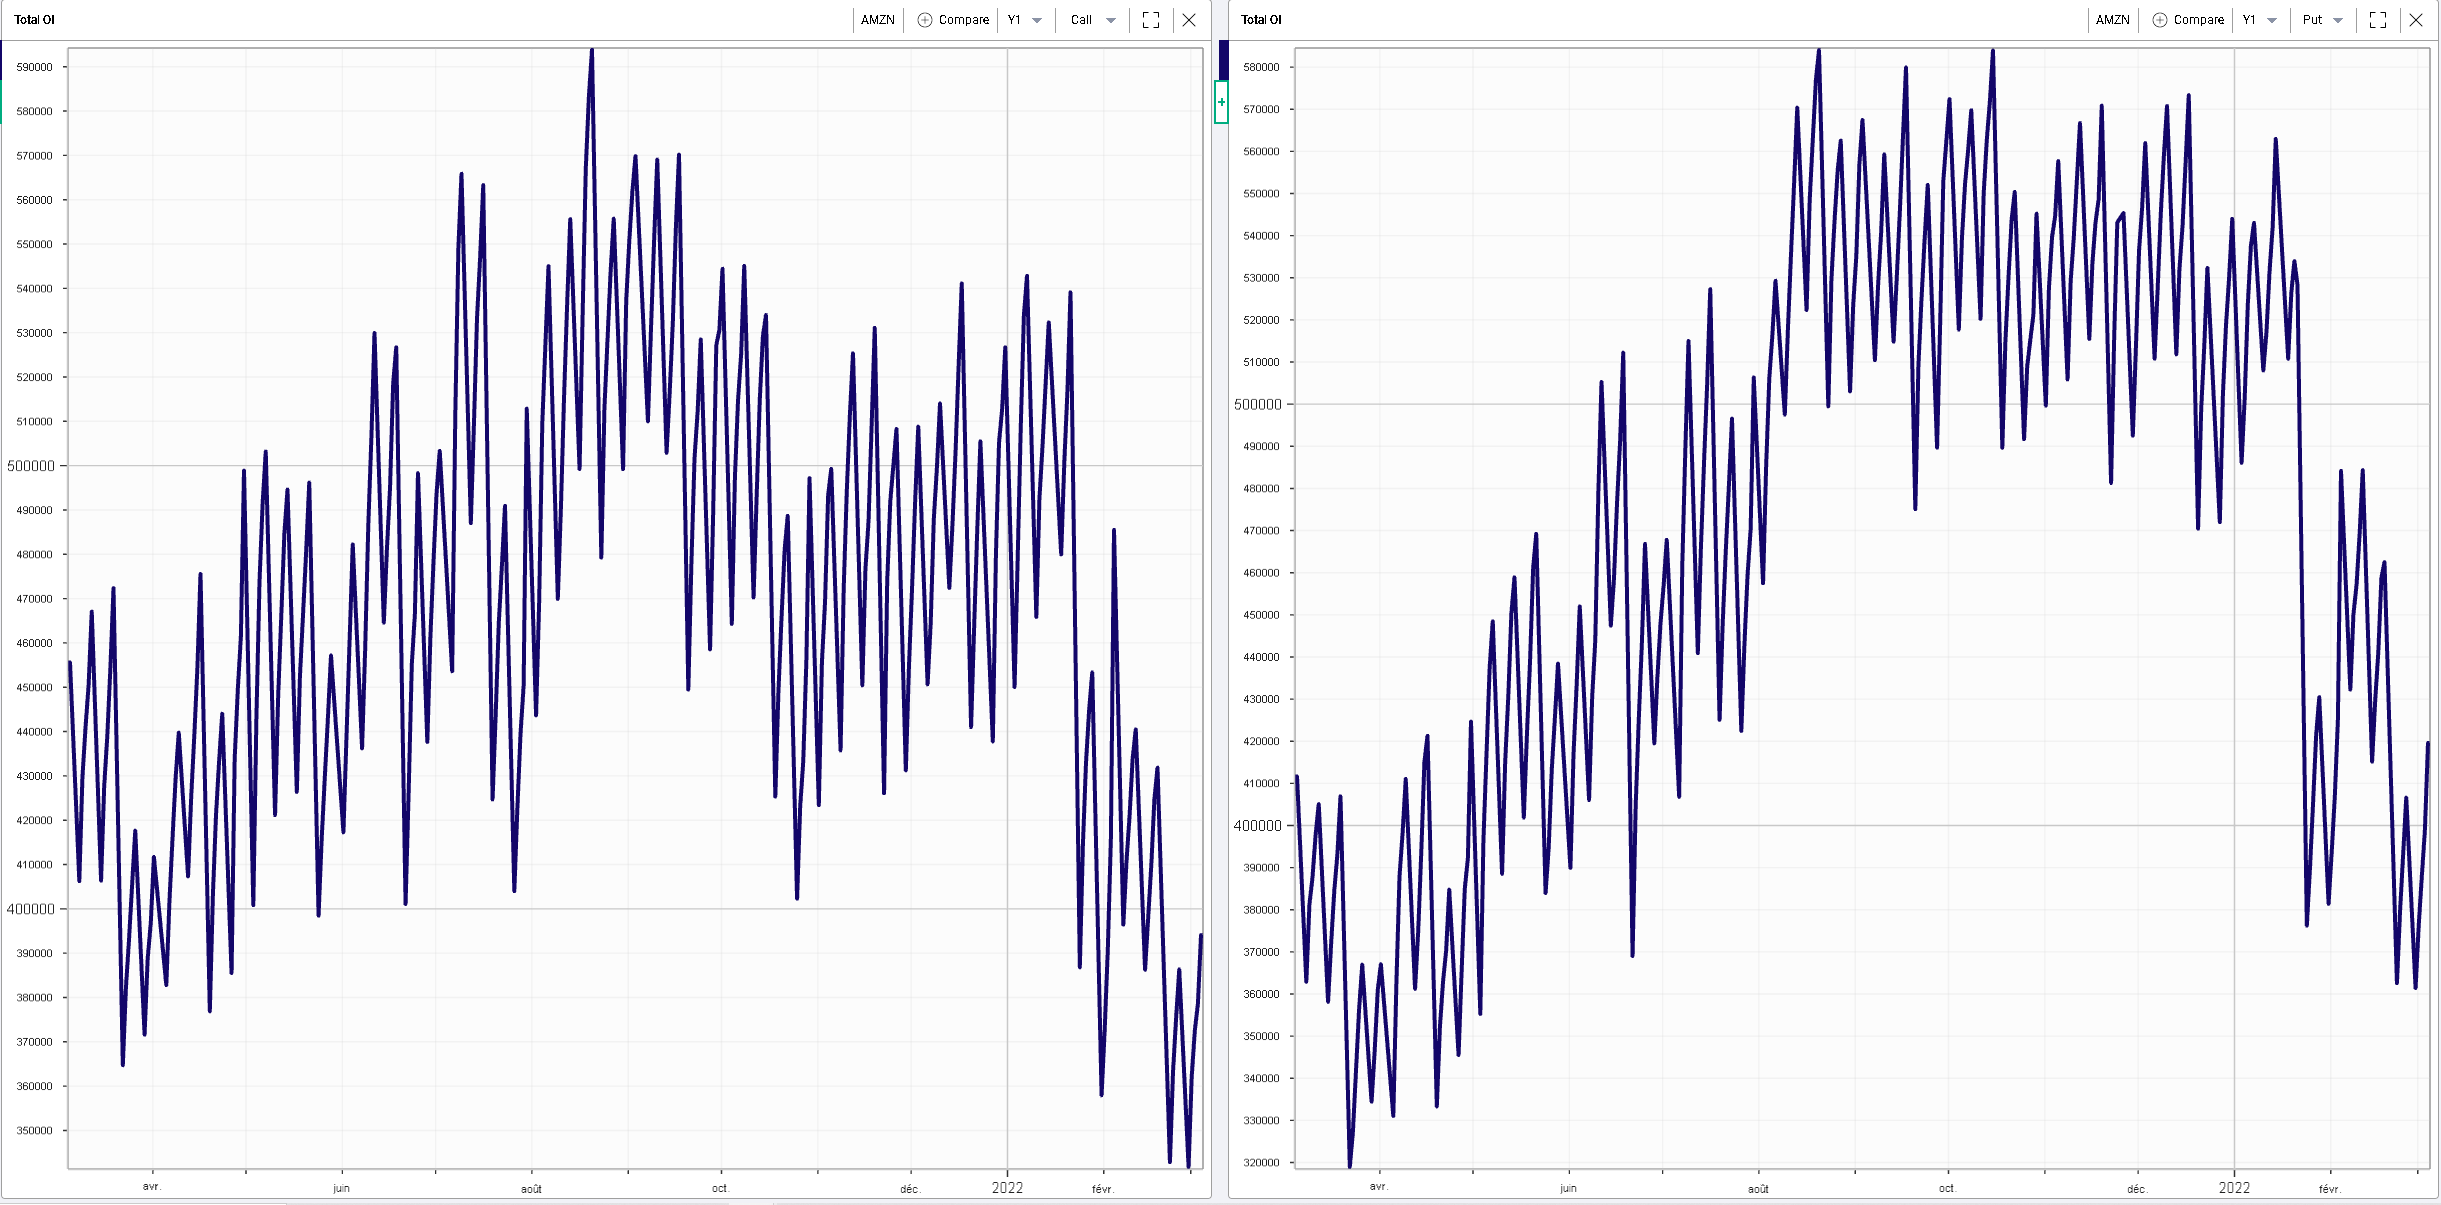
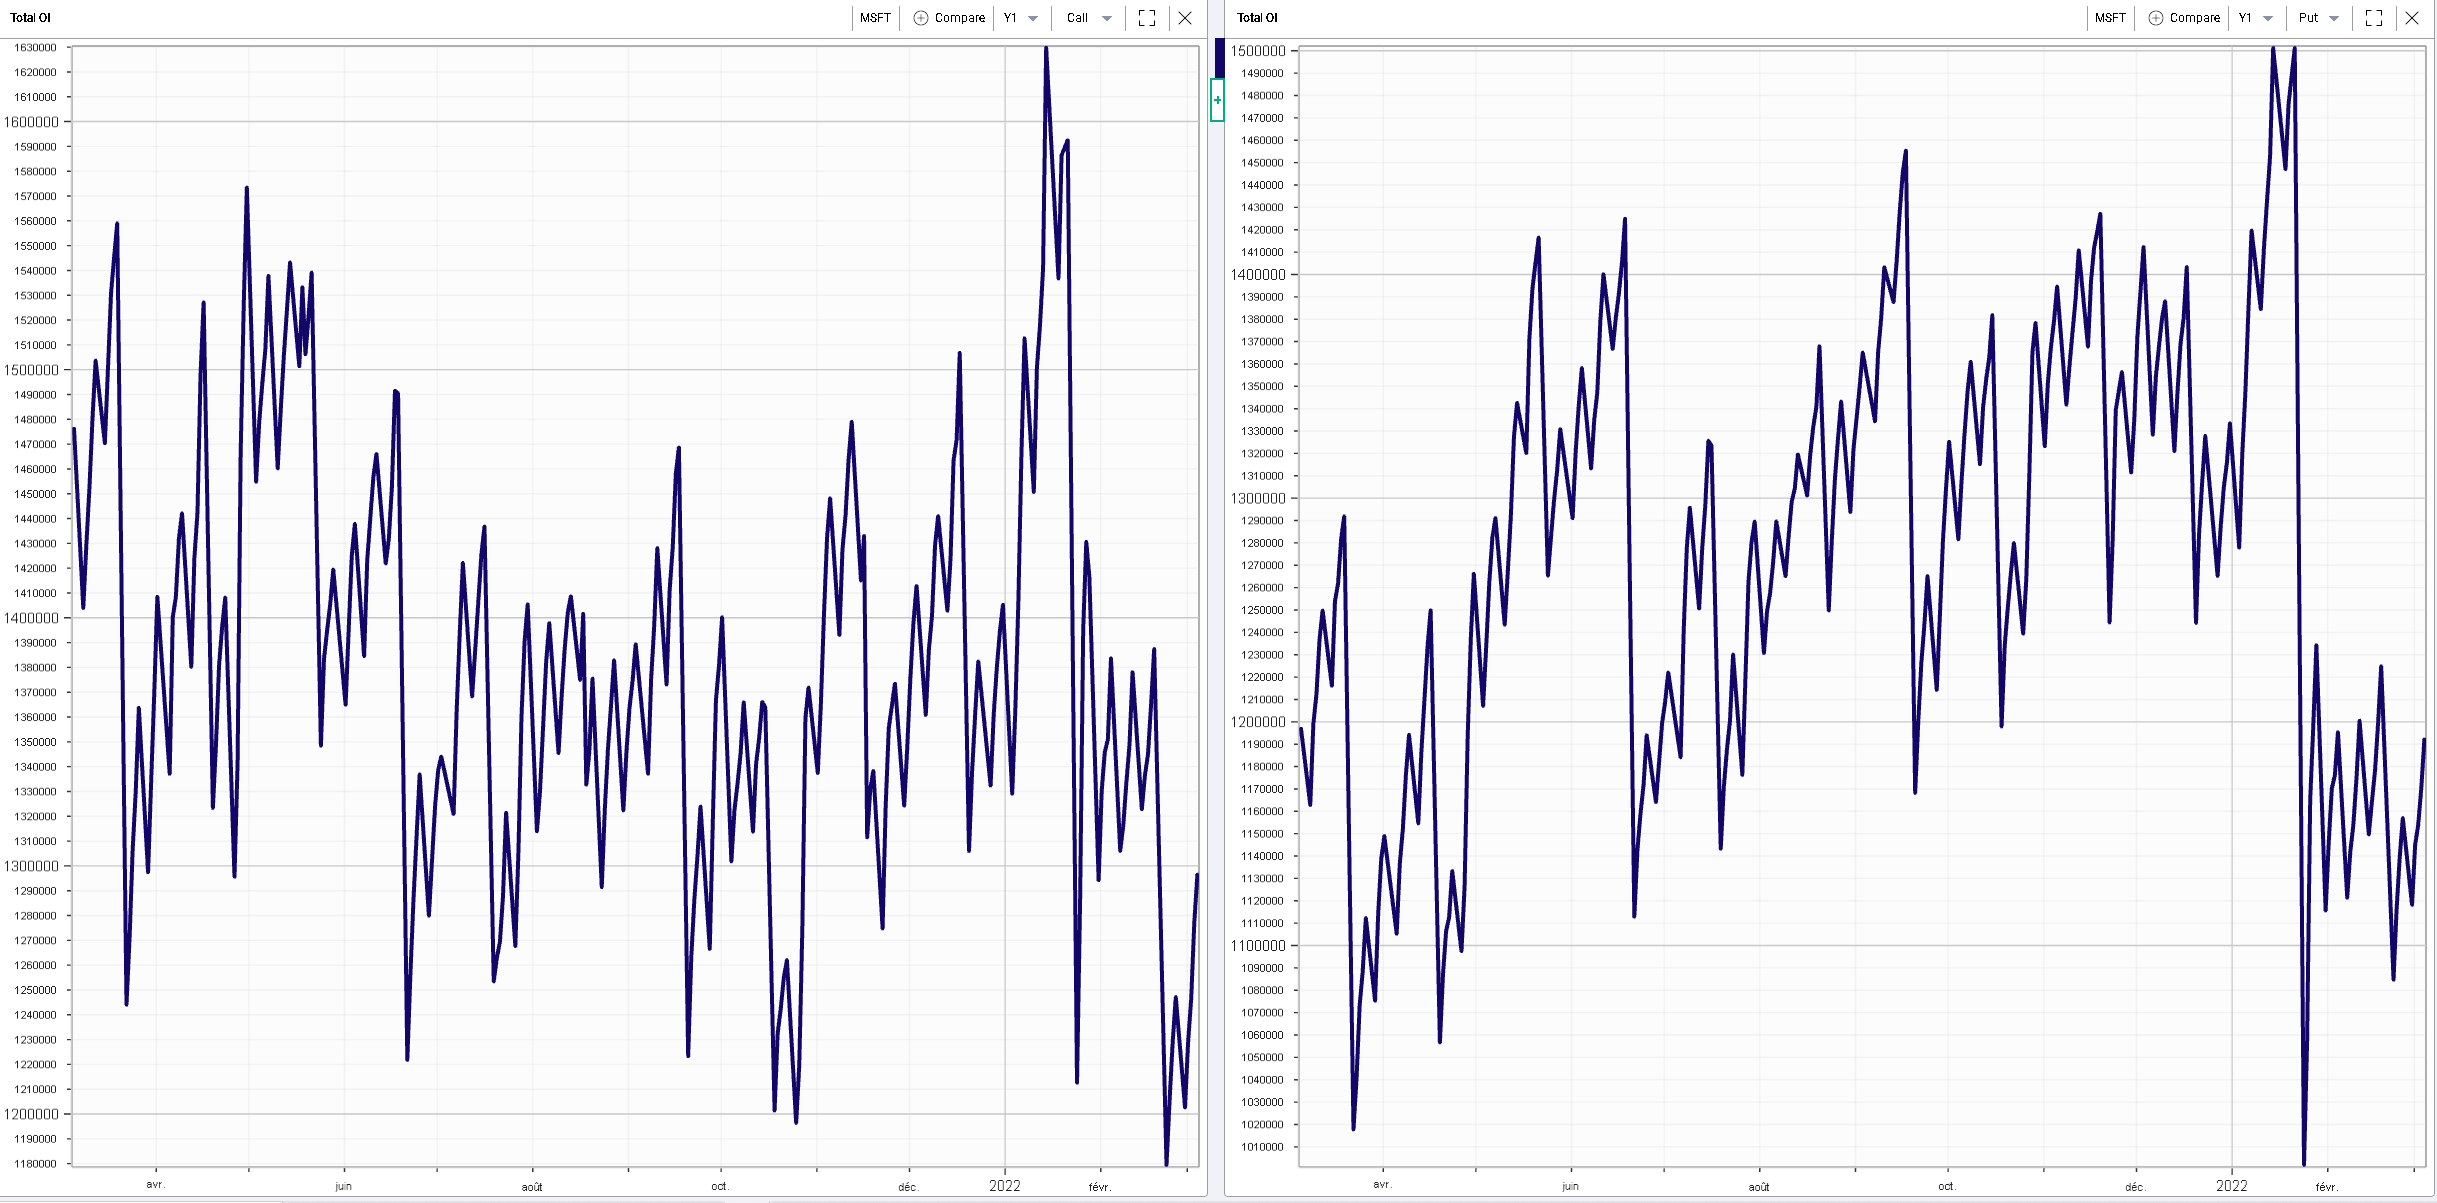
The same is visible on AAPL, AMZN and MSFT |
AAPL Open Interest – Calls on the left / Puts on the right – Last 12 months |
AMZN Open Interest – Calls on the left / Puts on the right – Last 12 months |
MSFT Open Interest – Calls on the left / Puts on the right – Last 12 months |
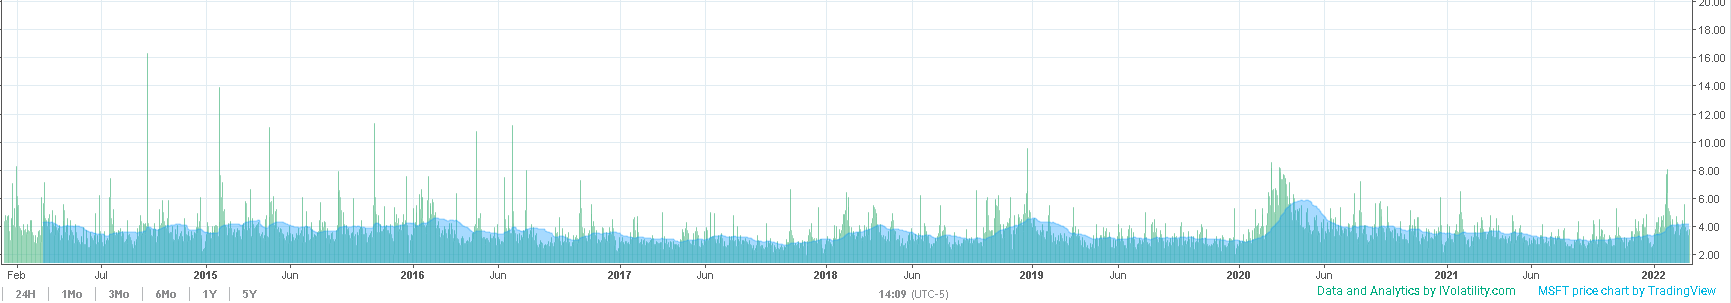
Looking at stock volume, we find a fairly similar picture with almost no visible increase in activity off late. On the chart below we show the daily volumes in the green bars while the blue lines show the 50d moving average for the spot. We can see that the activity has remained subdued in those four mega cap names over the past few weeks and that the last peak of activity was towards the end of January when the market was mostly focused on the FED. |
MSFT stock volume daily – 50d average in blue |
AAPL stock volume daily – 50d average in blue |
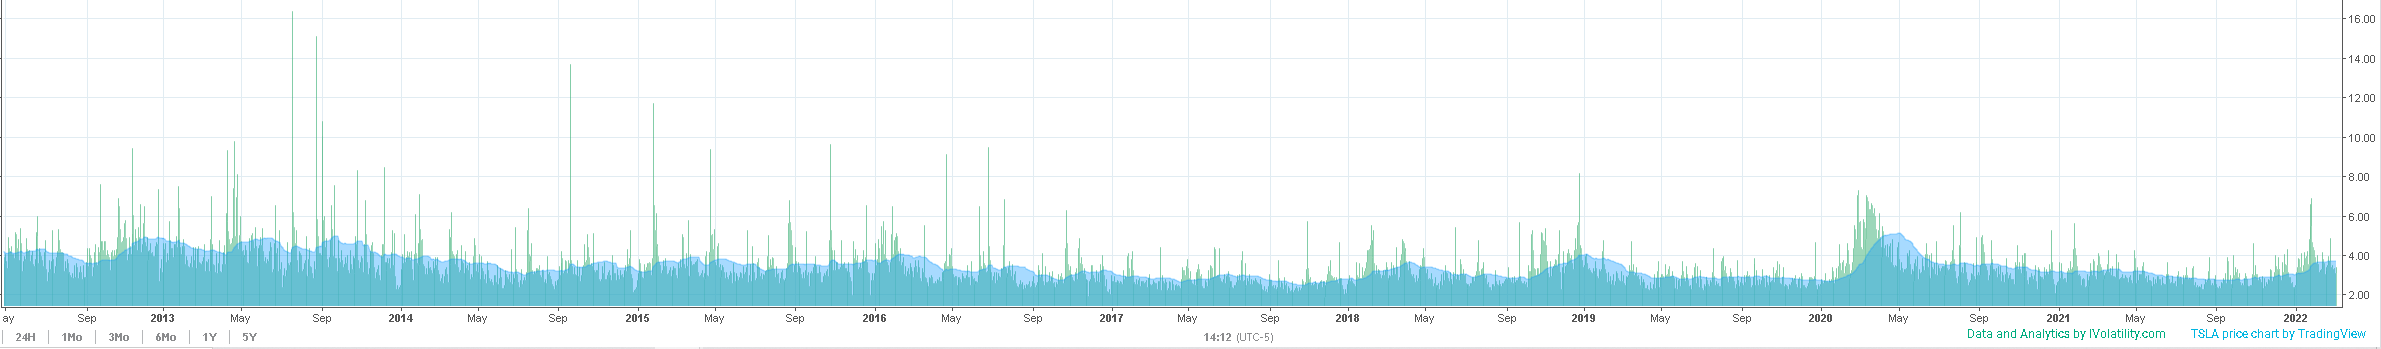
TSLA stock volume daily – 50d average in blue |
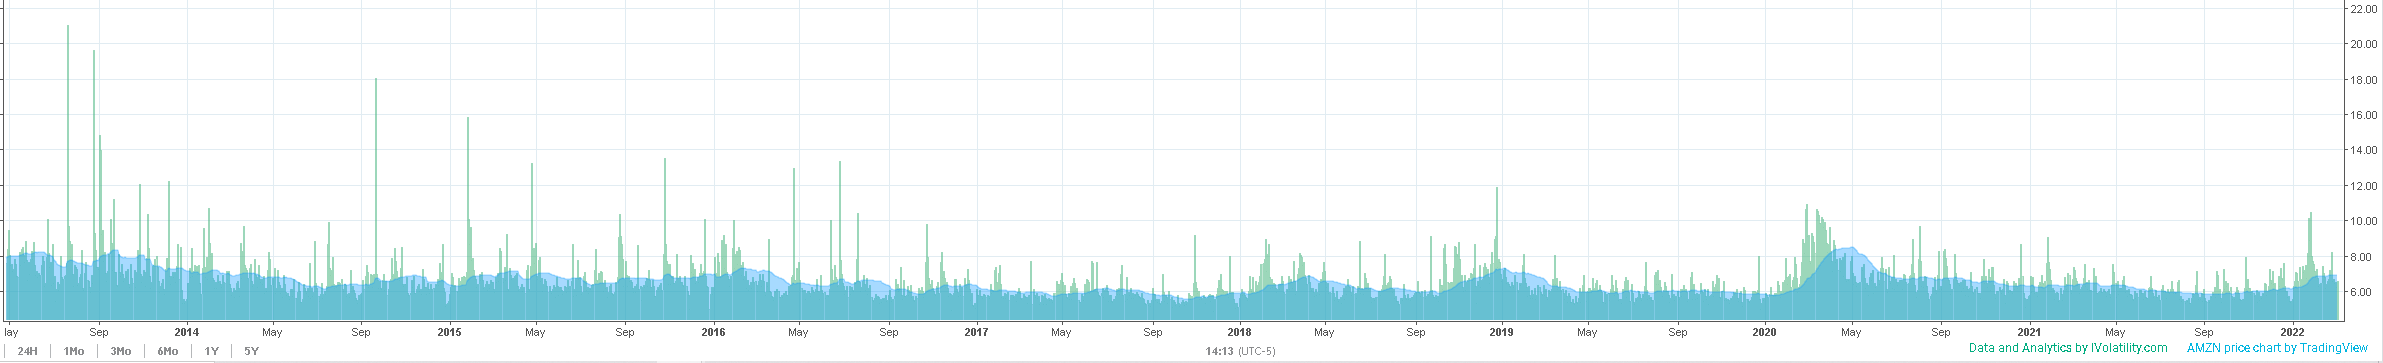
AMZN stock volume daily – 50d average in blue |
The lack of activity in both stocks and options for mega caps could be a sign that traders are still watching how things evolve both on the geopolitical side of things and with the FED. The higher the geopolitical tensions the more likely the FED is to err on the side of caution. At the same time, a reduction in macro risk could mean a more proactive FED. It is also entirely possible that this crisis will result in higher inflation in the short term as multiple commodity prices have spiked recently making the FED’s outlook even more uncertain. |
This has so far resulted in a relative stalemate situation for those large US technology stocks and it will be interesting to see if that changes in the future. |
Disclaimer - This information is provided for general information and marketing purposes only. The content of the presentation does not constitute investment advice or a recommendation. IVolatility.com and its partners do not guarantee that this information is error free. The data shown in this presentation are not necessarily real time data. IVolatility.com and its partners will not be liable for any loss or damage, including without limitation, any loss of profit, which may arise directly or indirectly from the use or reliance on the information. When trading, you should consider whether you can afford to take the high risk of losing your money. You should not make decisions that are only based on the information provided in this video. Please be aware that information and research based on historical data or performance do not guarantee future performance or results. Past performance is not necessarily indicative of future results, and any person acting on this information does so entirely at their own risk. |