We offer multiple professional grade services to help you gain insight on volatility trading. Do not hesitate to try our products FOR FREE by clicking HERE |
The Market Update is a daily newsletter written by the team at iVolatility.com. Leveraging our analytics and data we are able to update you on key developments in the volatility market. To receive the Market Update directly into your inbox, please open a free account or visit our SITE where it is published every day. |
Market Update: 2022-03-08 |
Before we start talking about markets, for traders who are interested in getting historical market data, please note that Ivolatility.com is currently running at 30% discount on all historical data purchases and 10% discount on updates and API. Get in touch before the end of March via this FORM |
Markets were very heavy to start the week led by European assets which started Monday down 5% right around the open. EU equities then firmed up and took US futures higher until the US open when the selling started again. |
European shares managed to finish only down slightly more than 1% while US headline indices continued to selloff and finished at -3% for the SPX and -4% for the NDX. The selling impacted Asia as well with the Japanese Nikkei finishing 3% lower and the Hong Kong HSCEI finishing almost down 4%. |
Markets were mostly hit by another move higher in commodity prices with Crude Oil reaching above $130. Metals exported by Russia also have very large upside price movements, for example Nickel went up more than 65% during yesterday’s session. |
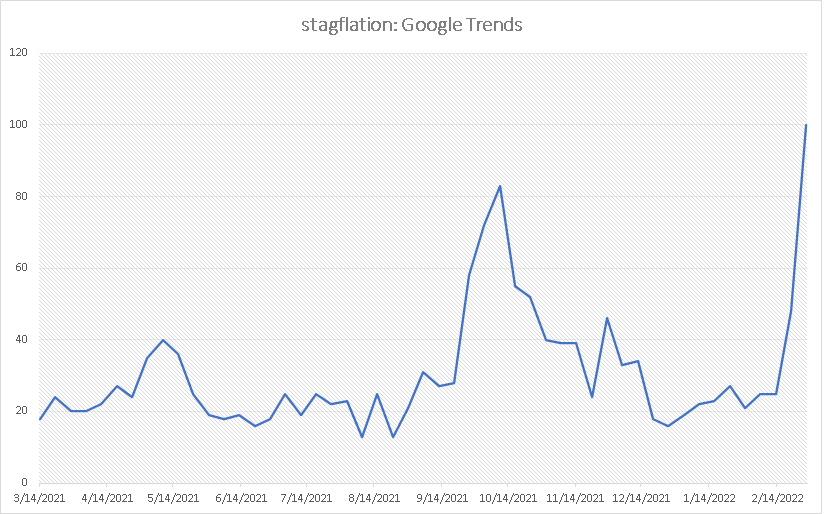
This backdrop is creating an incredibly uncertain environment and a very difficult one to navigate. Google searches for the word stagflation increased significantly over the past few days, a sign that the wider population is getting more nervous about that prospect. |
|
The potential for low growth and even a possible recession in Europe in conjunction with elevated inflation driven by rising commodity prices because of a supply driven shock has traders across the globe worried. This scenario is probably one feared by most central bankers as well making some of their policy actions highly ineffective. The ECB on Thursday will be very informative to better understand how this situation is being analyzed by central bankers while next week’s FOMC meeting will be key. |
Looking at sectors in the US yesterday, nothing new on the upside with utilities and energy continuing their advance. On the other hand, consumer discretionary stocks were down about 5% on average. Financials continue to see selling pressure with the XLF down 4% yesterday. |
Interestingly, we flagged in the market update published over the weekend that the technology sector had been fairly insulated so far from the selloff. This changed yesterday with the tech space down almost 4% on the day. |
|
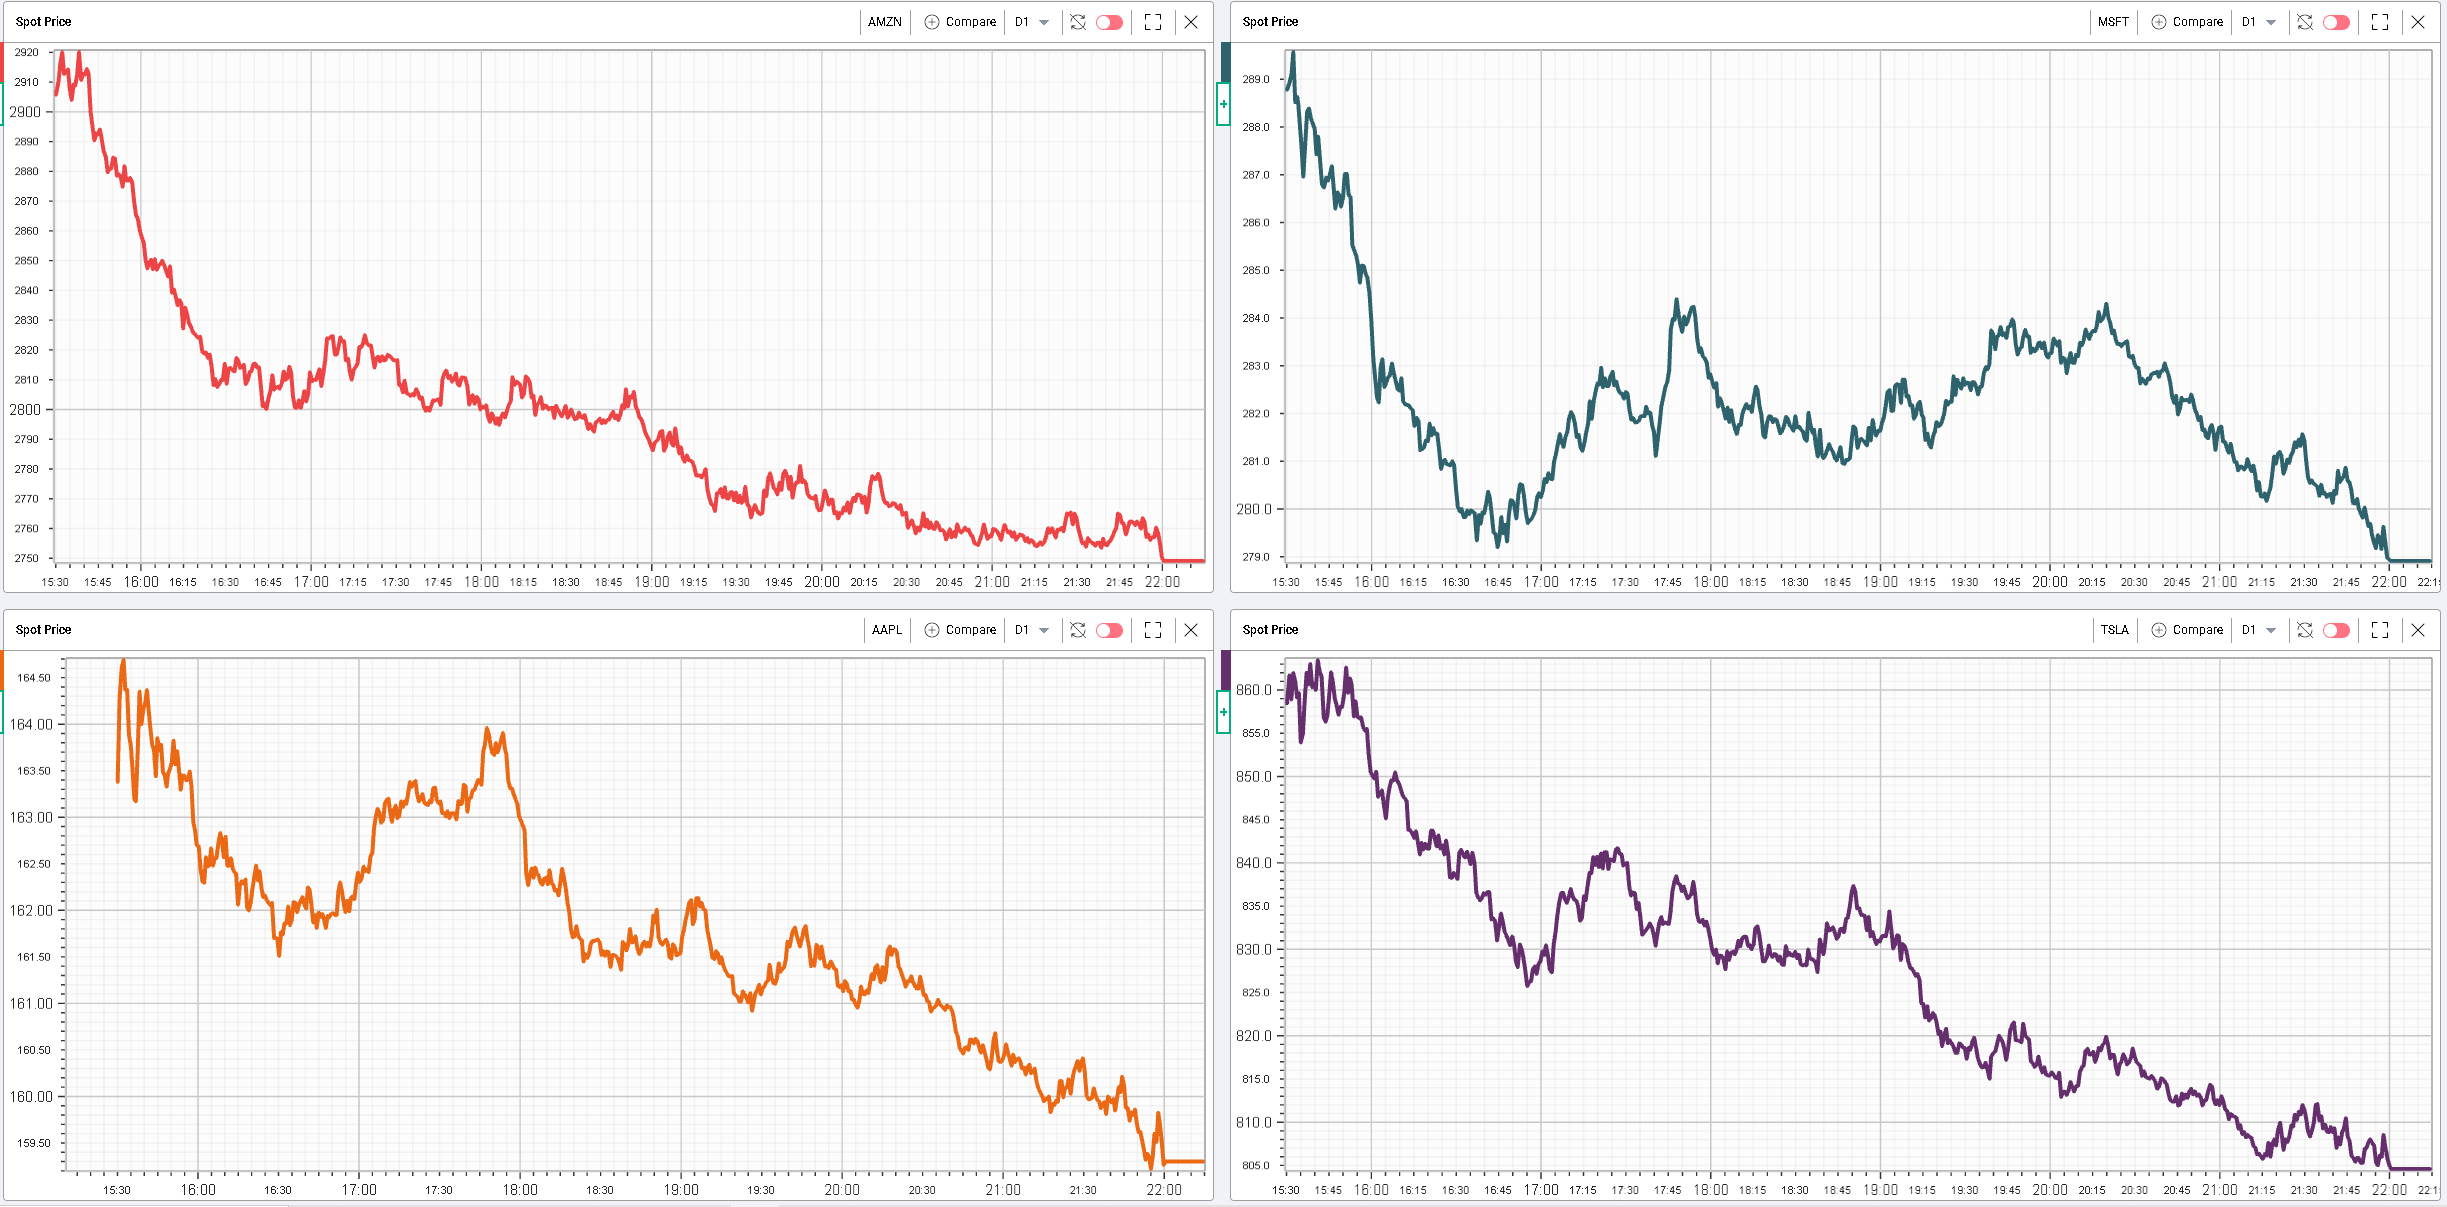
The four stocks we highlighted in our last market update (AMZN – AAPL – MSFT – TSLA) pressed lower with AAPL outperforming down only 2.6%. Amazon finished the day 5.6% lower, MSFT was 3.8% lower and TSLA closed down 4%. |
Those mega caps carry a lot of weight, not only because they make up a large portion of indices but also because of how much they can impact sentiment both on the upside and the downside. It will remain very important to keep an eye on their price action over the next few days. |
AXP was the worst performing stock (around −8%) of the DJIA as it announced that it would exist Russia and Belarus. BA was down more than 6% on the back of higher oil prices. Multiple global brands also finished the day about 5% lower. Those include: NKE – DIS – MCD and V. |
In contrast to last week when it was still possible to find some differences between implied volatilities relative positions, it seems that yesterday’s move saw a lot of capitulation on the vol front as well. |
|
All 30d IVX for the DJIA are now trading above their 93rd percentile with some significant implied volatility changes yesterday. For instance, AAPL 30d IVX was up about 5 points or even MCD up 6.4 points. |
The resilience of US equities to the large selloff in Europe all of last week explains why realized volatilities can look quite low in some names when compared with implied volatilities. We highlighted that difficulty for US options traders in the last market update as they have been stuck between moderate realized and increased macro risks. |
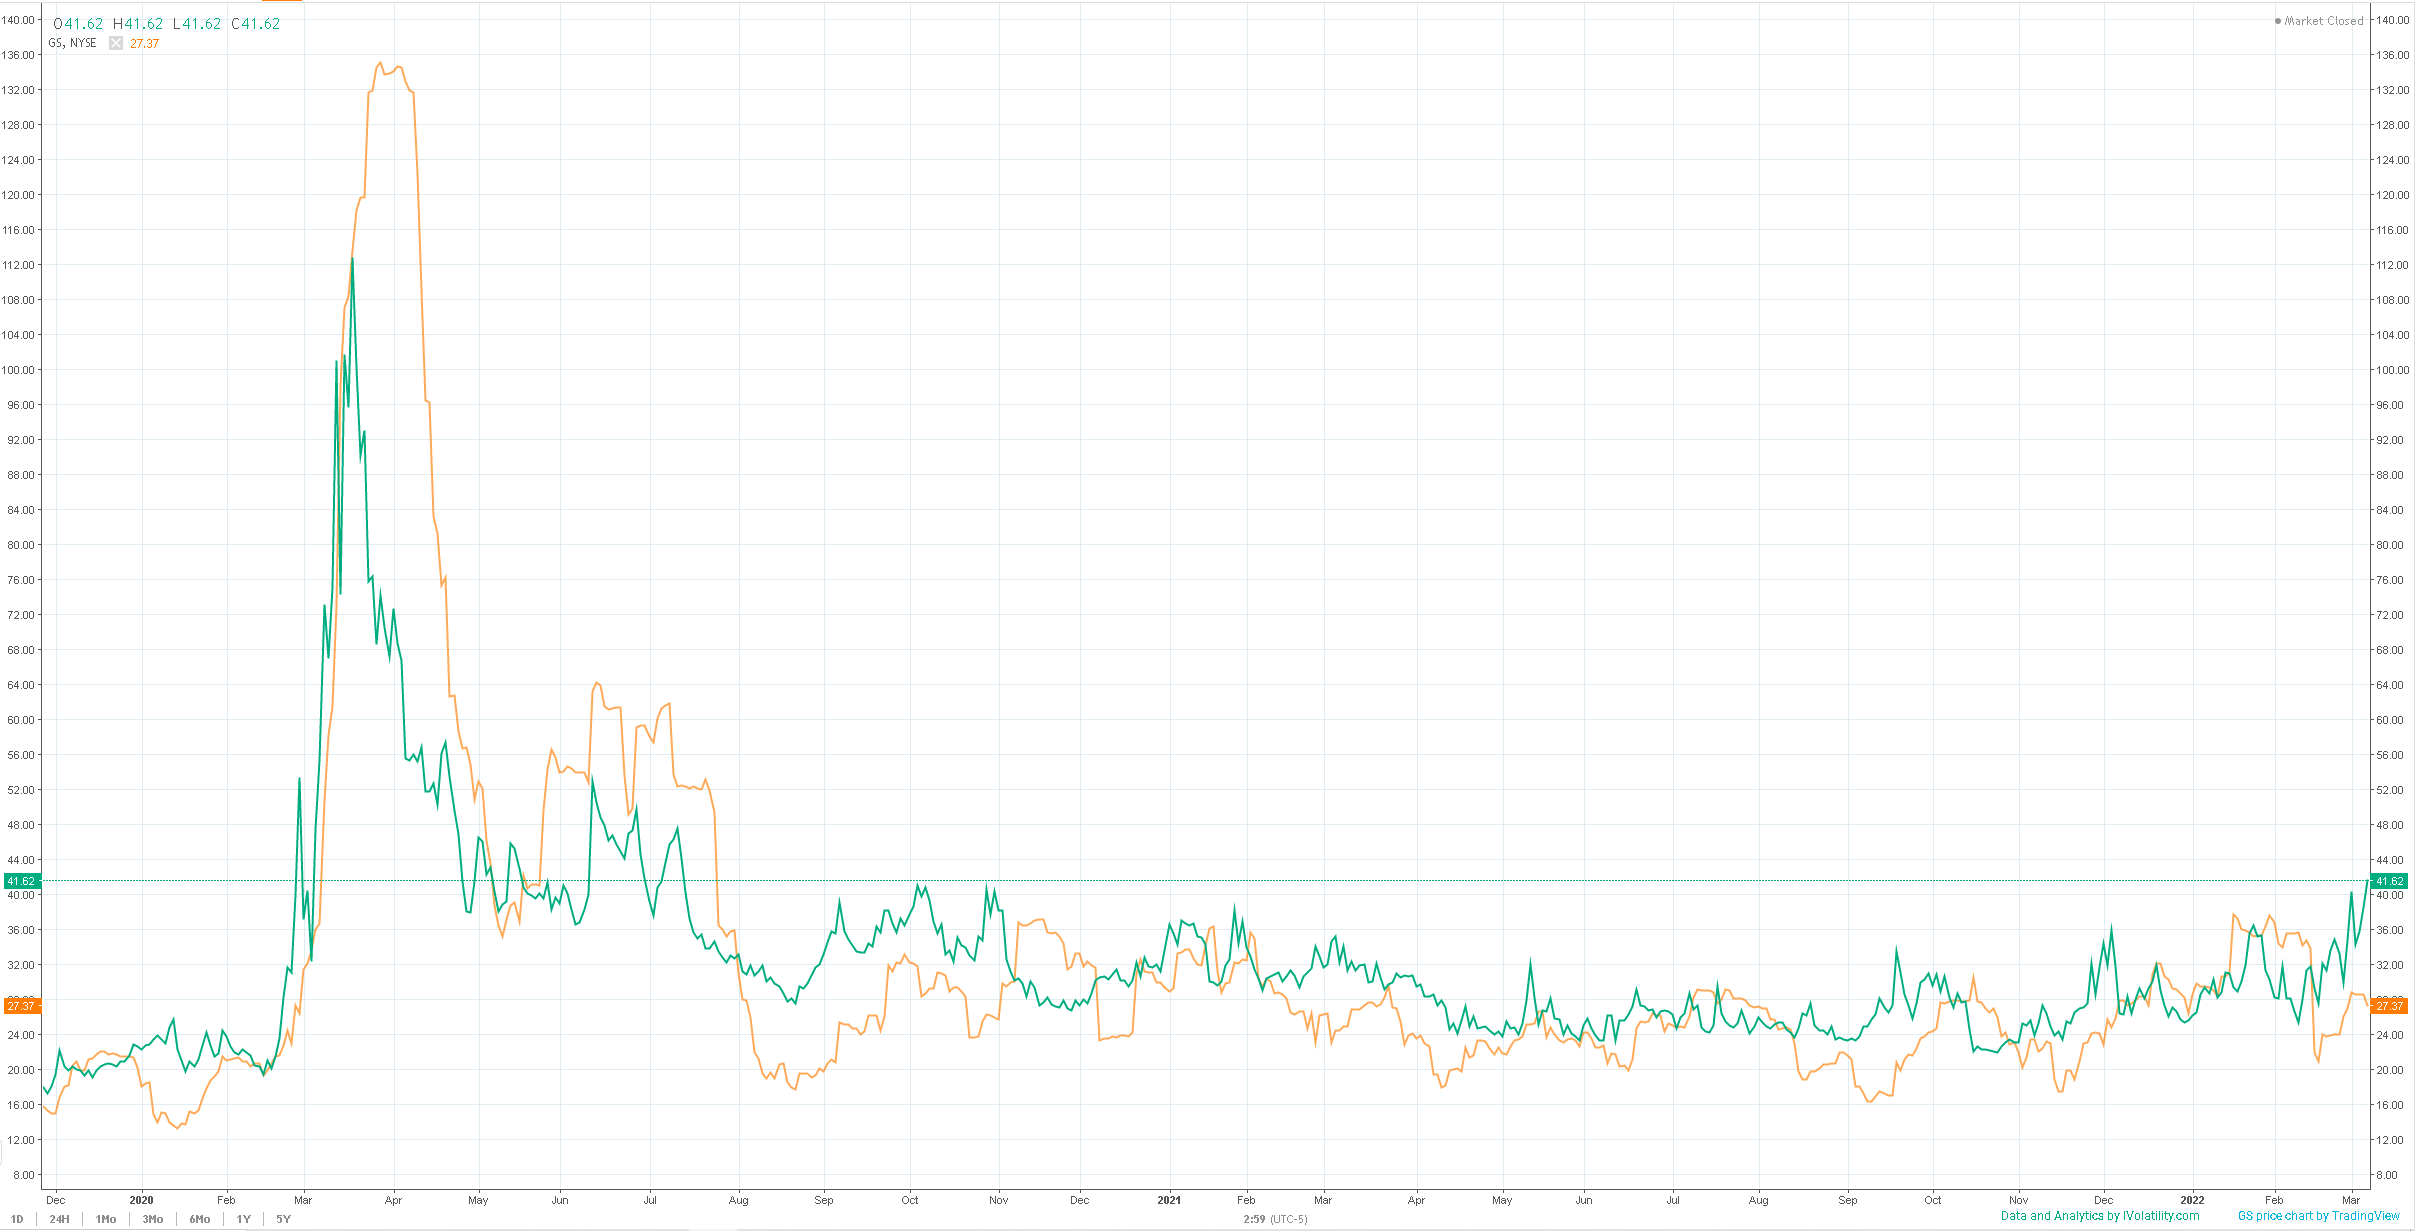
Goldman Sachs is one of those examples with its 30d IVX trading at 41.63 while the 20d realized volatility is 27.37. Looking at the percentiles, over the last 12 months the current IVX is pretty much the most expensive it has been while the HV20 is sitting in its 69th percentile. |
|
Disclaimer - This information is provided for general information and marketing purposes only. The content of the presentation does not constitute investment advice or a recommendation. IVolatility.com and its partners do not guarantee that this information is error free. The data shown in this presentation are not necessarily real time data. IVolatility.com and its partners will not be liable for any loss or damage, including without limitation, any loss of profit, which may arise directly or indirectly from the use or reliance on the information. When trading, you should consider whether you can afford to take the high risk of losing your money. You should not make decisions that are only based on the information provided in this video. Please be aware that information and research based on historical data or performance do not guarantee future performance or results. Past performance is not necessarily indicative of future results, and any person acting on this information does so entirely at their own risk. |