We offer multiple professional grade services to help you gain insight on volatility trading. Do not hesitate to try our products FOR FREE by clicking HERE |
The Market Update is a daily newsletter written by the team at iVolatility.com. Leveraging our analytics and data we are able to update you on key developments in the volatility market. To receive the Market Update directly into your inbox, please open a free account or visit our SITE where it is published every day. |
Market Update: 2022-03-10 |
Yesterday was one of the strongest days for European markets since late 2020 when it was announced that a Covid vaccine had been developed. |
Eurozone banks went up almost 10%. The Germany DAX finished about 8% higher. US indices rallied as well although in a more moderate fashion with SPX up 2.5% and NDX up almost 4%. |
Volatilities deflated significantly, 30d IVX for the DAX was more than 4 points lower while 30d IVX in the SPX was about 2 points lower. |
Markets remain focused on the geopolitical tensions and traders are hunting for any development on that front. Upcoming central banks meeting will also be very important in setting the tone for the next move in the market. |
Yesterday was also a very important day as we released two of our newest features that will help traders understand moves in the market. Those two features are part of the Charts service. |
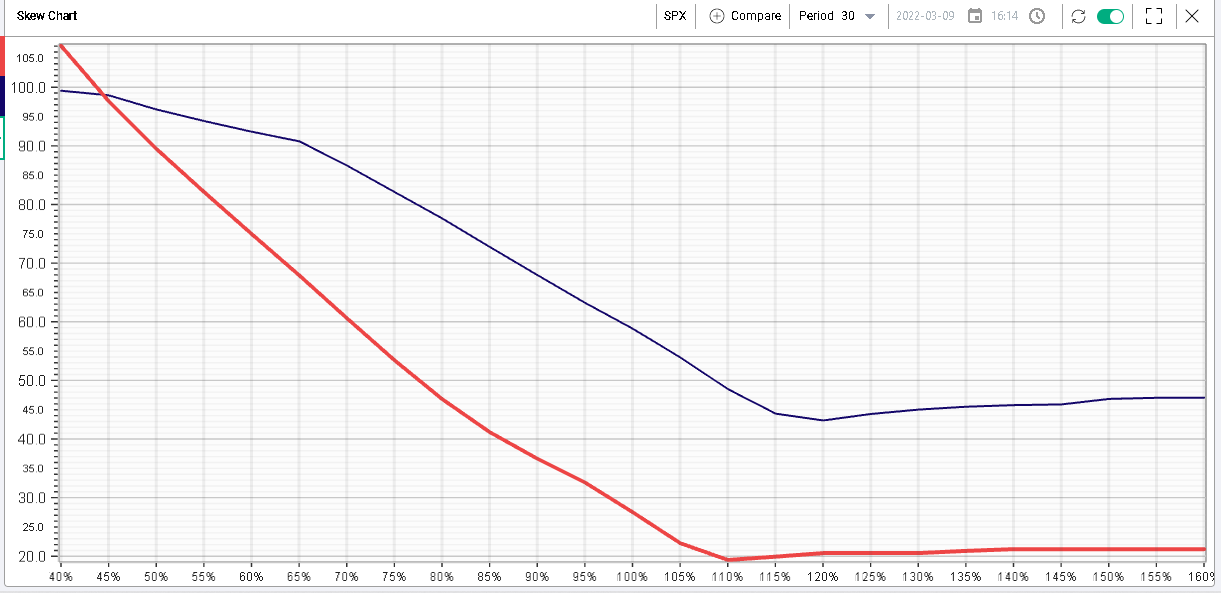
First, we are introducing our new skew chart defined as the level of volatility for each of the relative strikes we cover, allowing traders to visualize rapidly the normalized volatility surface for a given expiration. |
This data is not only available in Realtime but also historically making it possible to compare the shape and levels of the skew curve across multiple historical periods. For instance, the below chart shows the 30 days volatility surface as of the 20th March 2020 compared with the surface today, a very useful tool to put things in context. |
|
Combined with the term structure chart, the new skew chart now offers traders an entire view of the 3d Surface across the time and strike cross sections. |
The IV premium chart was another highly anticipated release that we announced yesterday. It is now also available for users subscribed to our Charts service (currently part of the Pro package). |
In a nutshell, users will now be able to chart the historical implied volatility premium over the realized volatility and see how that spread has evolved over time. That extremely powerful metric is available not only in EOD mode but also intraday. |
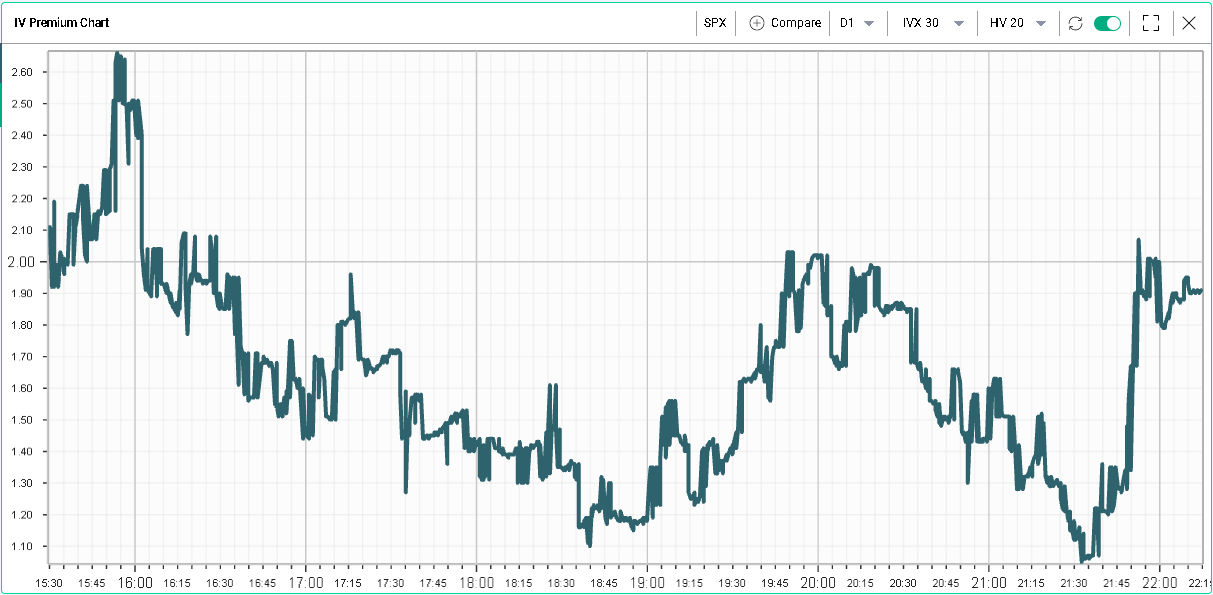
In the below example, we are showing the difference between the 30d IVX and the 20 days realized volatility for yesterday’s trading session in the SPX. The realized volatility is fixed and set at the level of the previous close while the implied volatility is produced in real time. |
|
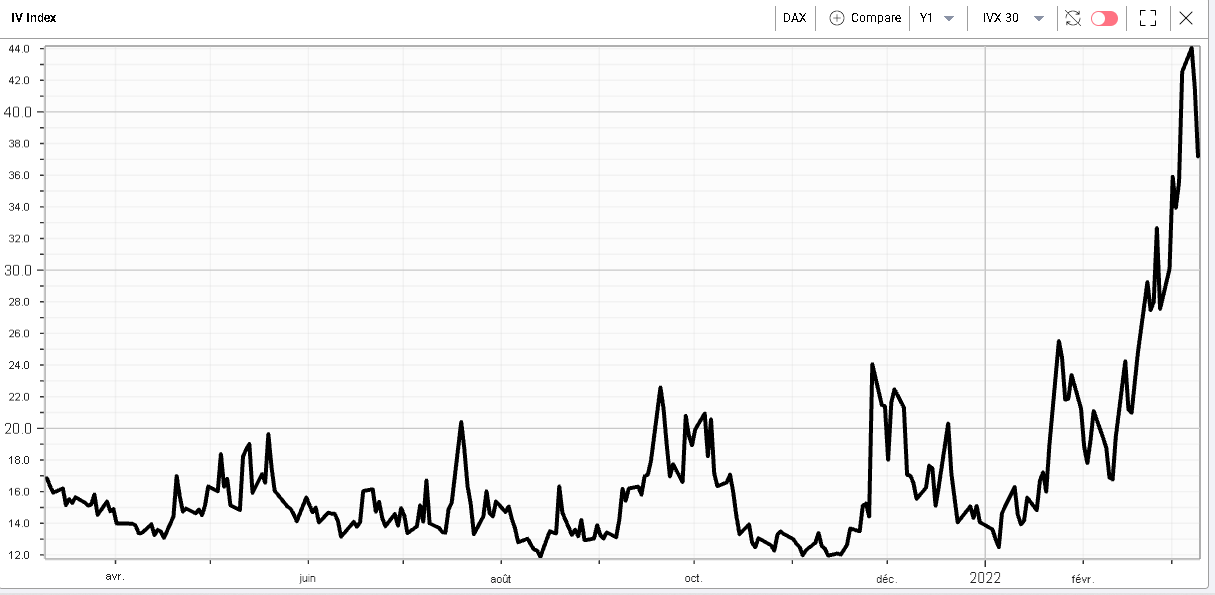
Coming back to yesterday’s price action, we can see in the chart below that the 30d IVX compressed significantly for the German DAX. |
|
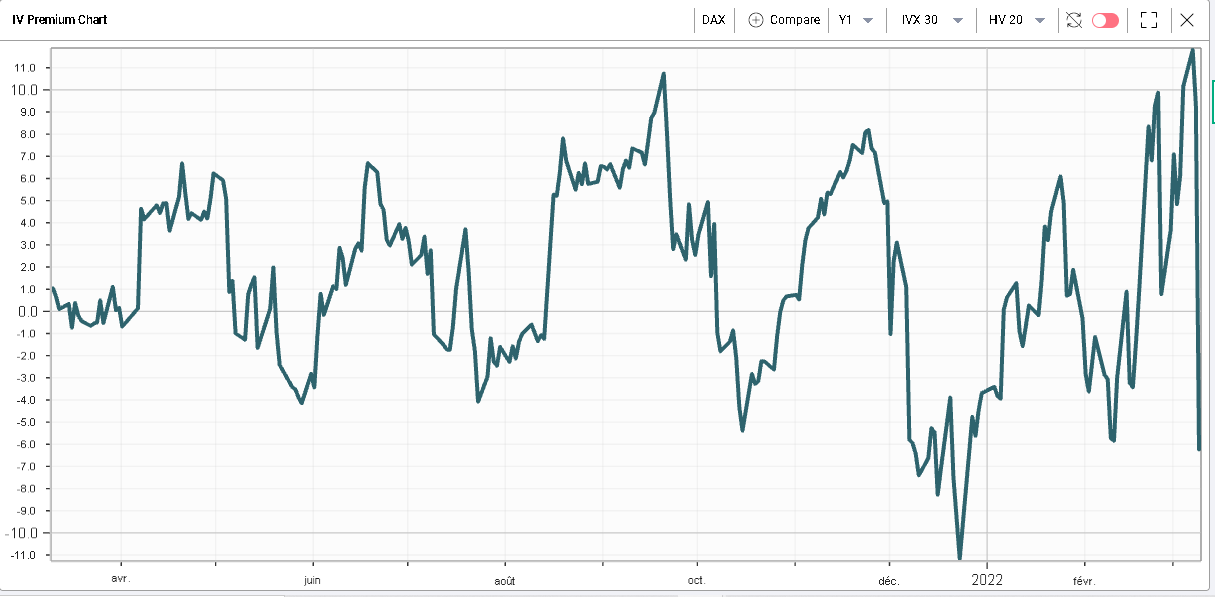
On the IV Premium chart, we can see that this reaction happened as the IV premium reached its highest level in 12 months. More importantly, the 30d IVX for the German DAX went from its highest level in 1 year to pretty much its lowest level in the space of 24 hours. |
|
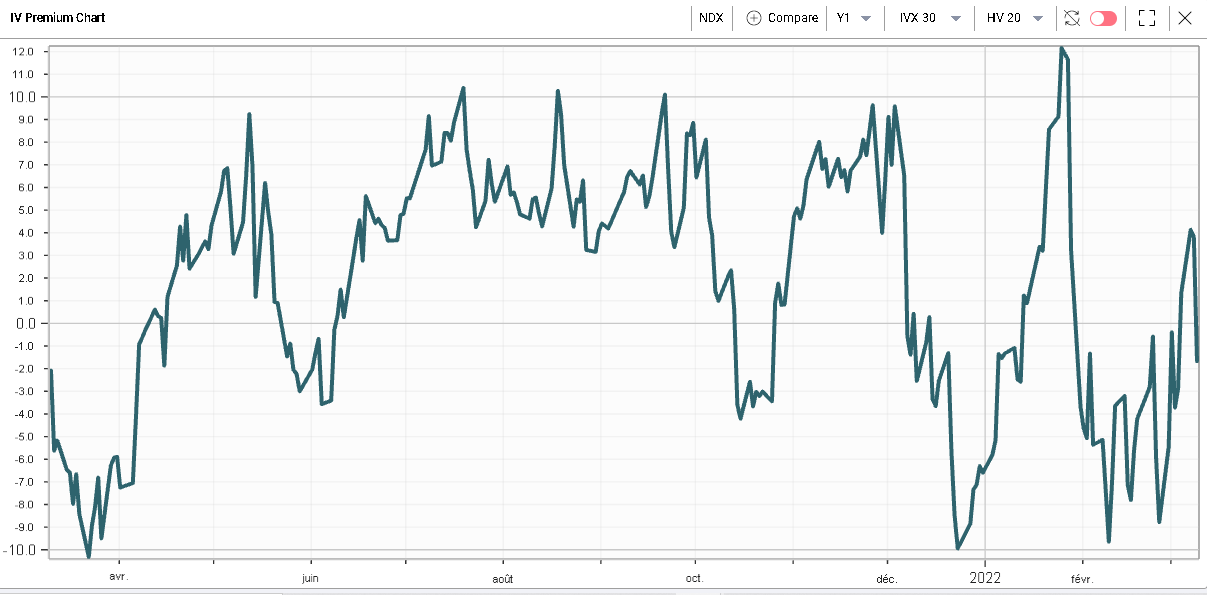
Looking at the same chart for the NDX, we can better explain why the IVX for US indices has underperformed the IVX for European indices. As we can see below, as realized volatilities for US indices remained constrained, the implied volatility failed to move significantly higher. |
|
Sector wise yesterday saw a reversal of most of what we described over the past few weeks. Energy lagged and finished down 3% with 30d IVX down about 5 points on the day. |
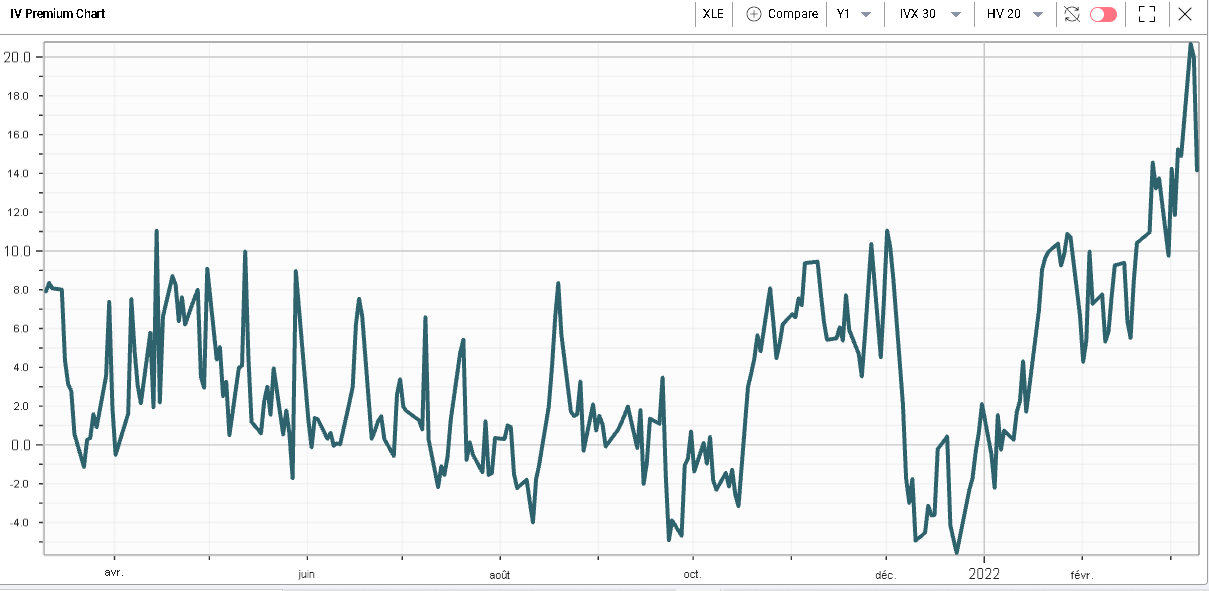
Do note that in the energy space, the 30d IVX remains very elevated relative to the 20d realized volatility, a phenomenon we highlighted in Wednesday’s newsletter. |
|
For instance, in the XLE, the 30d IVX is still trading at a 14 points premium to the 20 days realized volatility. |
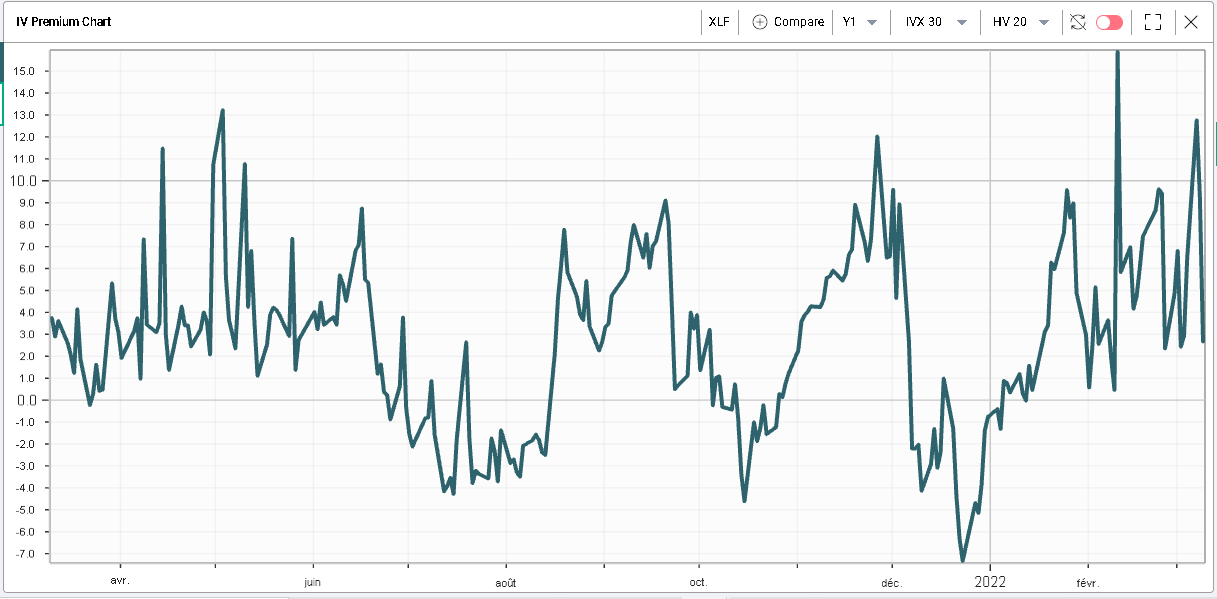
On the other hand, financials performed strongly up more than 3.5% on the day and with 30d IVX down about 4 points. Looking at the IV premium, we can see that it is now back to the middle of its 12 months range. |
|
In single stocks, we looked at call selling in CVX on Wednesday, please read that market update for more information. CVX was the worst performing stock within the DJIA yesterday closing down more than 2% and with its 30d IVX finishing about 3 points lower. |
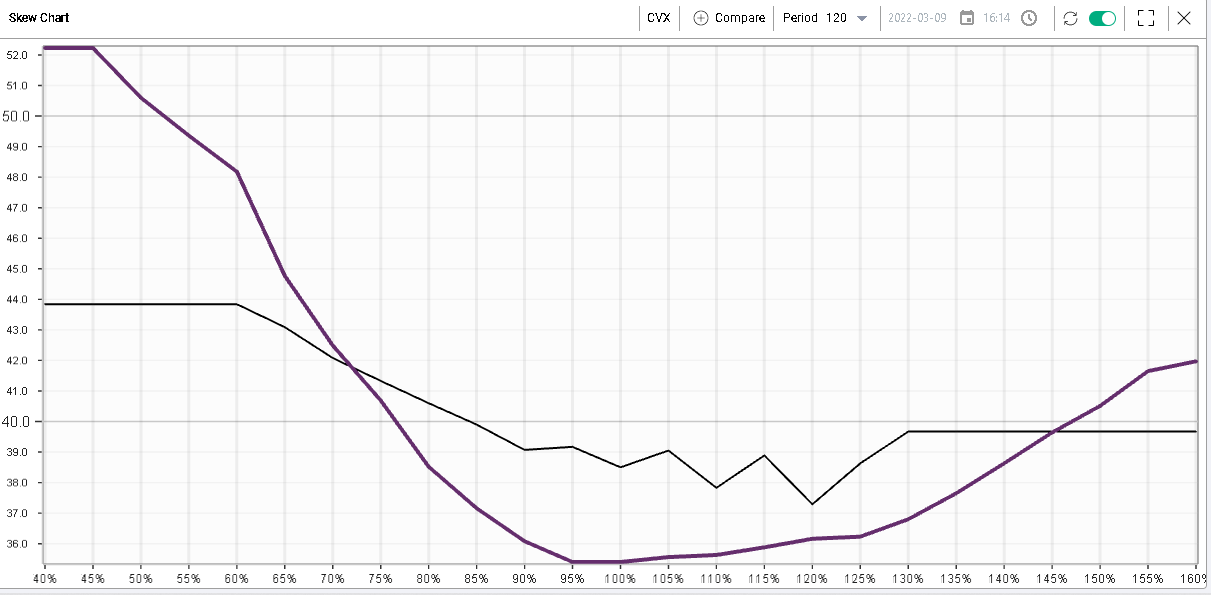
Looking at the change in skew shape for CVX, we show in purple the 90 days IV by strike as of last close compared to the dark line showing the 90 days IV by strike for the 8th Mar’22. We can see that while implied volatilities around the money sold off on the day, very far out of the money options (65% puts and lower or 145% calls and higher) actually went up in volatility. |
|
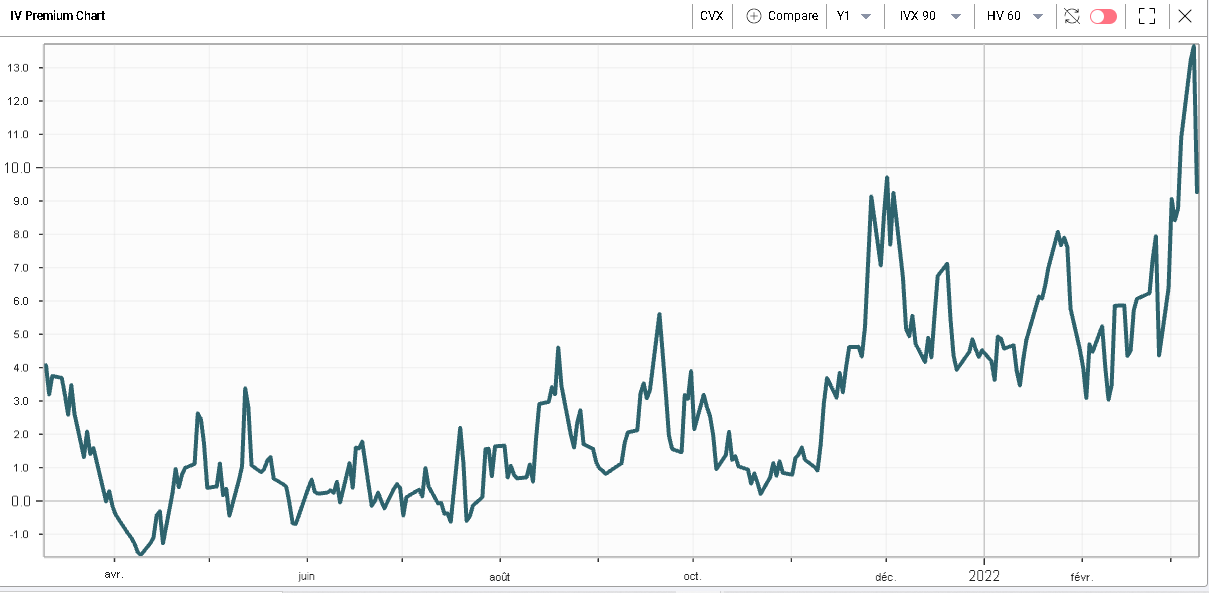
As CVX 90d IV vs 60d HV remains elevated historically as evidenced below, it is possible that some traders are looking to put on short bull vertical spreads or short bear vertical spreads in order to express their views at current levels. The resulting effect would most likely be to lower the level of volatility around the current spot levels and raise it for options further away. |
|
Looking at the RT Spread Scanner, we can find the most attractive bull and bear vertical spreads to sell in CVX, for example below we show in the table below the result of the scan for bull vertical spreads. |
|
Disclaimer - This information is provided for general information and marketing purposes only. The content of the presentation does not constitute investment advice or a recommendation. IVolatility.com and its partners do not guarantee that this information is error free. The data shown in this presentation are not necessarily real time data. IVolatility.com and its partners will not be liable for any loss or damage, including without limitation, any loss of profit, which may arise directly or indirectly from the use or reliance on the information. When trading, you should consider whether you can afford to take the high risk of losing your money. You should not make decisions that are only based on the information provided in this video. Please be aware that information and research based on historical data or performance do not guarantee future performance or results. Past performance is not necessarily indicative of future results, and any person acting on this information does so entirely at their own risk. |