We offer multiple professional grade services to help you gain insight on volatility trading. Do not hesitate to try our products FOR FREE by clicking HERE |
The Market Update is a daily newsletter written by the team at iVolatility.com. Leveraging our analytics and data we are able to update you on key developments in the volatility market. To receive the Market Update directly into your inbox, please open a free account or visit our SITE where it is published every day. |
Market Update: 2022-03-11 |
Markets paused yesterday with little price movements in the US while European indices corrected after their very large upside move on Wednesday. The German DAX finished about 3% lower while the SPX was down about 0.5% and the NDX finished about 1% lower. |
If last week felt like markets got caught by surprise by the developments in Eastern Europe and the subsequent moves in commodities, it seems that markets are getting more comfortable for now and maybe slightly more optimistic going into two highly anticipated events next week, namely the FOMC meeting on Wednesday and quarterly expiration of options and futures on Friday. |
Yesterday, the ECB tried to deliver a press conference without leaving too much of a stain on financial markets and judging by the subsequent reaction, president Lagarde seems to have done a pretty good job at it. Most commentators noted a slight hawkish tilt in the language from the central bank which recognized that geopolitical tensions represented a risk to growth but also represented a significant upside risk to inflation. It felt like the internal debate was intense and hawks seemed to have had the upper end as evidenced by the reaction in rates, 2-year German rates went up about 12 basis points on the news from -0.5% to -0.38%. It will be very interesting to see what the FOMC decides to do with regards to rates and how it explains its decision next week. |
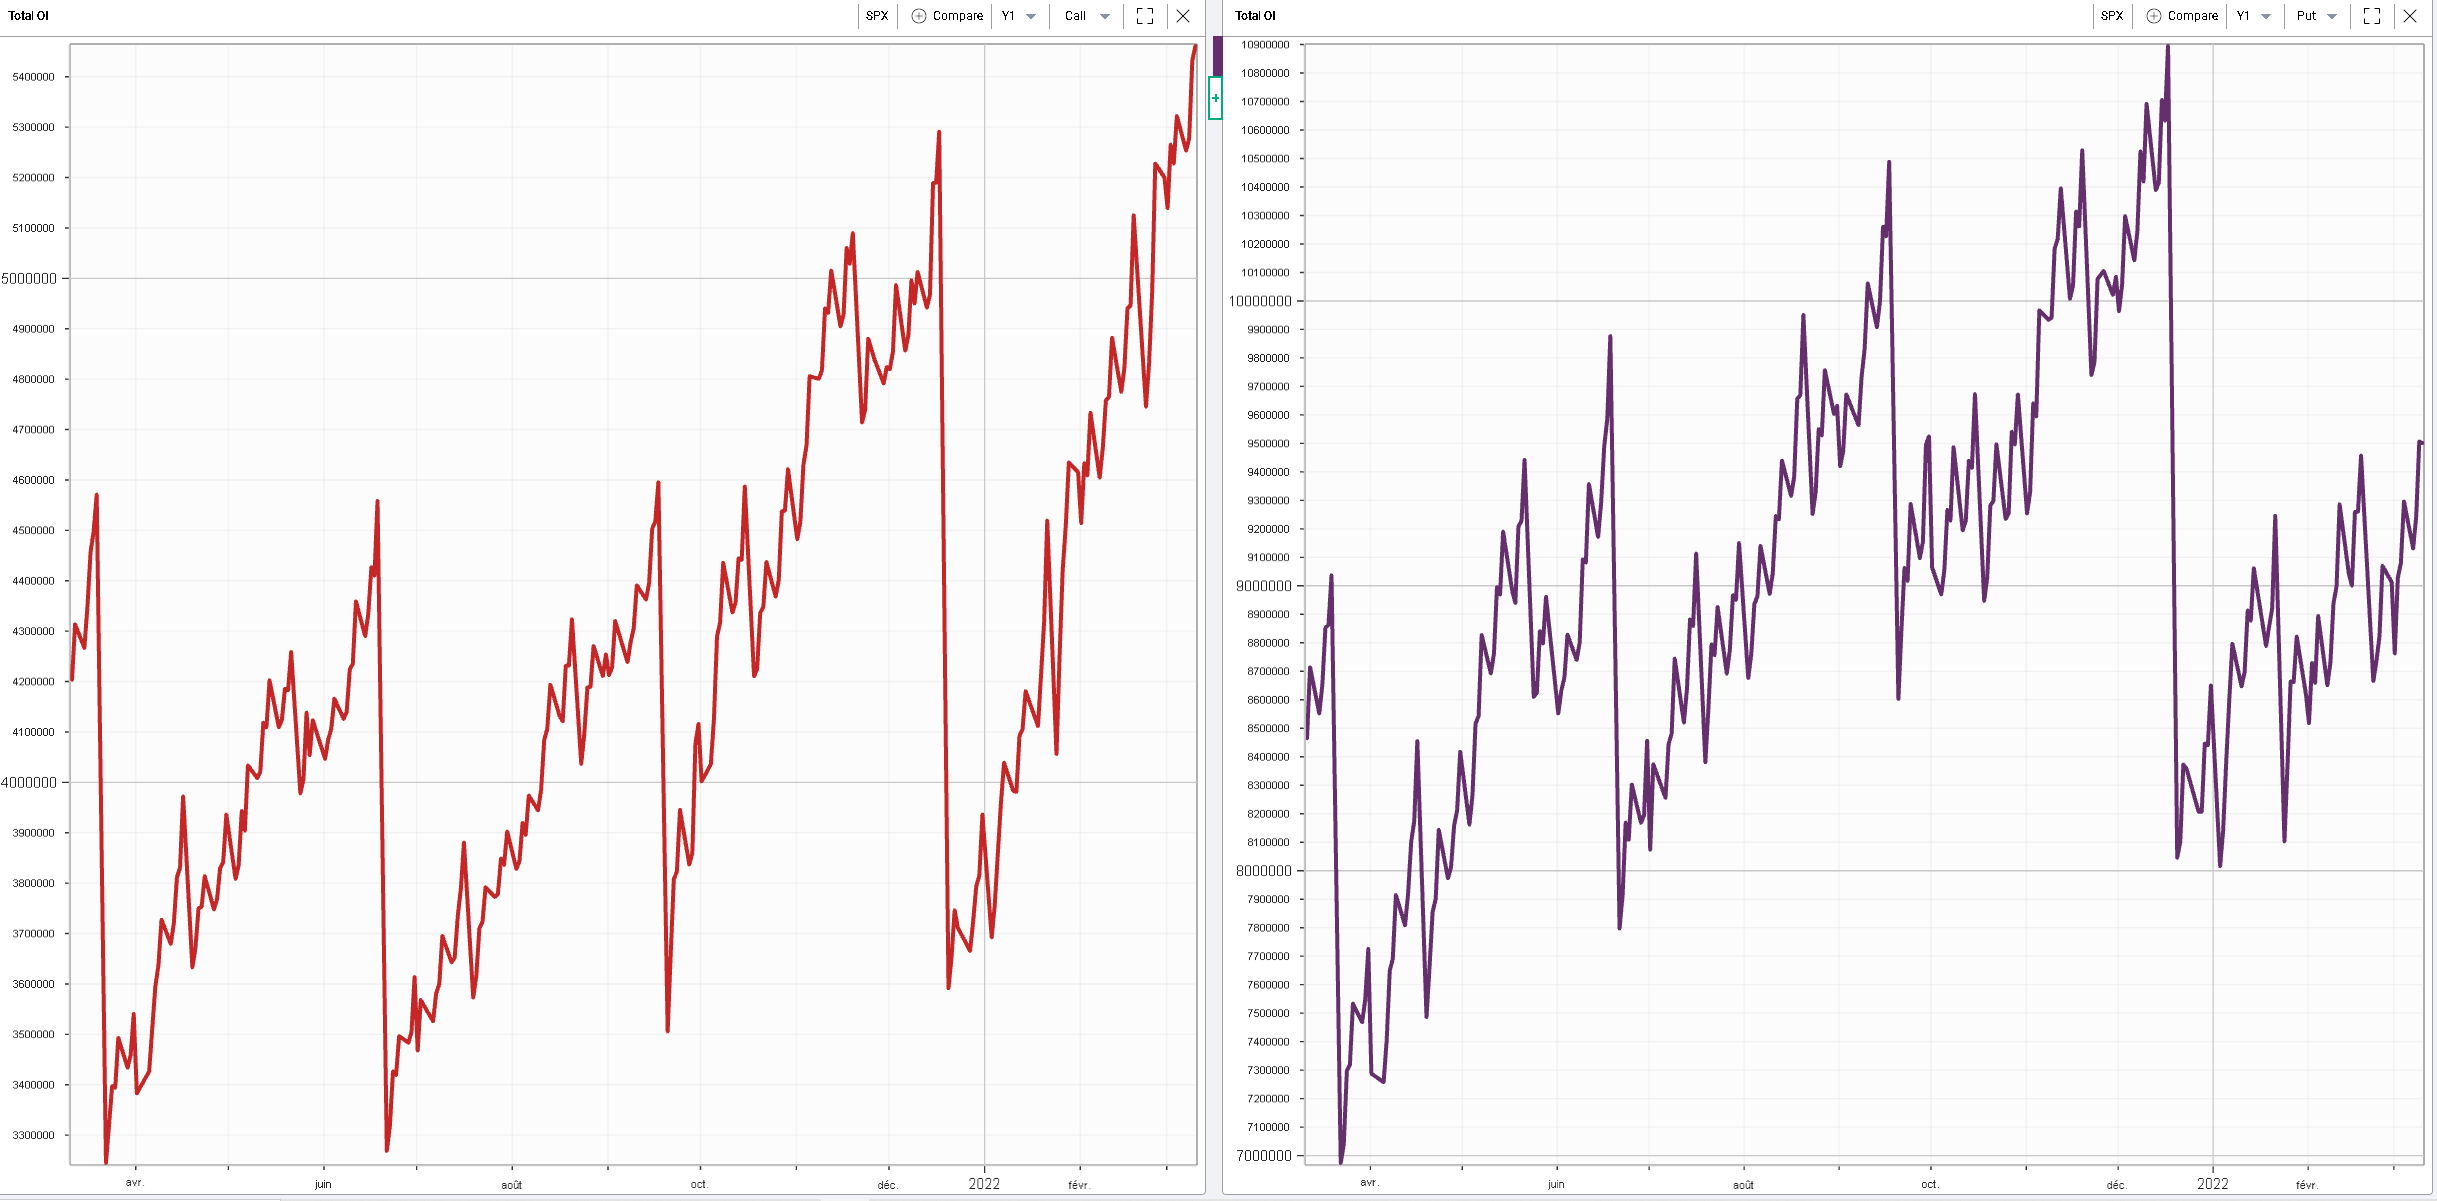
Looking at the chart below, we show the 12 months historical outstanding open interest for both calls and puts on the SPX. We can see that few positions on the put side (right chart) were actually opened on the SPX during the first three months of the year. On the other hand, significant positions were opened on the call side (left chart) with the current call open interest for the SPX reaching its highest level over the last 12 months, even surpassing the levels reached just before the Dec’21 expiry. |
|
The expiration of March contracts might significantly alter the positions held by market participants, forcing them to reengage and as such increasing trading activity in the weeks that follow the expiry. This observation, coupled with the possibility that the FOMC might influence market’s perception could create an environment of renewed market activity towards the end of next week and the following week. |
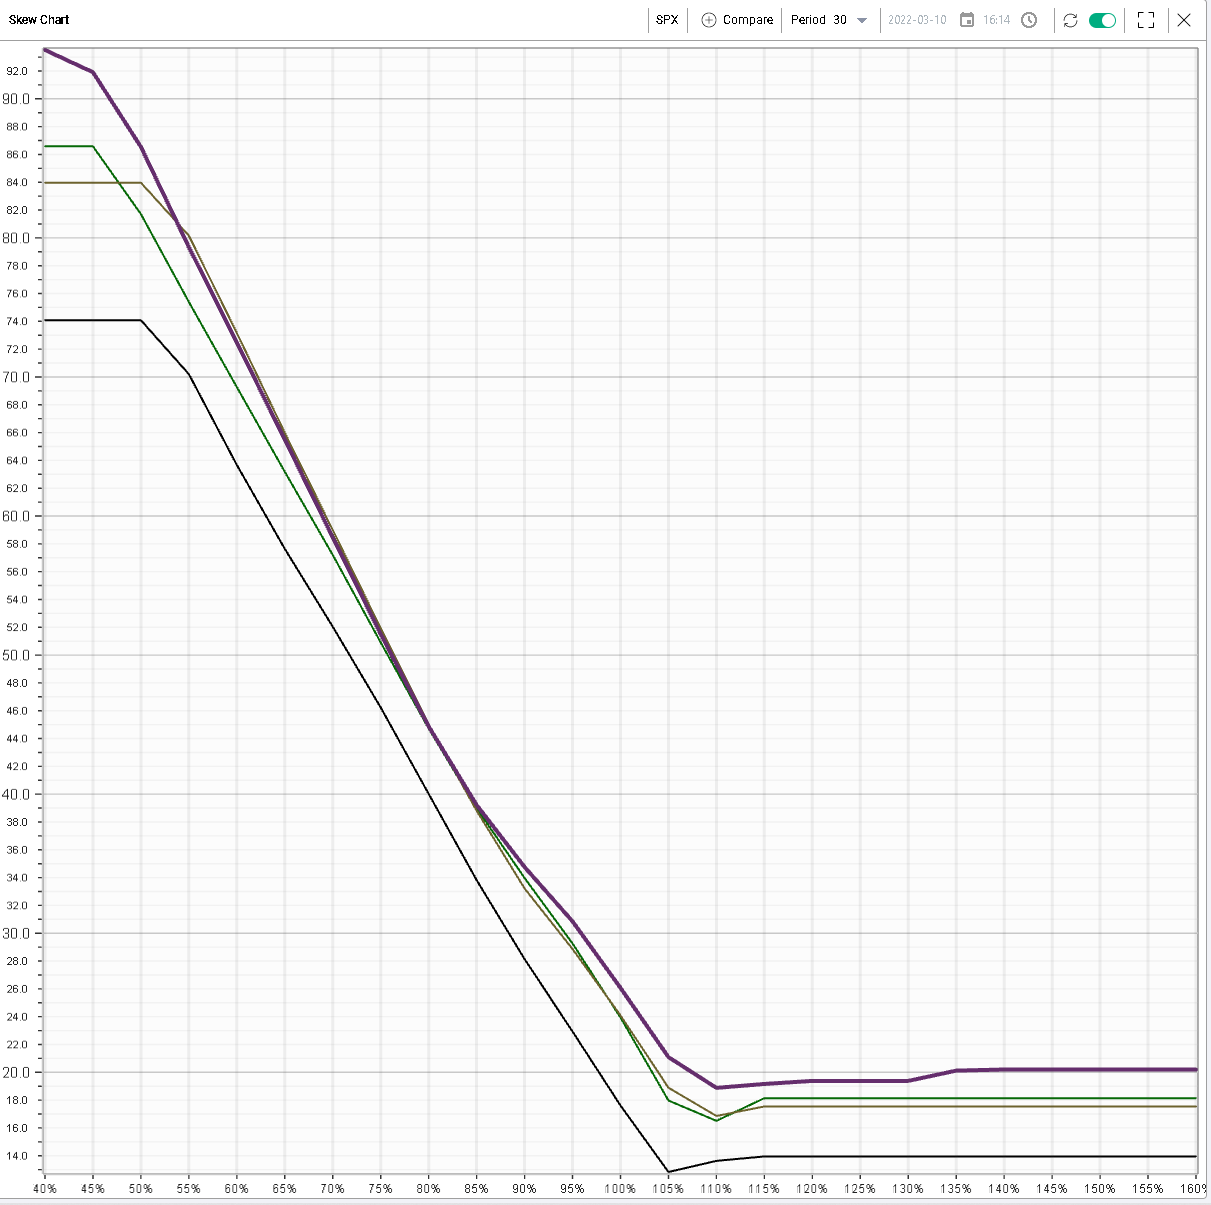
The chart below shows the 30 days skew for the SPX for the following dates: |
|
|
Although we can see that for US indices, the curves have parallel shifted higher from the December point, they are largely unchanged when compared with the Jan and Feb expirations. |
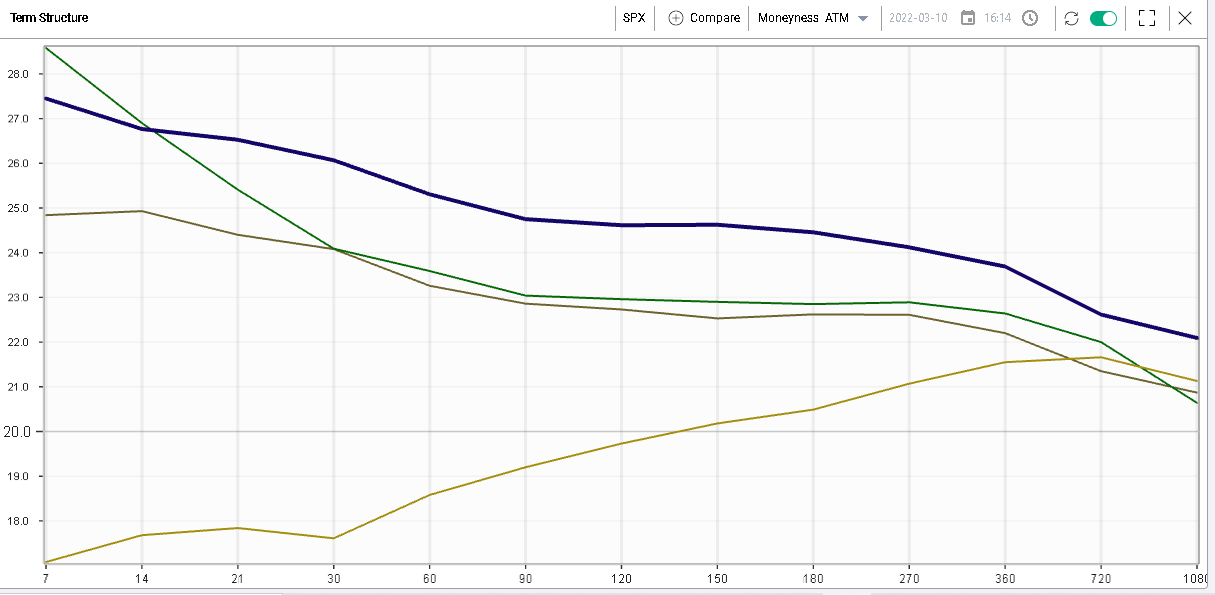
Looking at the term structure, the cross-section of at the money volatility and time, we can see a phenomenon that is globally pretty similar. We note the following lines: |
|
|
We can see that at the money implied volatilities across the curve are slightly higher today than on the day of the Jan and Feb expirations. For instance, 90d implied volatility is slightly less than 3 points higher. |
Going back to the skew curve, we can see that the upside (strikes above 100%) has gone up since the Jan and Feb expiration while downside strikes have remained relatively unchanged. This could lead us to think that the increase in call activity observed could have taken the form of call buyers emerging over the first few months of the year. |
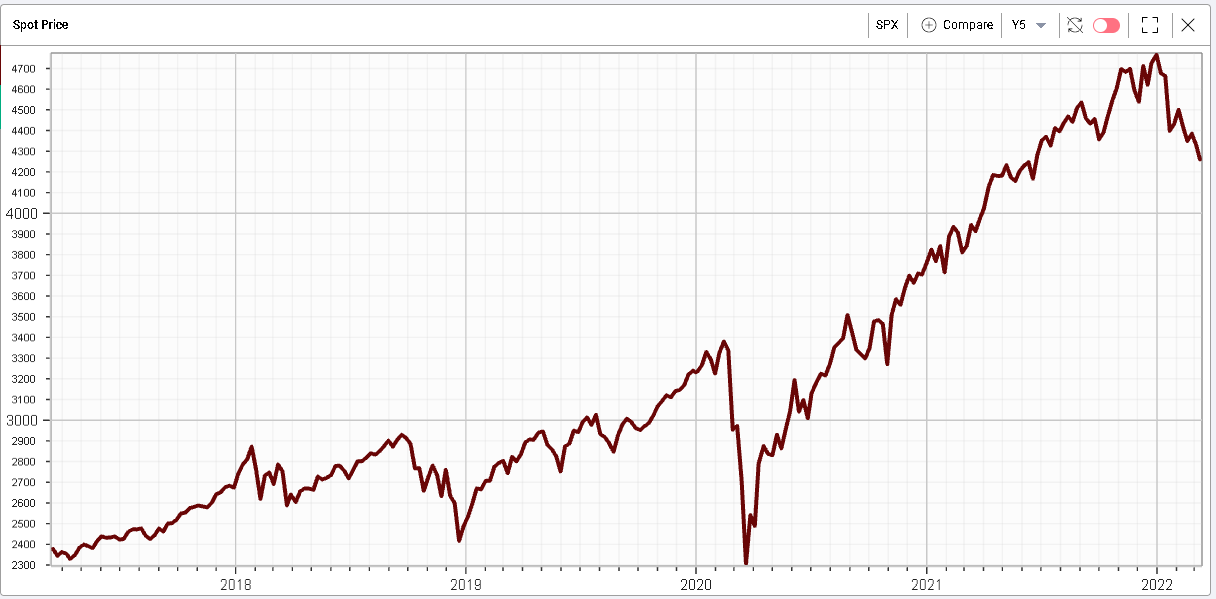
This could be explained by the amount of uncertainty in the market at this point in the cycle. Looking at the spot price of the SPX, the selloff that started at the beginning of 2022 really stands in stark contrast to what was previously witnessed since the Mar’20 lows. |
|
As a result, traders seem to remain nervous about a more durable change in the trend for the market and could be favoring calls as a way to continue expressing their bullish views while limiting the amount they stand to lose in an adverse scenario. |
Seeing how much of those will roll-out and the extent to which those positions are rebuilt over the next few weeks could also play a significant role in explaining some of the underlying moves both in the spot market and the volatility market. |
Looking at sectors, moves were pretty limited yesterday with Energy showing the best performance up 3% while the technology space remained under pressure and closed about 2% lower. |
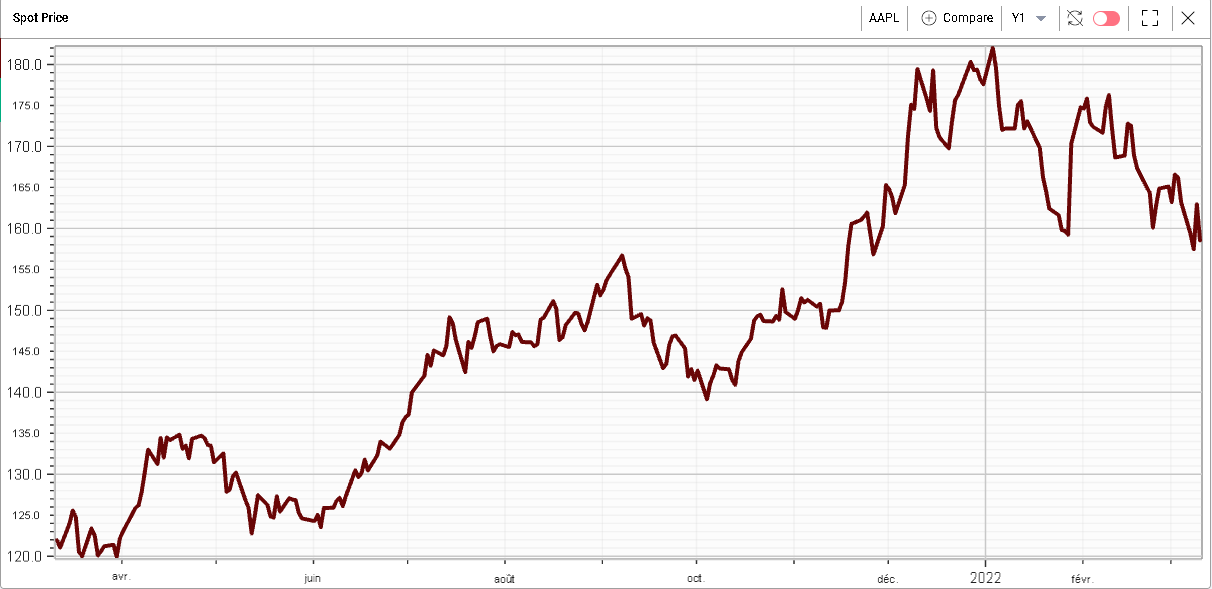
In single stocks within the DJIA, not much standing out apart maybe from AAPL which remains under pressure and finished down almost 3%. We highlighted earlier this week the importance of mega cap stocks for sentiment and it is interesting to see that AAPL has remained relatively weak for now. |
|
Disclaimer - This information is provided for general information and marketing purposes only. The content of the presentation does not constitute investment advice or a recommendation. IVolatility.com and its partners do not guarantee that this information is error free. The data shown in this presentation are not necessarily real time data. IVolatility.com and its partners will not be liable for any loss or damage, including without limitation, any loss of profit, which may arise directly or indirectly from the use or reliance on the information. When trading, you should consider whether you can afford to take the high risk of losing your money. You should not make decisions that are only based on the information provided in this video. Please be aware that information and research based on historical data or performance do not guarantee future performance or results. Past performance is not necessarily indicative of future results, and any person acting on this information does so entirely at their own risk. |