We offer multiple professional grade services to help you gain insight on volatility trading. Do not hesitate to try our products FOR FREE by clicking HERE |
The Market Update is a daily newsletter written by the team at iVolatility.com. Leveraging our analytics and data we are able to update you on key developments in the volatility market. To receive the Market Update directly into your inbox, please open a free account or visit our SITE where it is published every day. |
Market Update: 2022-03-14 |
Last week saw a strong divergence between European indices and US indices. The first group staged a rebound with the German DAX closing 4% higher on the week while the latter remained under pressure. The NDX finished the week down about 4% and the SPX was down about 3%. In Asia, Hong Kong stocks remain under severe pressure with the HSCEI finishing about 8% lower. 30d IVX was about 6 points lower for European indices while it was roughly unchanged for US indices. |
As flagged in previous market updates, two weeks ago we saw some very large moves with European indices under tremendous pressure and implied volatilities in Europe significantly outperforming their American counterparts as the geopolitical tensions in Eastern Europe escalated and commodity prices moved higher. |
Last week it felt like the market was trying to reduce positions waiting for further developments both on the geopolitical front and with central banks where the FED is expected to update markets next week. |
Looking at sectors in the US, the energy space was the only that managed to finish the week in positive territory, up around 2% despite Crude Oil finishing the week slightly lower. Consumer staples was the worst performing sector on the week down around 6%. This was partly driven by the exit from Russia for some of those companies while the increase in raw materials and more generally higher inflation are raising questions about the capacity of staples to pass on higher elevated costs to consumers without destructing demand. |
Tech was the second worst performing sector on the week, down around 4%. Despite those negative developments, from a volatility perspective, the market was pretty calm and overall US implied volatilities remained very steady. |
Most of the action continues to happen at the single stock level for now and even if headline indices may continue to send some signs of overall stability, underlying stock movements remain very elevated. As usual for practical reasons we focus our analysis on the components of the DJIA. On the upside, we do note that CAT was up almost 10% on the week while CVX managed to gain slightly more than 7.5%. Given the amplitude of those weekly price changes, traders also had to adjust the 30 days implied volatilities higher by around 1.5 points in CAT and 3.5 points in CVX. |
On the downside, PG and KO were the worst performing stocks down around 7.5% while KO 30d IVX was up about 1 point and PG was up around 2.5 points. We also note that DIS, NKE, AAPL and INTC were all down more than 5% on the week with 30d IVX remarking higher in all of those names. |
Although most of the attention has been focused on European centric issues (Ukraine/Russia conflict – ECB’s decisions) or US centric issues (FOMC meetings – Inflation), the price action in Chinese stocks deserves some spotlight. |
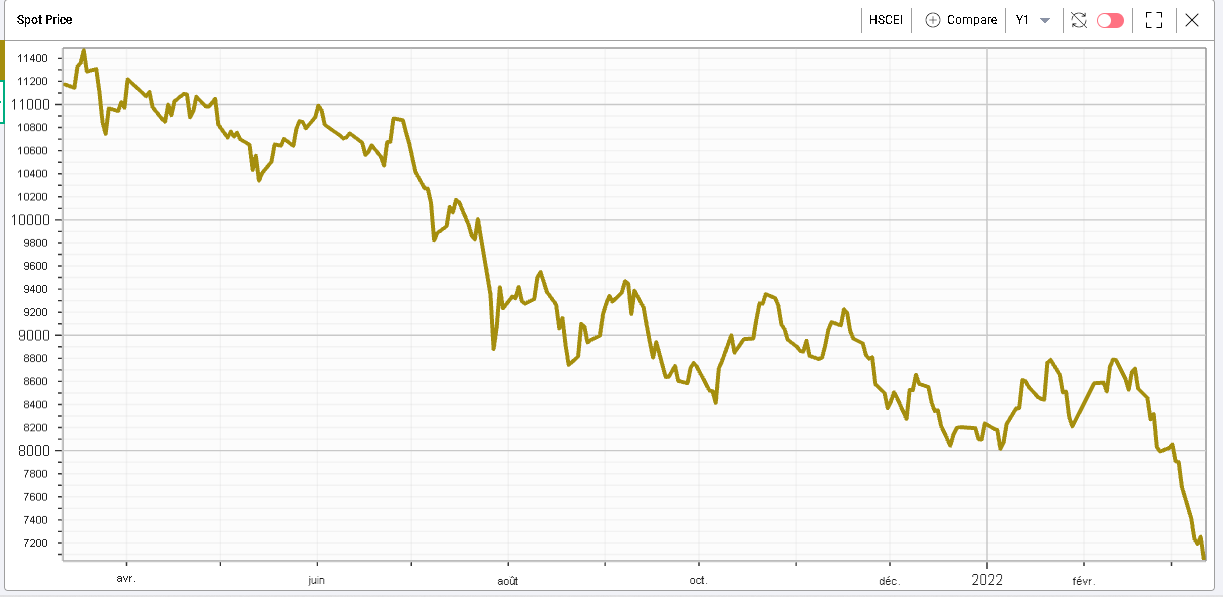
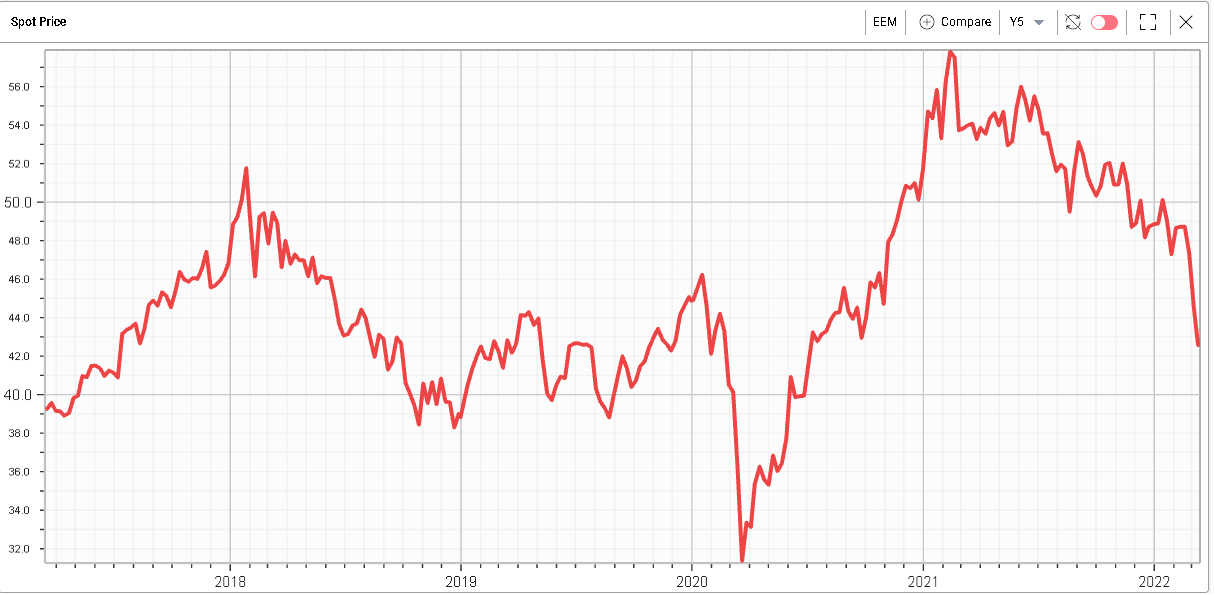
Below we see the spot price of the HSCEI an index of Hong Kong stocks for the past 12 months: |
|
Since the 18th February 2022, the index is down 18%, and it feels like after a period of stabilization in early 2022, the last few weeks have seen an extremely important wave of capitulation. |
To put things in context, the index closed last week at its lowest point since March 2009. If the SPX was trading at the same historical level, it would be currently trading around 750 vs a current spot price of 4200. The German DAX which closed Friday at 13628 was trading around 3850 back in March 2009. |
Several issues have been raised in relation to the price action of Chinese stocks. There is an increased level of scrutiny from US regulators on US listed Chinese stocks raising concerns that some names might face delisting for failing to comply with existing regulation. Â There are also concerns about the domestic economy in China, in particular the real estate sector remains a big question mark for investors, a sector that has been instrumental in Chinese growth over the past decades. |
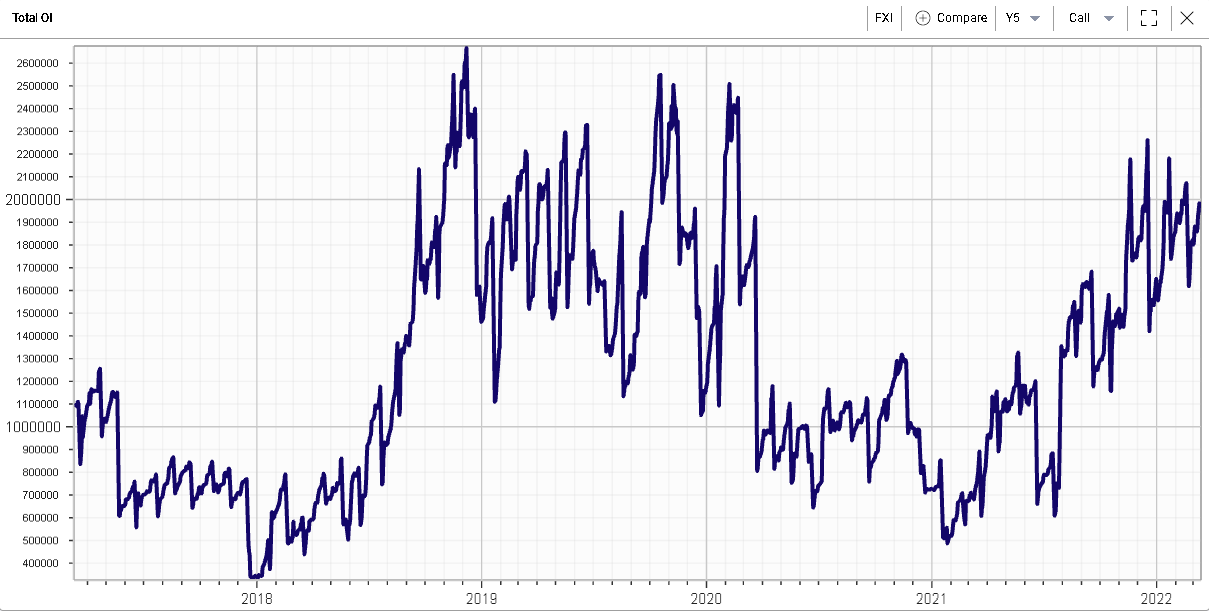
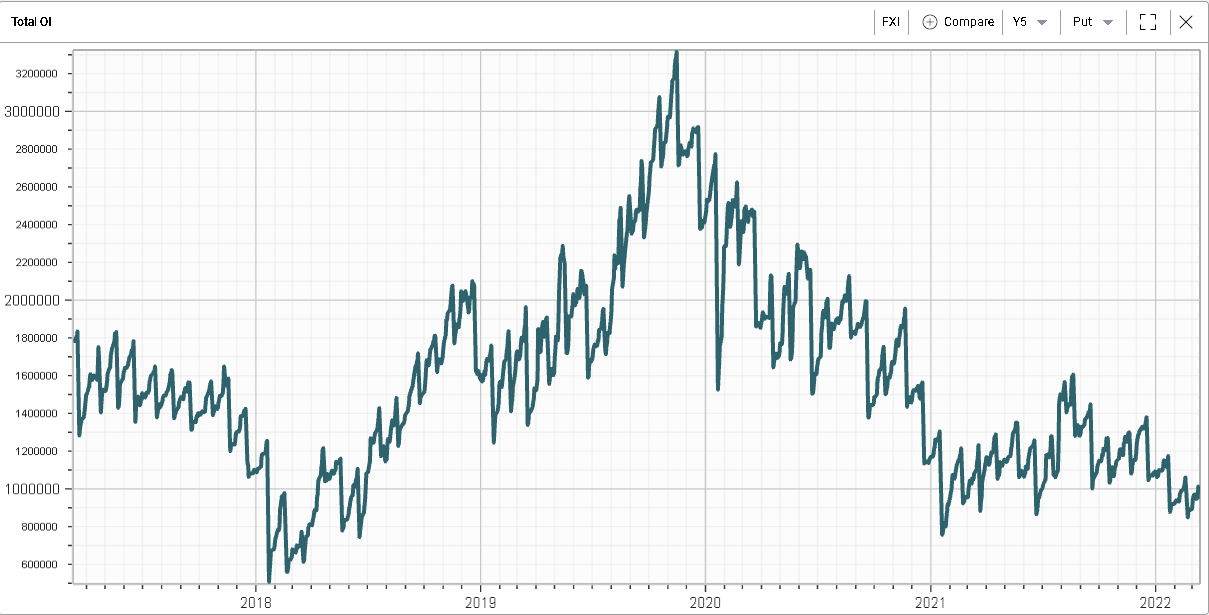
Overall, traders have remained cautious with regards to Chinese markets but some interesting trends have started to emerge. Looking at options open interest in the FXI a $5bln ETF tracking large cap Chinese stocks, we can see that the open interest on the call side has increased steadily throughout the selloff while put open interest has remained relatively low. |
FXI – Call open interest – Last 5 years |
FXI – Put open interest – Last 5 years |
It is also interesting to look at the shape of the term structure on the FXI compared to the shape it adopted for the first day of trading of the past 6 months. The green line which represents the term structure last Friday really stands out in this picture. |
|
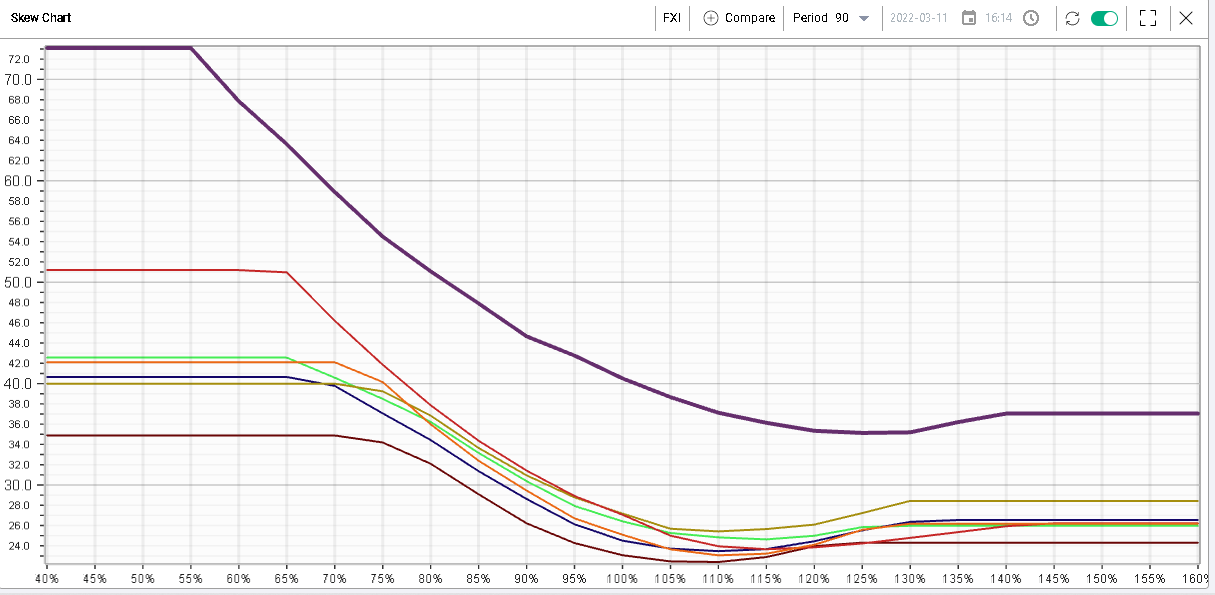
The same observation can be made below with the purple line last Friday’s skew for FXI. |
|
More broadly the entire EM complex has been unravelling with EEM losing more than 25% since its 2021 peak level. |
|
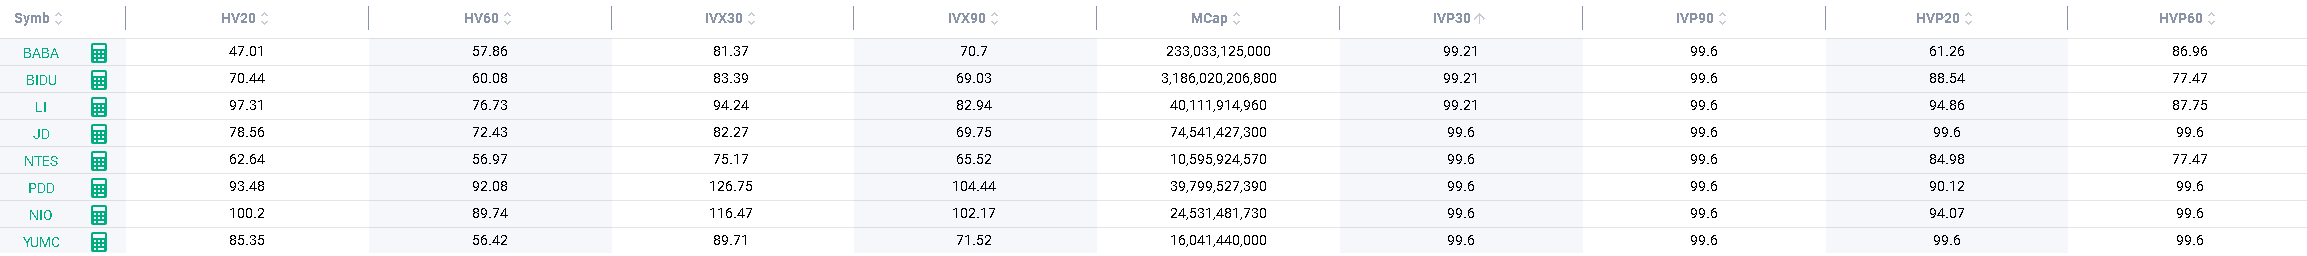
Zooming in on Chinese stocks listed on US exchanges, we find that for the largest names, implied volatilities are all trading at their highest levels for the last 12 months despite historical volatilities showing a somewhat more mixed picture. |
|
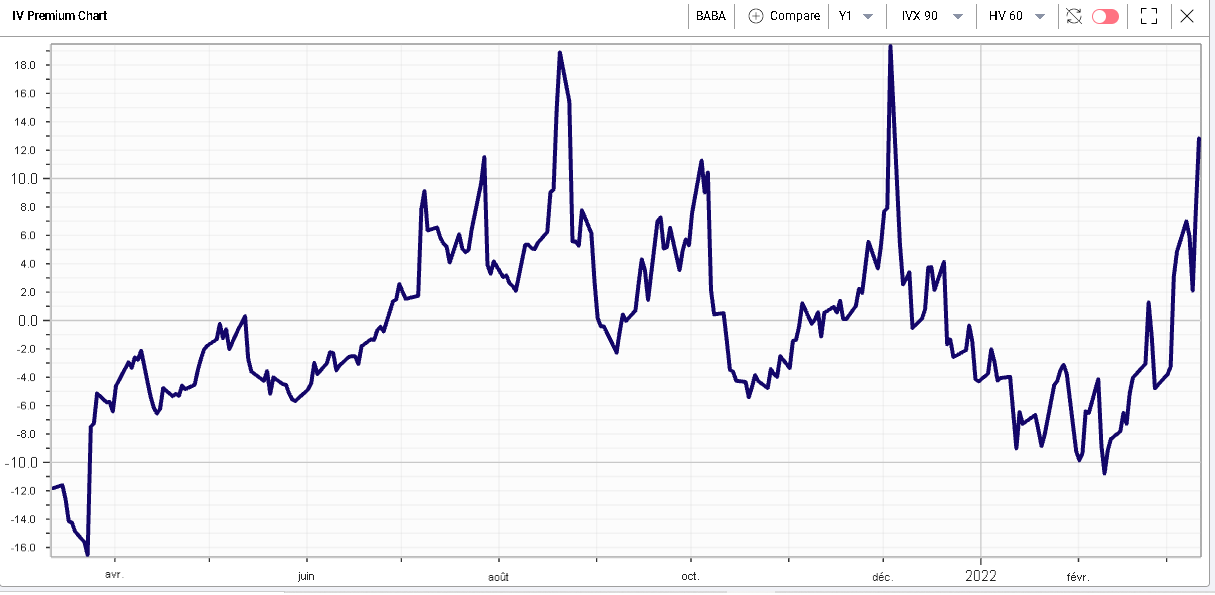
For instance, in BABA, which is down more than 60% over the last 12 months, the IVX90/HV60 premium is trading pretty much at its highest level in 12 months. |
|
Disclaimer - This information is provided for general information and marketing purposes only. The content of the presentation does not constitute investment advice or a recommendation. IVolatility.com and its partners do not guarantee that this information is error free. The data shown in this presentation are not necessarily real time data. IVolatility.com and its partners will not be liable for any loss or damage, including without limitation, any loss of profit, which may arise directly or indirectly from the use or reliance on the information. When trading, you should consider whether you can afford to take the high risk of losing your money. You should not make decisions that are only based on the information provided in this video. Please be aware that information and research based on historical data or performance do not guarantee future performance or results. Past performance is not necessarily indicative of future results, and any person acting on this information does so entirely at their own risk. |