We offer multiple professional grade services to help you gain insight on volatility trading. Do not hesitate to try our products FOR FREE by clicking HERE |
The Market Update is a daily newsletter written by the team at iVolatility.com. Leveraging our analytics and data we are able to update you on key developments in the volatility market. To receive the Market Update directly into your inbox, please open a free account or visit our SITE where it is published every day. |
Market Update: 2022-03-16 |
US indices managed to gain yesterday with the NDX up 3% and the SPX up 2%. Overnight, Europe moved higher up more than 2.5% at time of writing while Chinese stocks are catching a very strong bid on hopes of more policy support from the authorities. |
Implied volatilities continued to deflate in the US yesterday with 30d IVX down about 2 points on the day. |
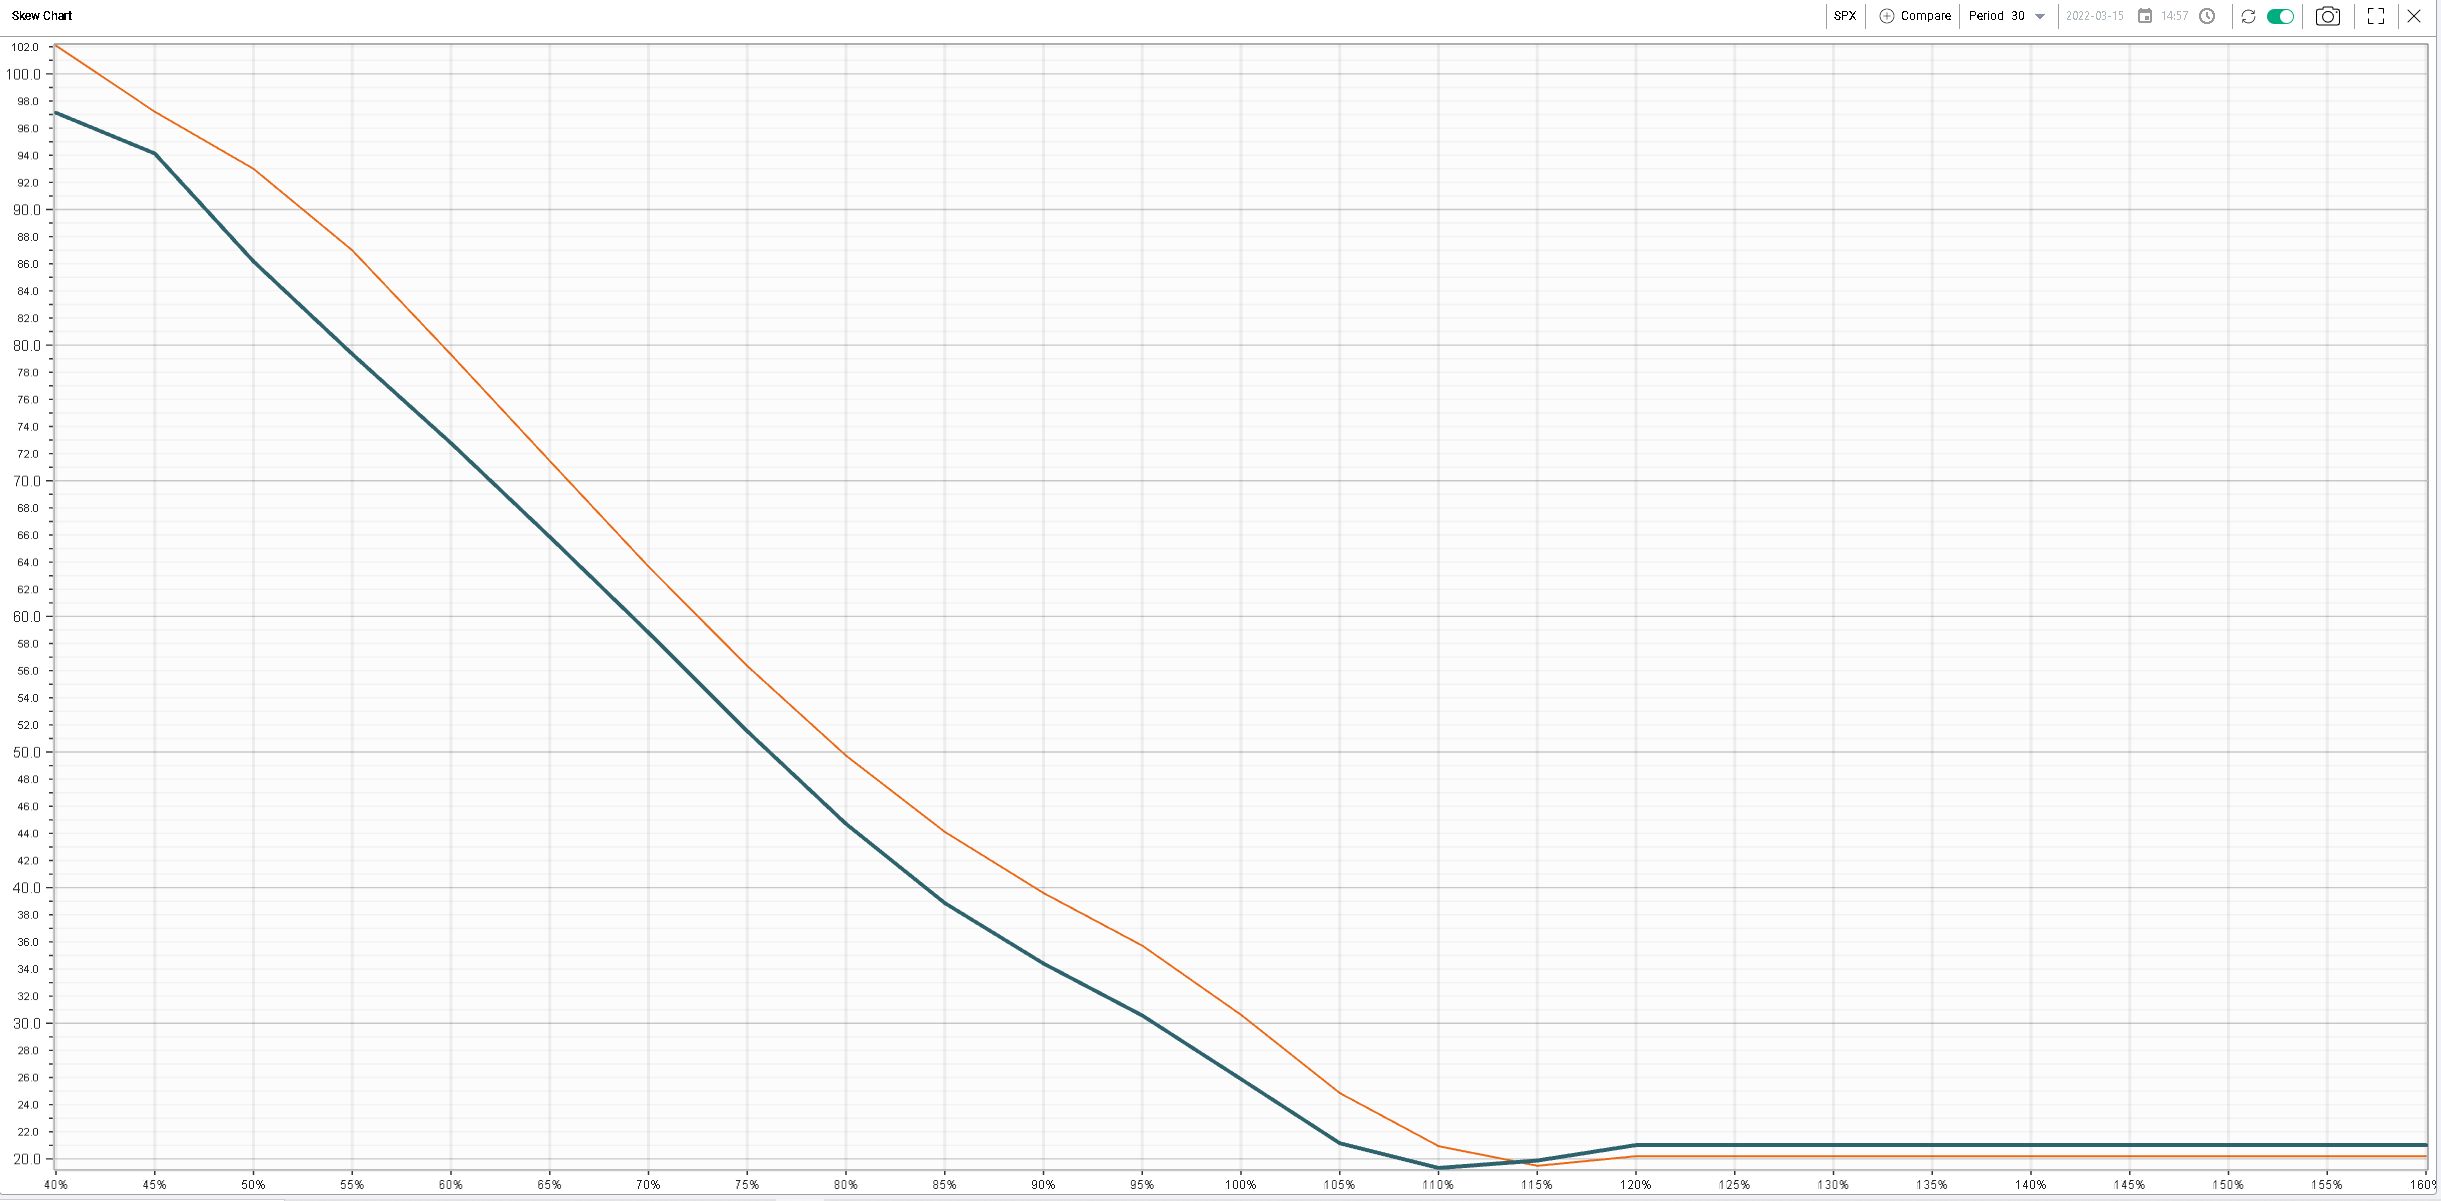
Comparing the 30d skew for the SPX with the shape from the 7th of March, the extent of the decrease in implied volatilities looks limited in particular on the upside. We flagged recently the increase in open interest for SPX calls, so this is a chart to keep an eye on around the expiration. |
|
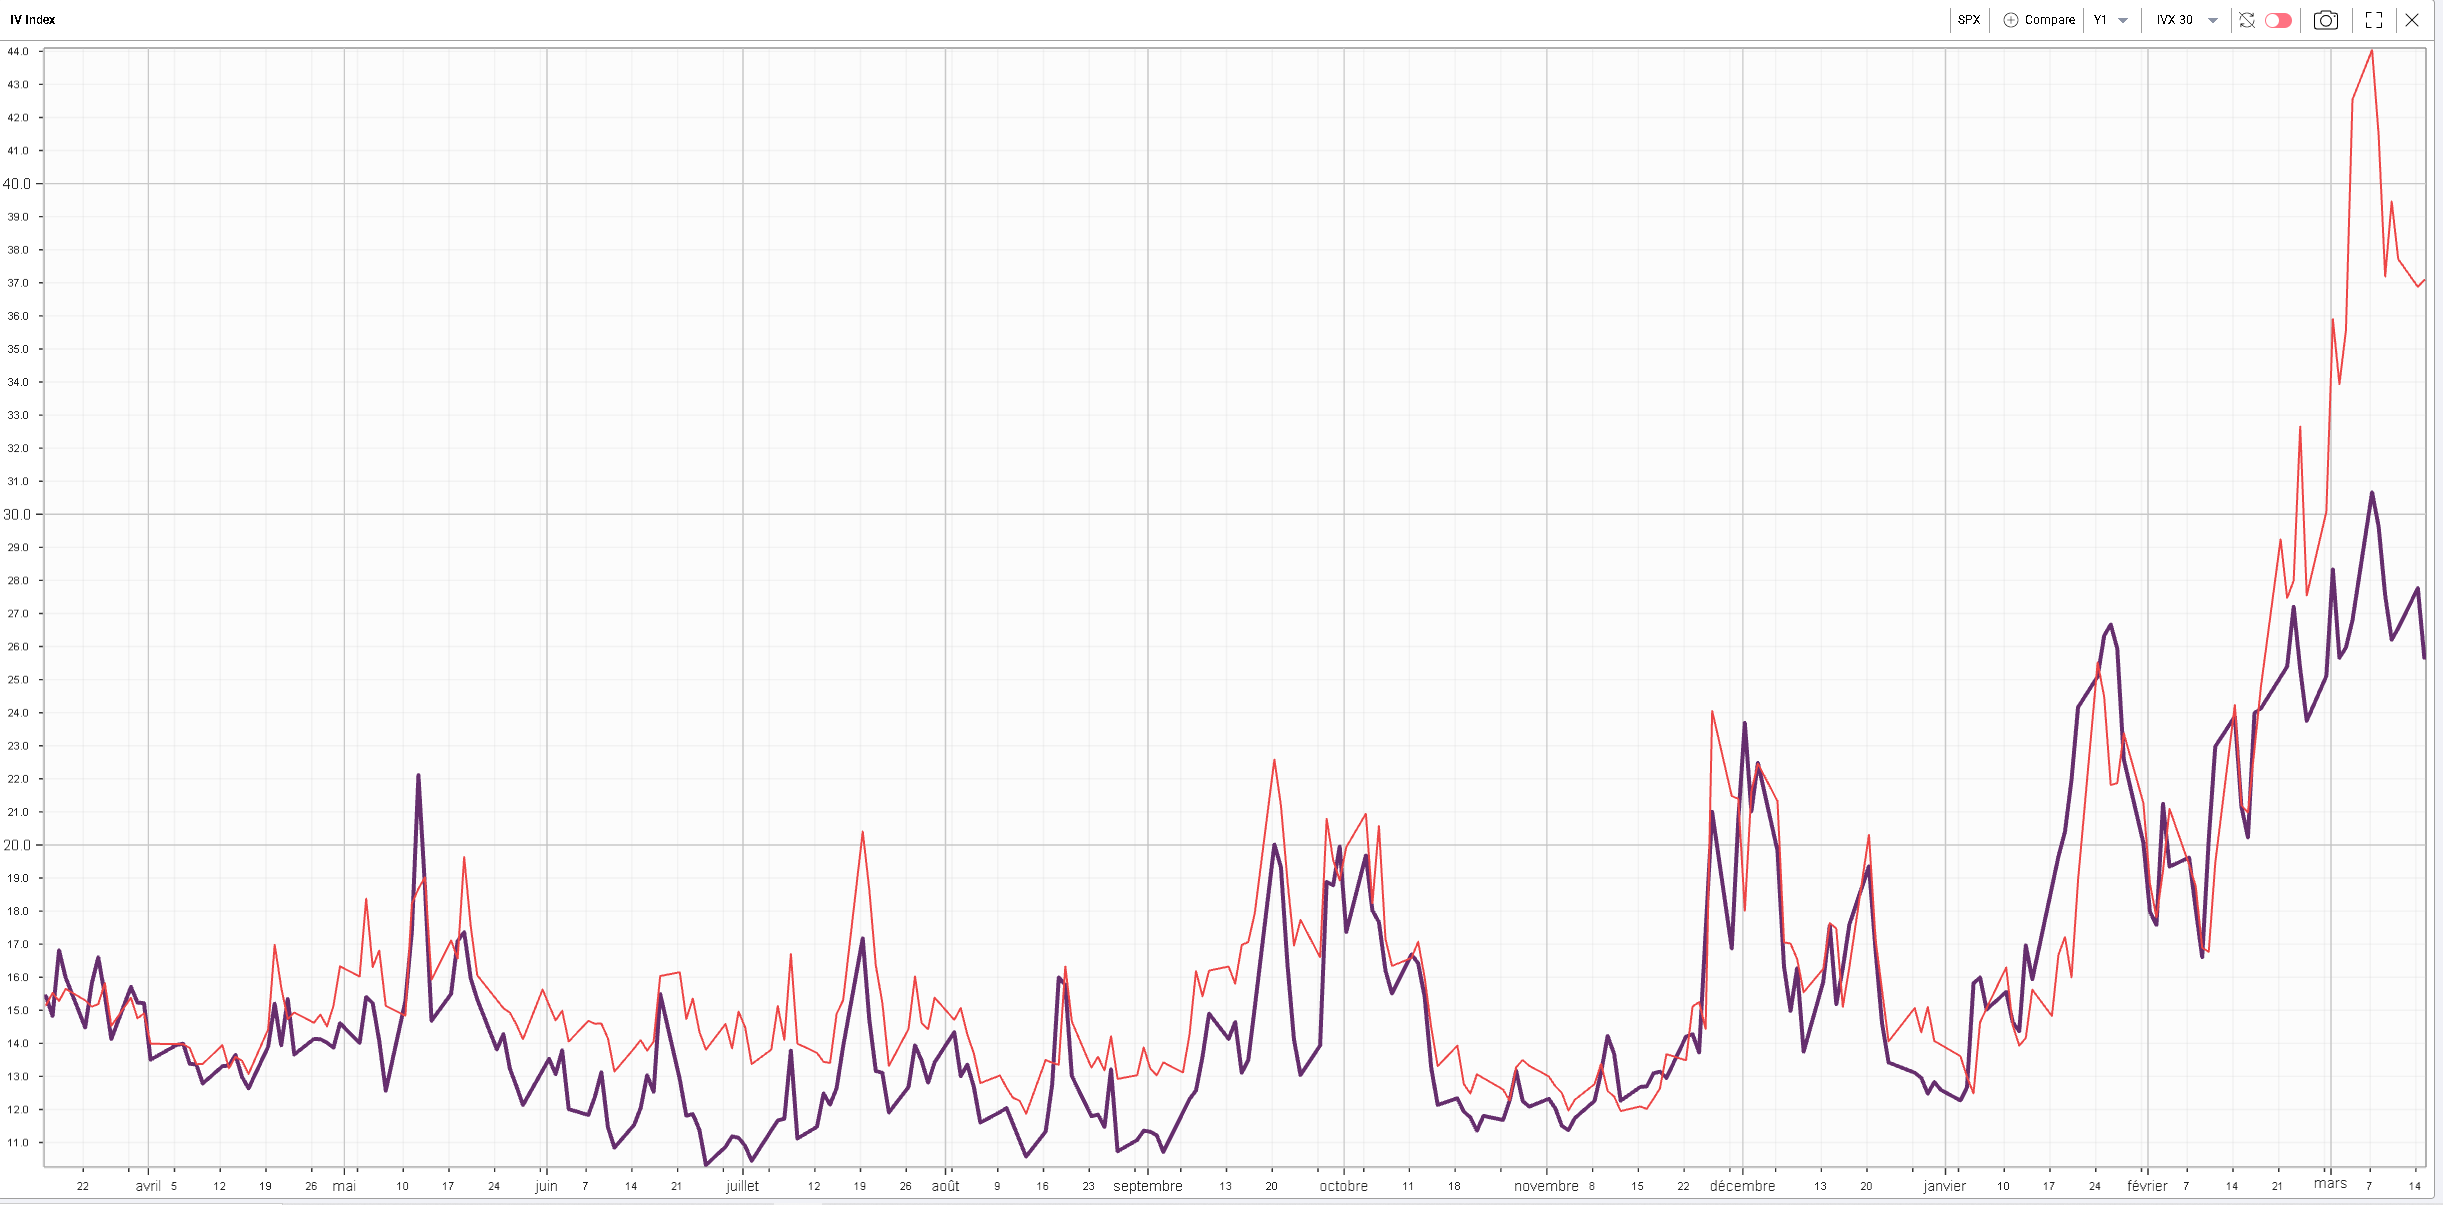
This being said, we should remember that the US implied volatilities generally underperformed their European counterparts on this move lower as shown by the below 1-year chart for 30d IVX for both the DAX (in red) and the SPX (in purple). |
|
Despite the relative stabilization in spot prices especially in Europe, we have yet to see a meaningful compression of the spread between European implied volatilities and US implied volatilities, which at the moment is really acting as a barometer for the perceived risk of an escalation of the conflict by options traders. |
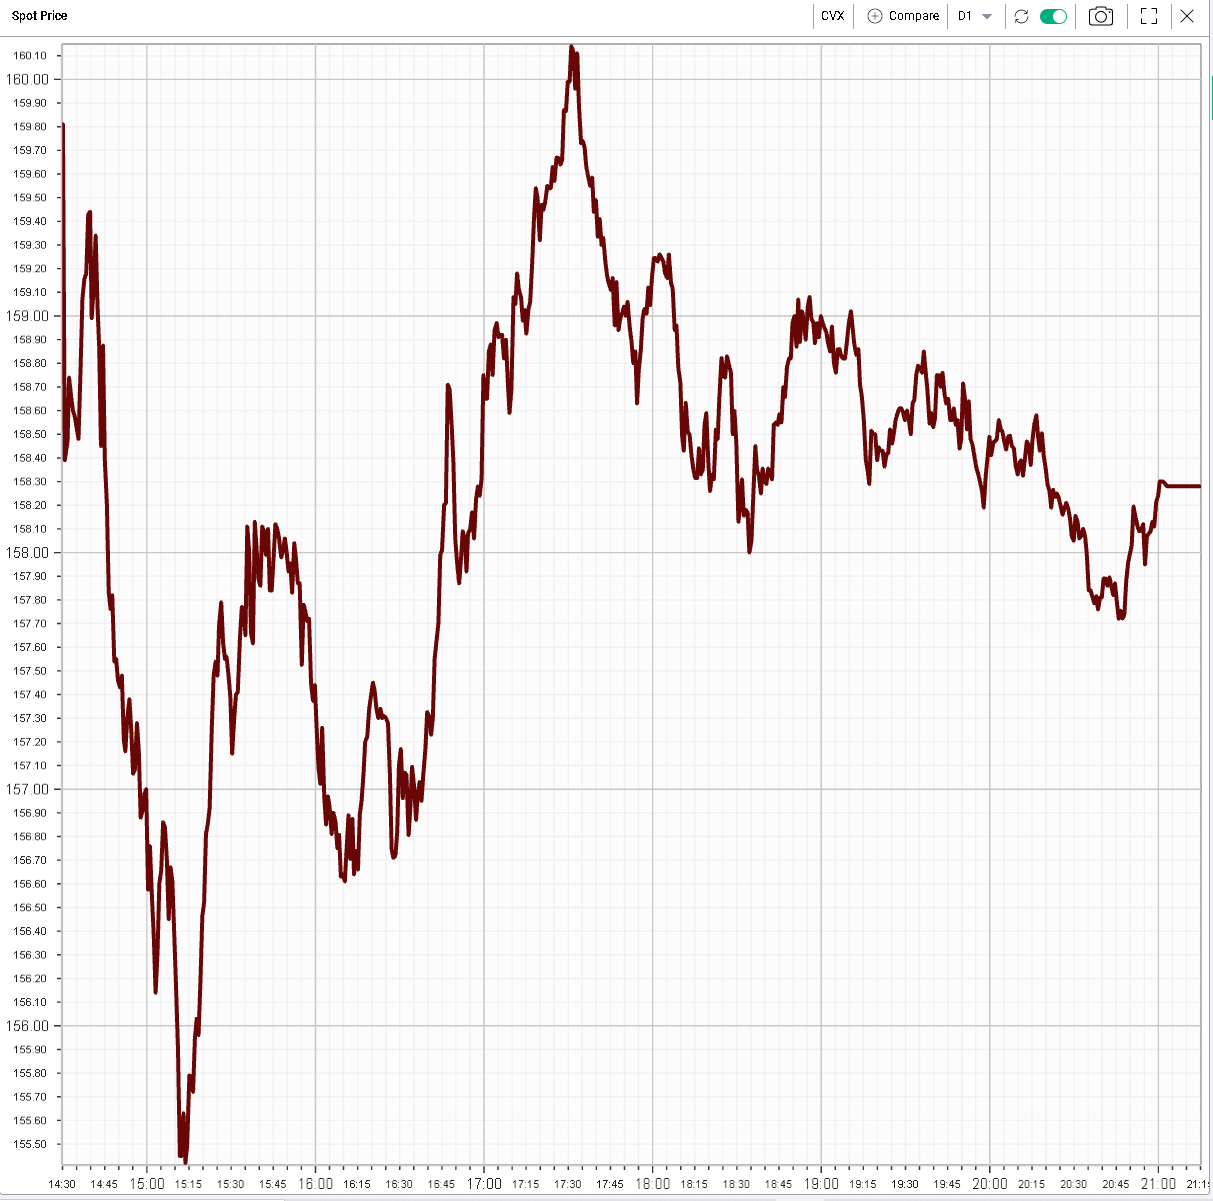
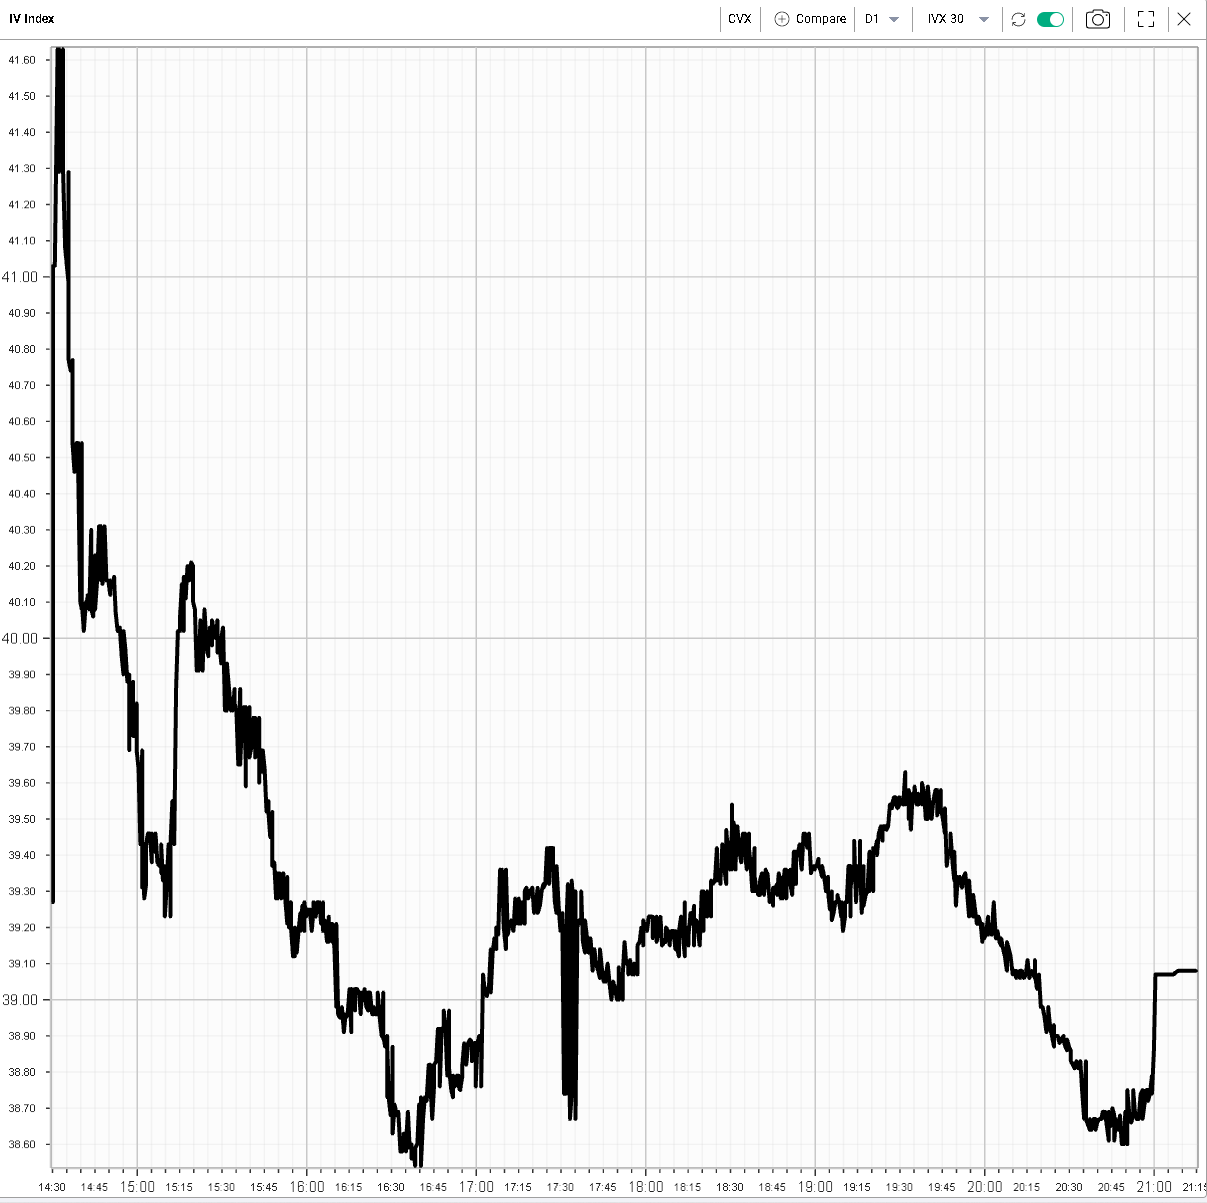
At the sector level, the energy space was the only one that finished the day lower down about 4%. We highlighted in yesterday’s market update the very strong relationship between CVX and the Oil spot price over the past few weeks and flagged that CVX had been outperforming the Oil price recently. The trading session yesterday saw a clear correction of that phenomenon with CVX finishing down 5% on the day with the 30d IVX declining meaningfully as well on the day. |
Yesterday’s spot price for CVX – 1 min snapshots |
Yesterday’s 30d IVX for CVX – 1 min snapshots |
One sector that was pretty strong yesterday was the consumer discretionary space with a top left, bottom right price action intraday and the sector finishing at the highs up 3.35% on the day. |
|
Zooming out, the space has been one of the most heavily sold, partly because of self-imposed sanctions by some of those companies but also because of risks to margins from inflation as well as demand destruction as prices rise. |
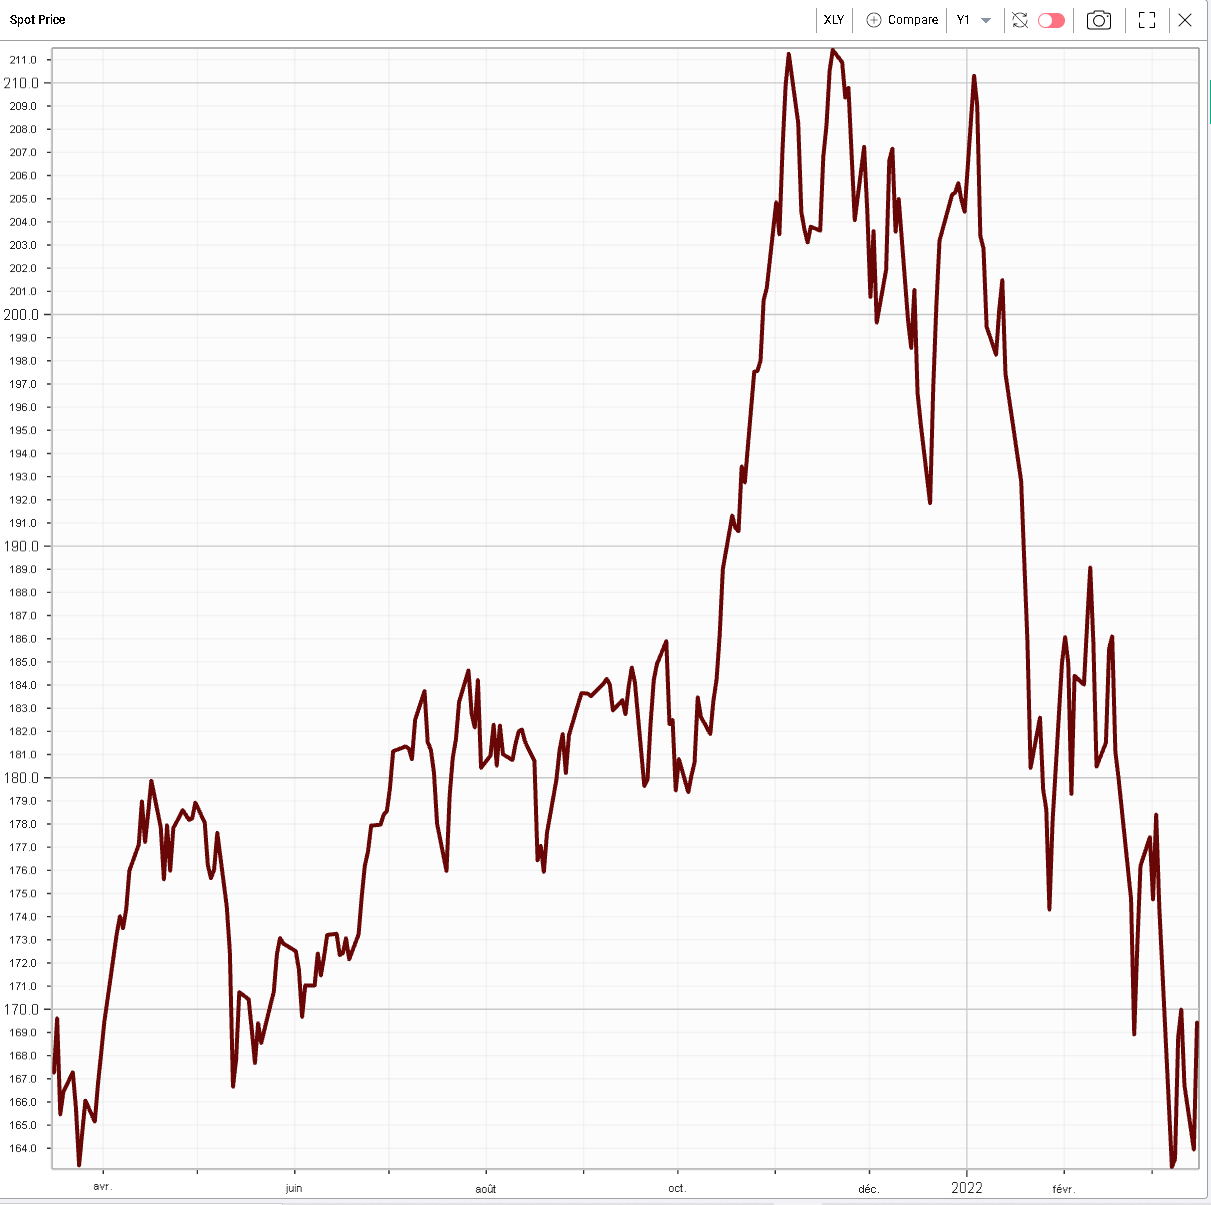
The below 1-year chart of the spot price in the consumer discretionary sector highlights the extent of the selloff seen so far this year. |
|
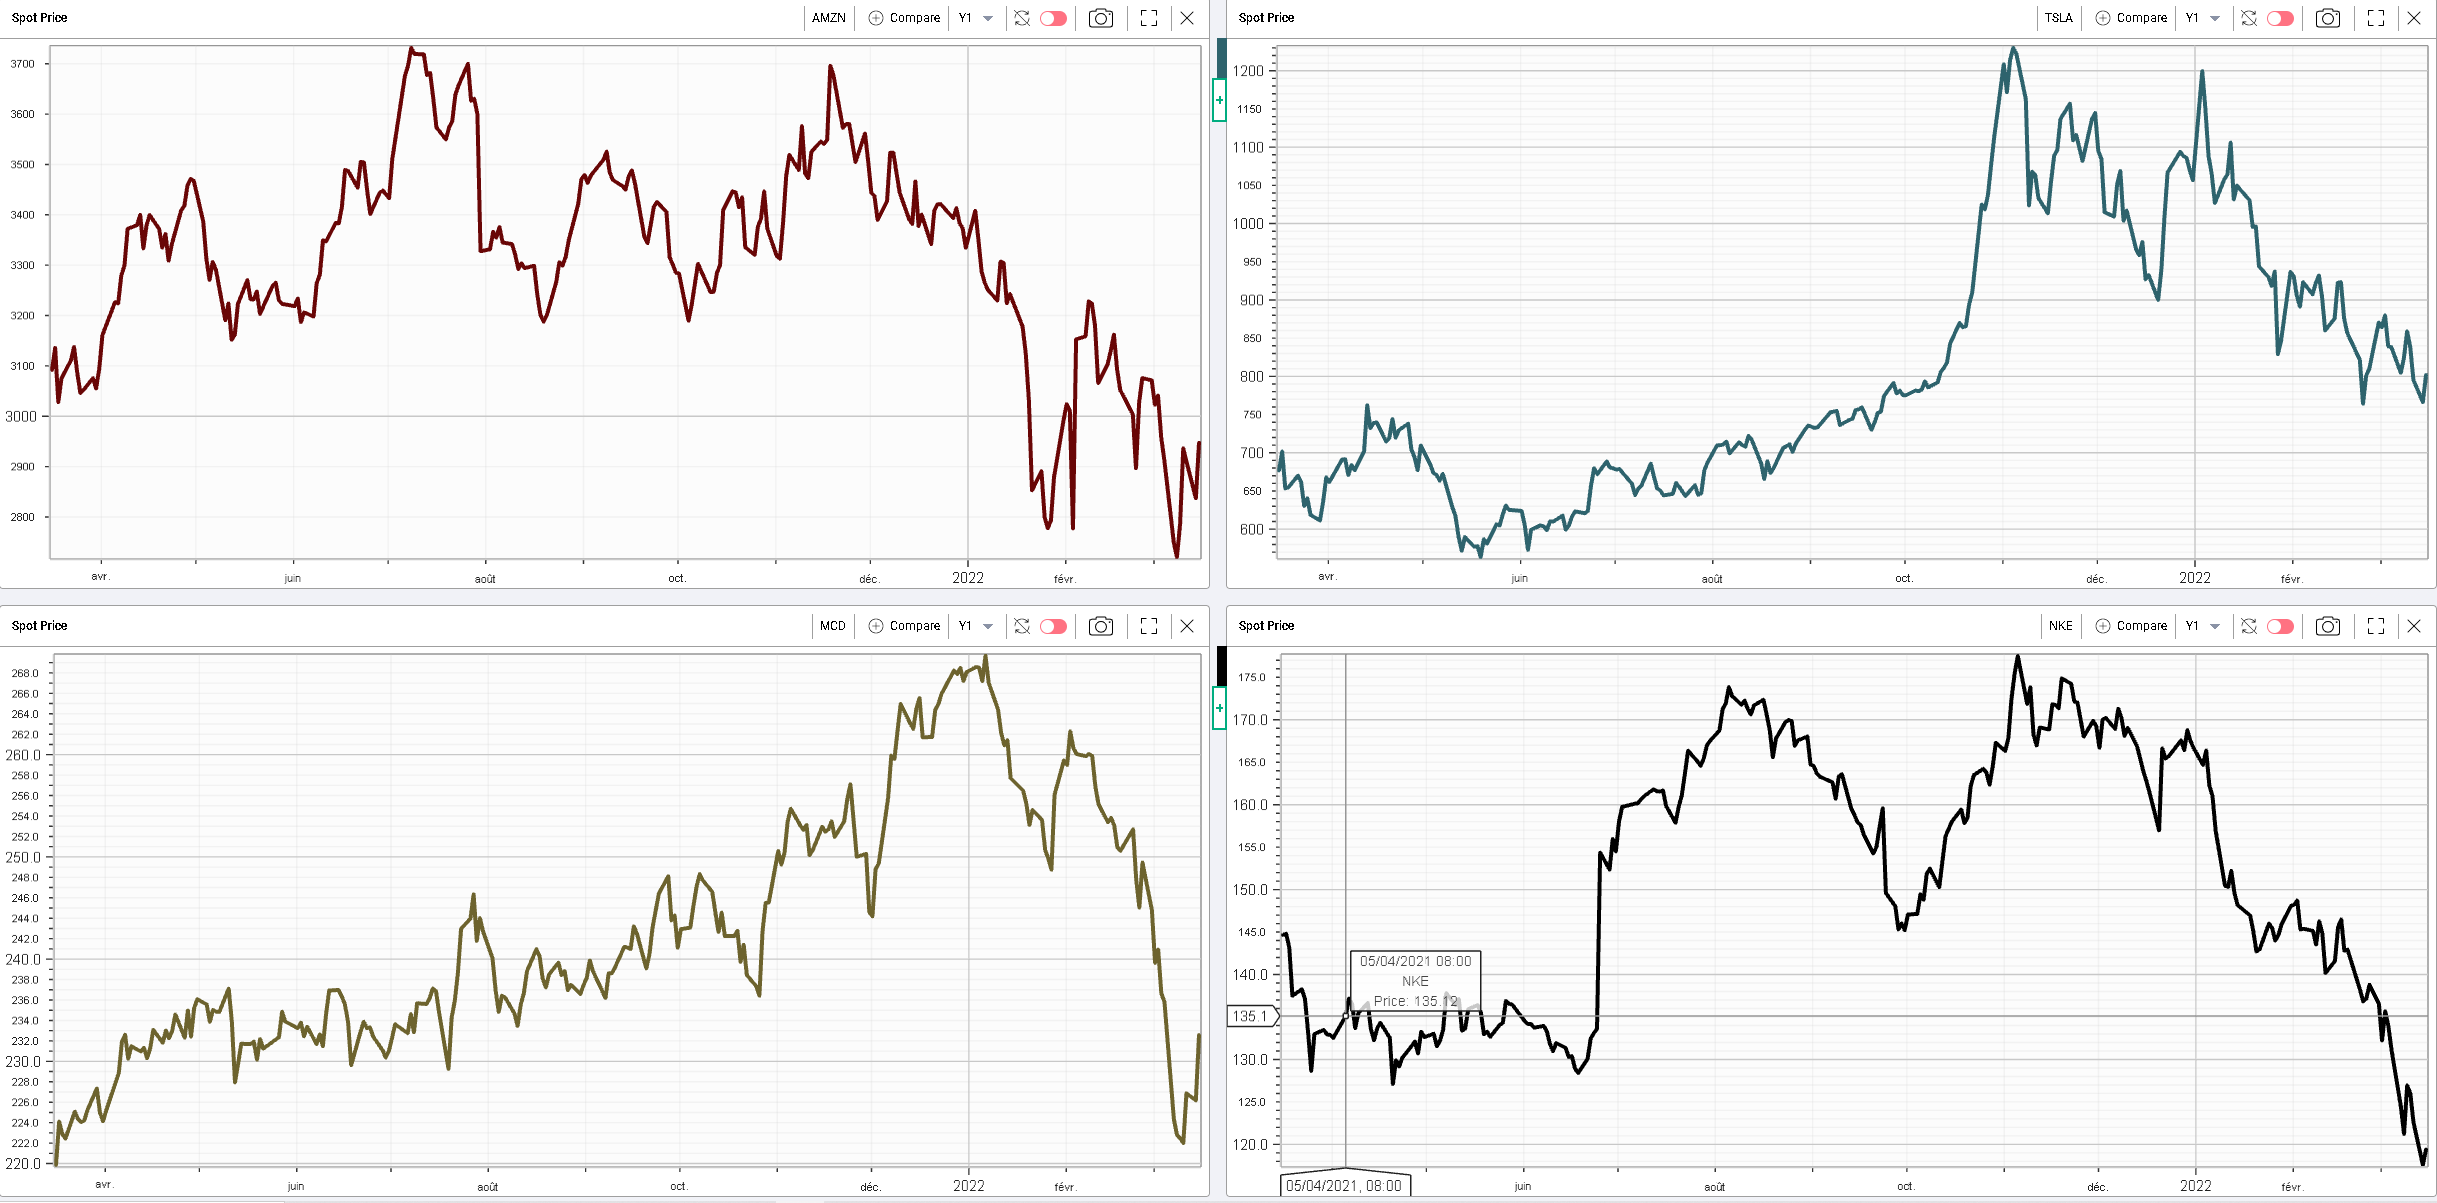
Amongst the biggest names in the sector, we find AMZN, TSLA, MCD or NKE. Looking at the 4 charts spot price over 12 months below we can see that NKE has remained the weakest name in the space while MCD and AMZN have started to bounce and TSLA stabilized at the lows. |
|
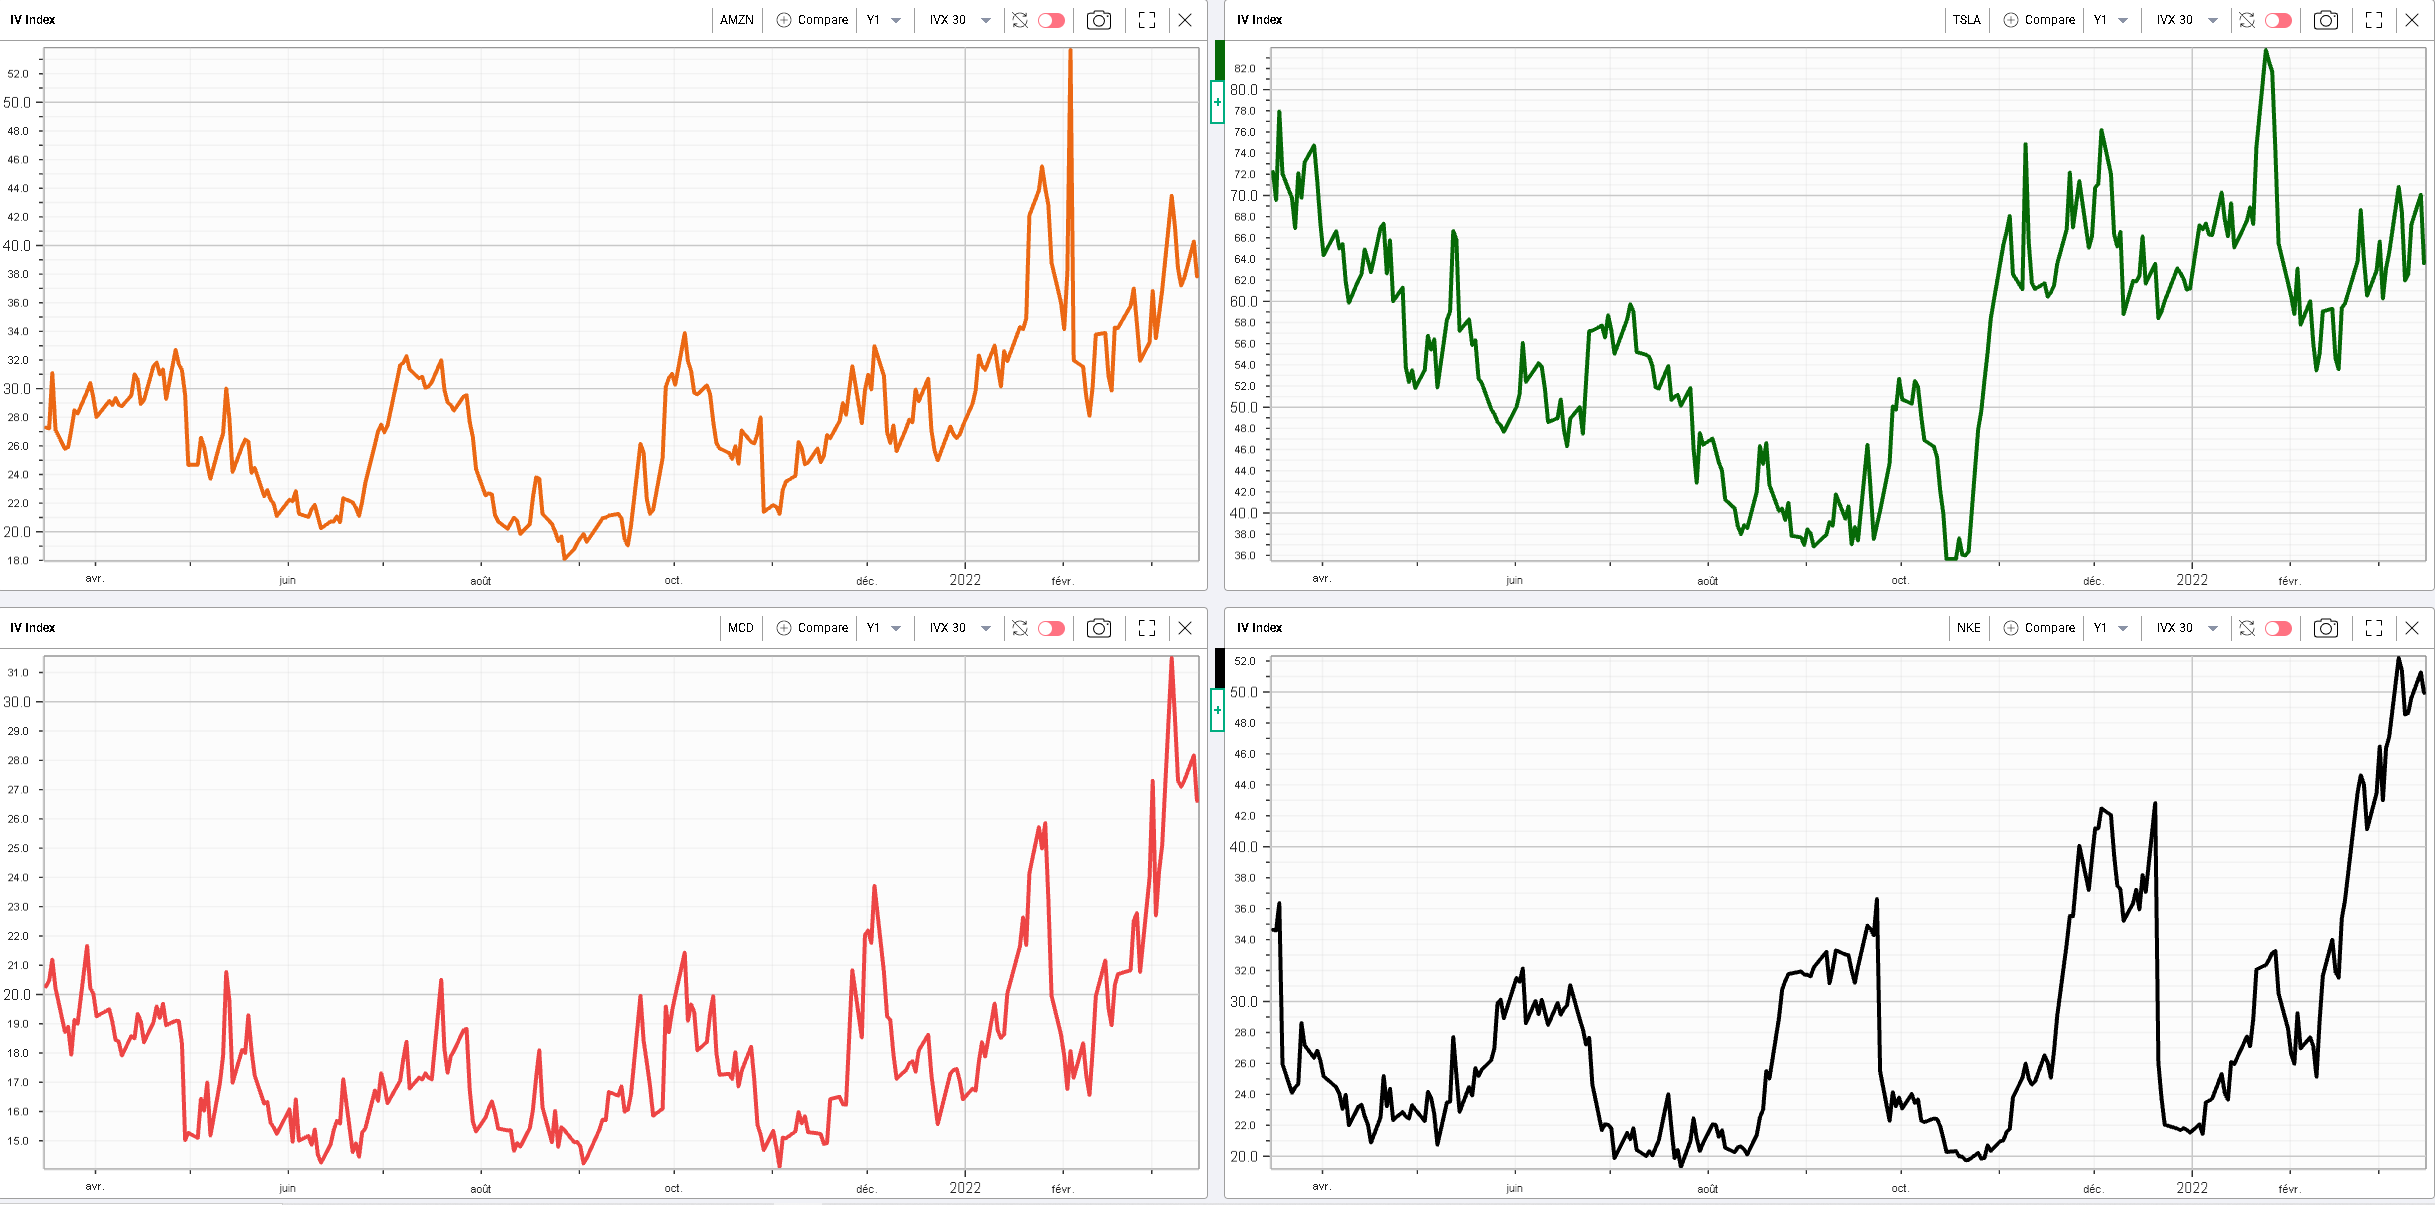
Looking at the 30d IVX for those 4 names over the last 12 months, we can see that AMZN and TSLA have already corrected from their recent highs while MCD and NKE are still hovering towards the recent highs. |
|
Disclaimer - This information is provided for general information and marketing purposes only. The content of the presentation does not constitute investment advice or a recommendation. IVolatility.com and its partners do not guarantee that this information is error free. The data shown in this presentation are not necessarily real time data. IVolatility.com and its partners will not be liable for any loss or damage, including without limitation, any loss of profit, which may arise directly or indirectly from the use or reliance on the information. When trading, you should consider whether you can afford to take the high risk of losing your money. You should not make decisions that are only based on the information provided in this video. Please be aware that information and research based on historical data or performance do not guarantee future performance or results. Past performance is not necessarily indicative of future results, and any person acting on this information does so entirely at their own risk. |