We offer multiple professional grade services to help you gain insight on volatility trading. Do not hesitate to try our products FOR FREE by clicking HERE |
The Market Update is a daily newsletter written by the team at iVolatility.com. Leveraging our analytics and data we are able to update you on key developments in the volatility market. To receive the Market Update directly into your inbox, please open a free account or visit our SITE where it is published every day. |
Market Update: 2022-03-18 |
Markets were quiet overall yesterday ahead of expiry day today and as the FOMC managed to convey the message that it was for now in control of the situation reassuring investors. |
Chinese equities continued their strong bounce with HSCEI gaining almost 8% yesterday and 30d IVX dropped about 5 points over the day. |
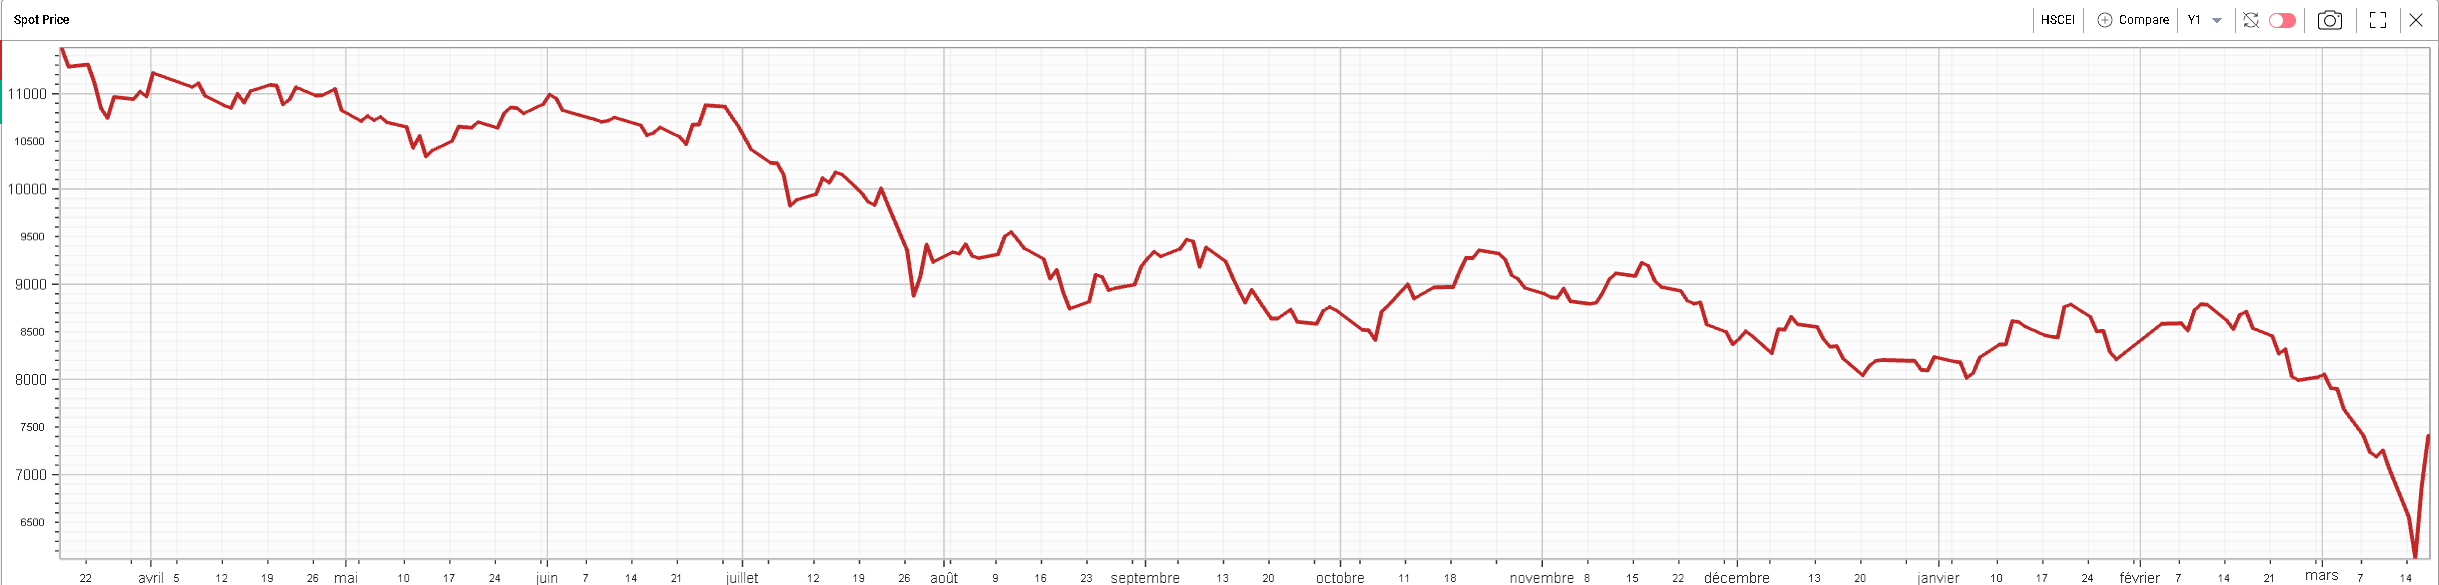
The speed and the strength of the bounce is very elevated as shown on the below spot price chart over the past 12 months for the Hong Kong index. The index has gained more than 20% over the past two trading sessions. |
|
This being said, even after today’s bounce, the index is still down 10% on the year and trades about 37% below its February 2021 high around 12,000. Many conversations over the past few days have been about the possibility for an even larger move on the upside and for Chinese single stocks to show some parabolic price action akin to what was witnessed around a year ago in names such as GME, NOKIA or AMC. |
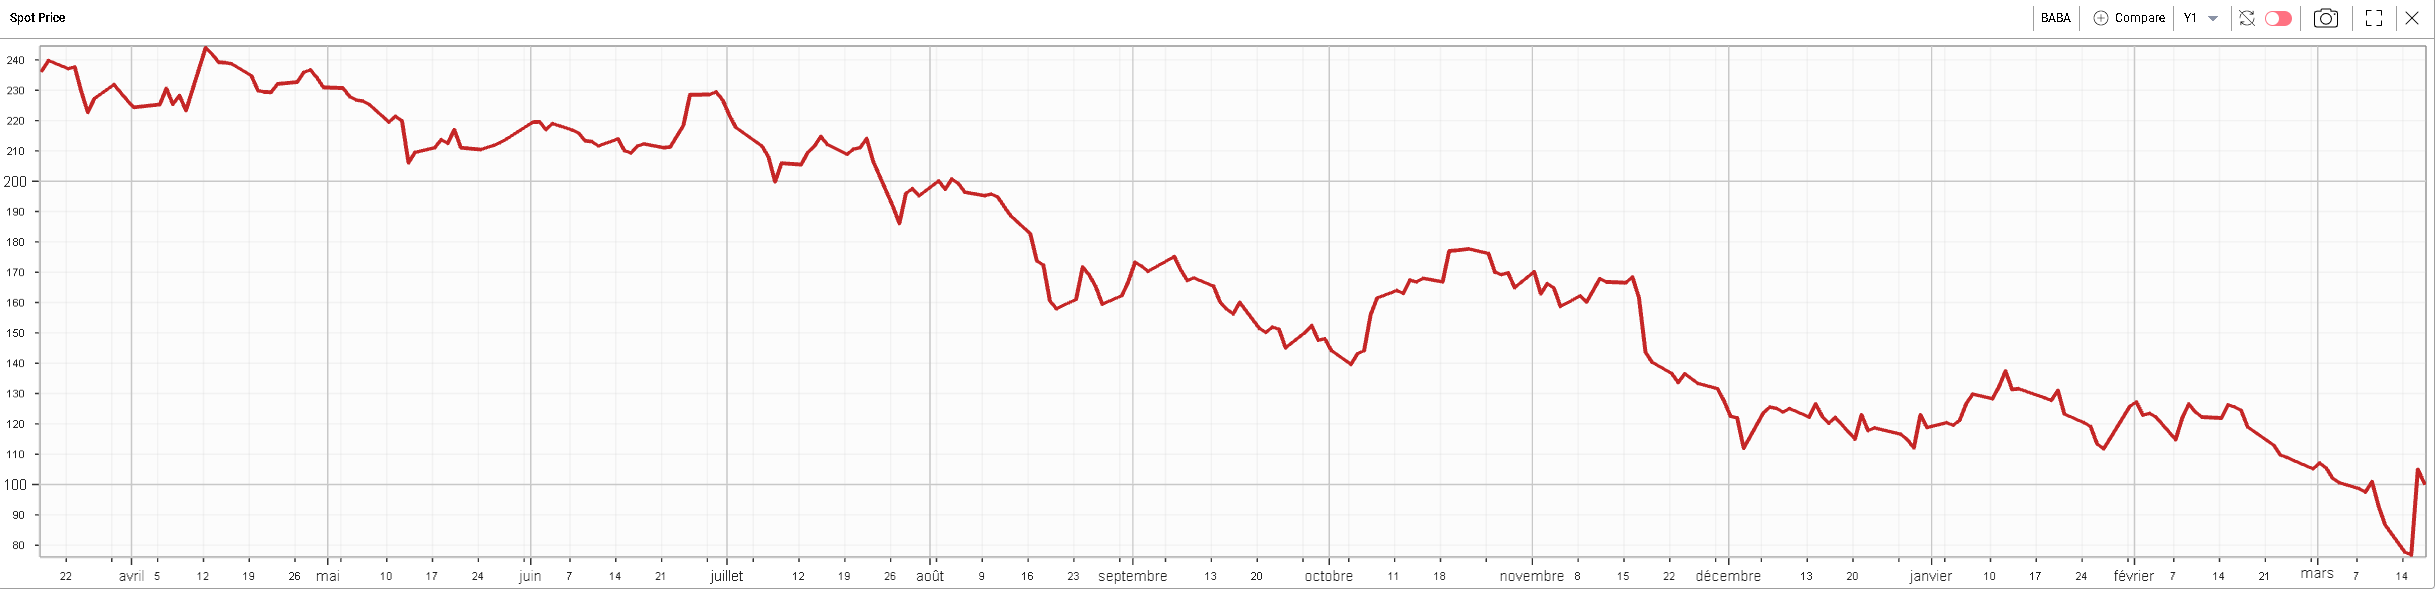
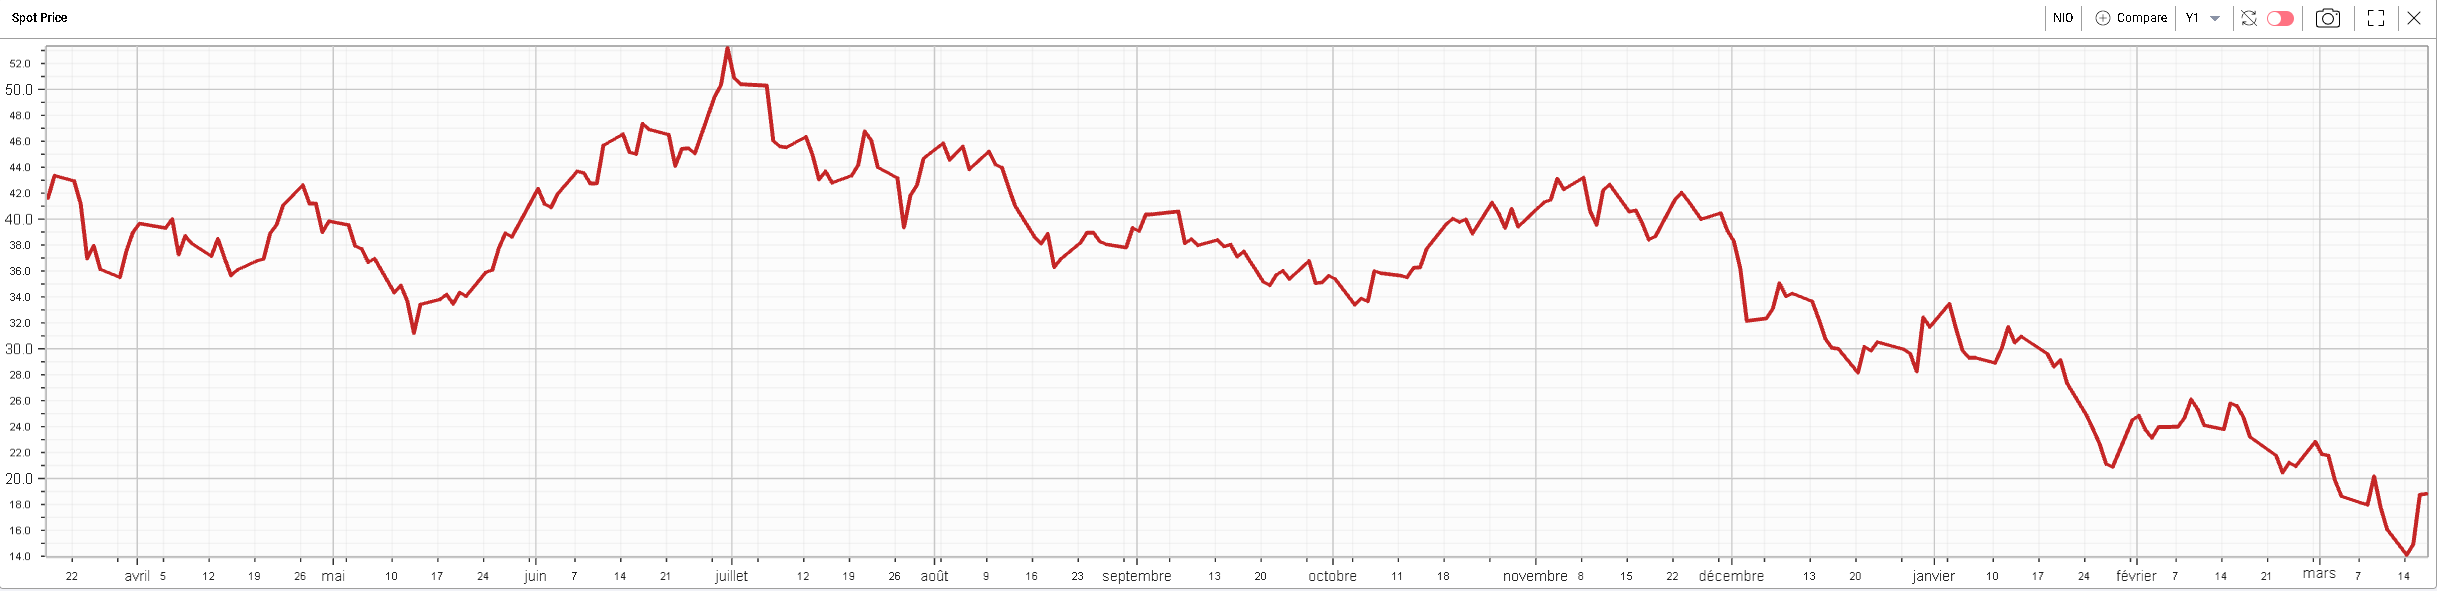
Looking at Chinese stocks listed on American exchanges, we can see a relatively similar picture. |
BIDU – Spot price – Last 12 months down 44.4% |
BABA – Spot Price – Last 12 months down 57.5% |
NIO – Spot Price – Last 12 months down 54.8% |
The recent move lower in Chinese stocks (undoubtedly some speculative money capitulating) and the subsequent bounce have raised a lot of attention on those names which had been on the sideline for the first few months of 2022. |
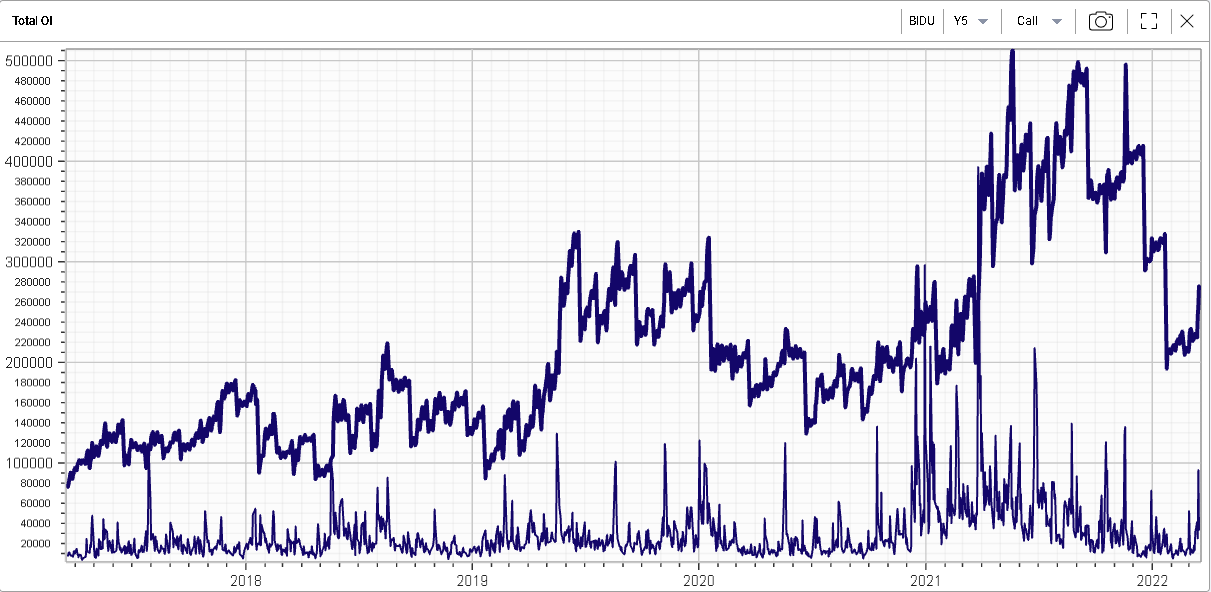
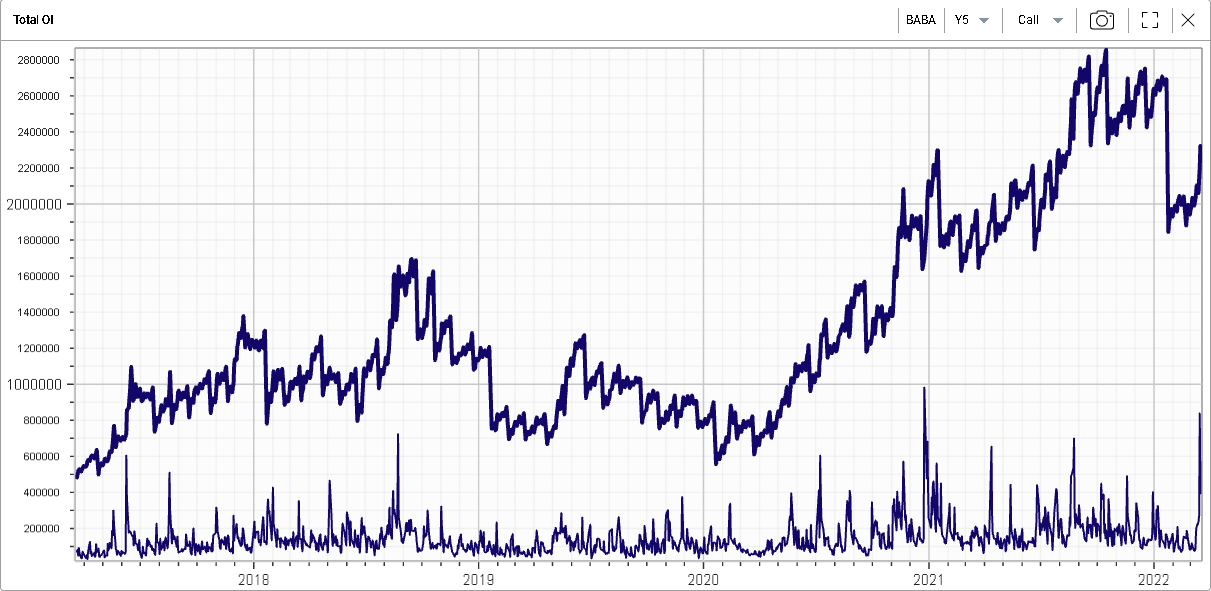
Looking at the options open interest and specifically the call side of things to understand how much traders have been involved in building upside positions, we can see that the OI (bold line below) has only recently started to move back higher and with it the options volumes (thin line) have picked up. |
BIDU – Call Total Open Interest and Volume – 5–year History |
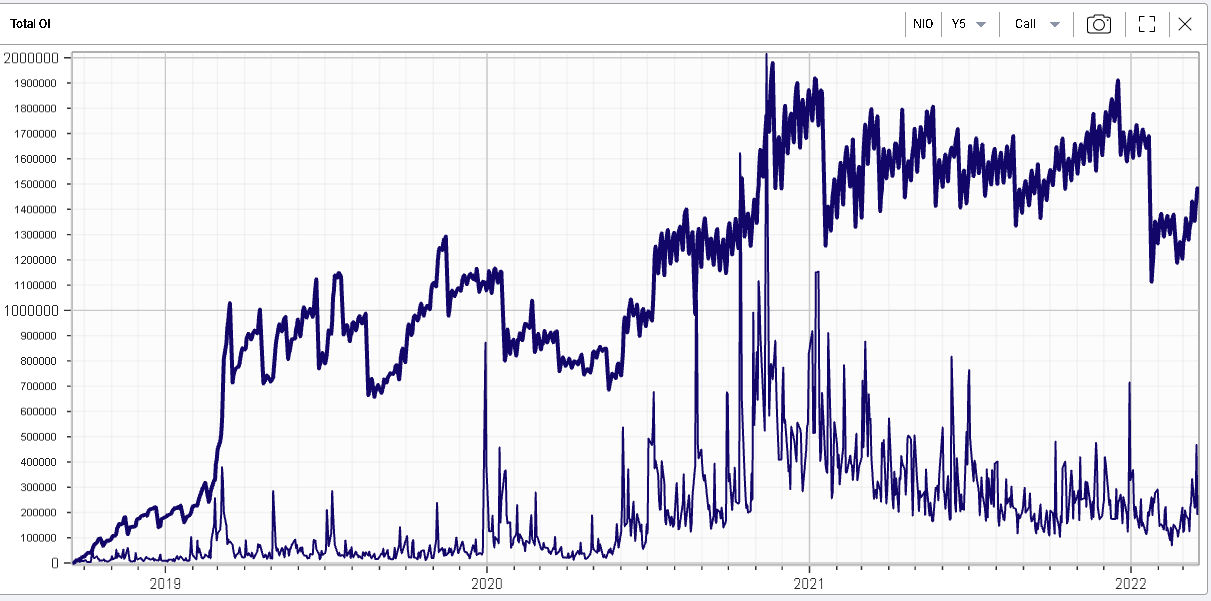
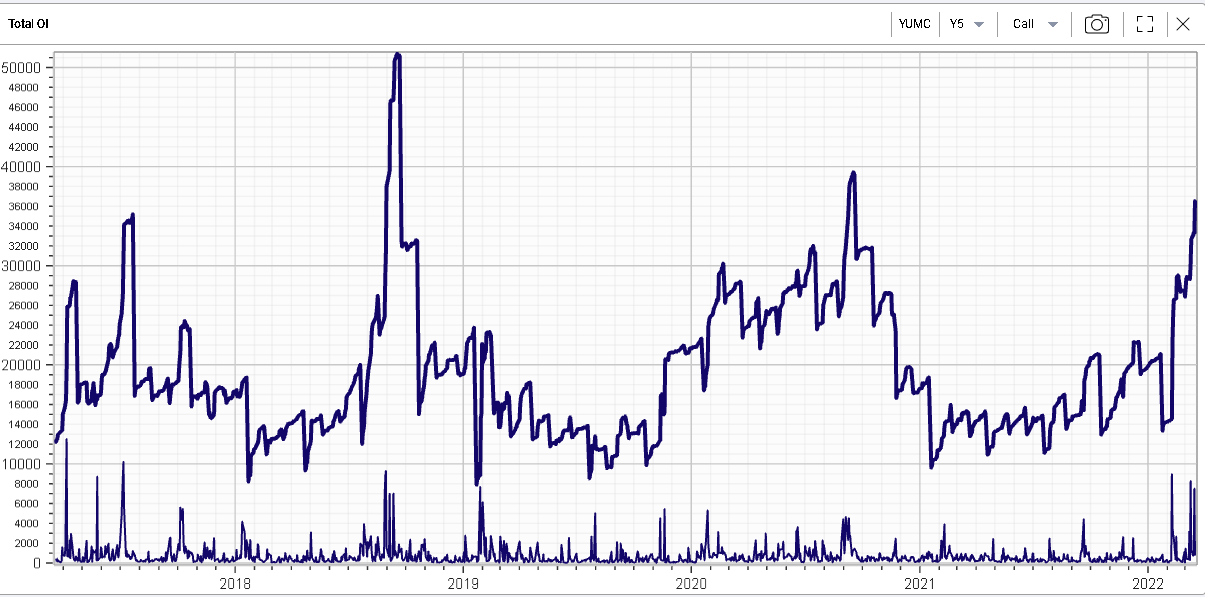
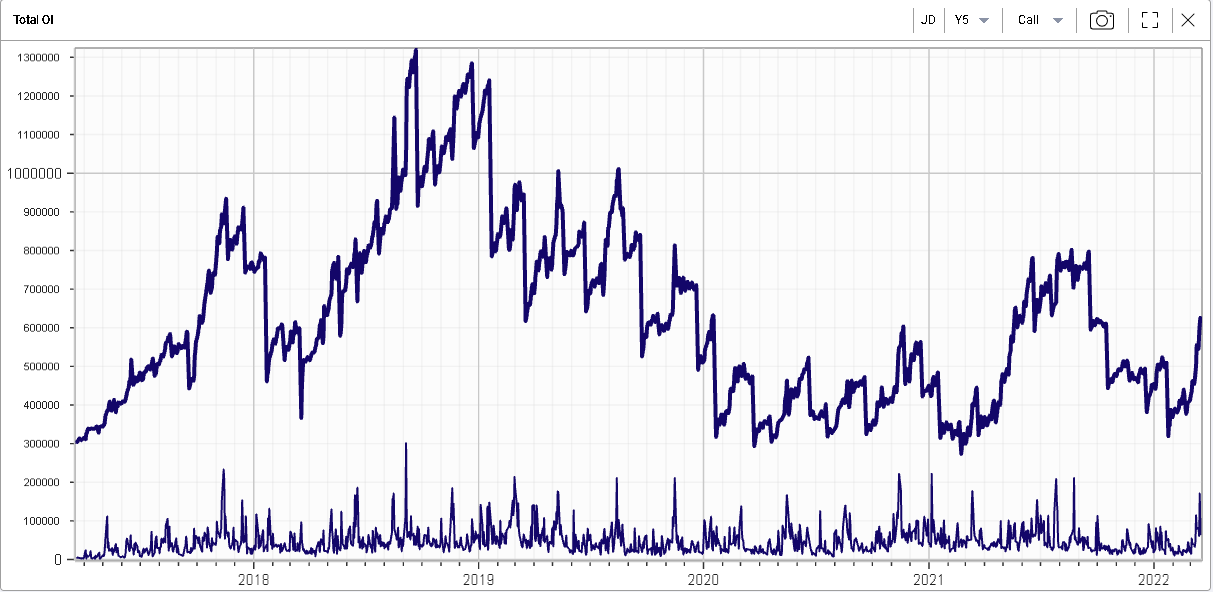
This pickup in call volume and open interest is currently happening across multiple Chinese ADRs listed in the US as shown in the following charts. |
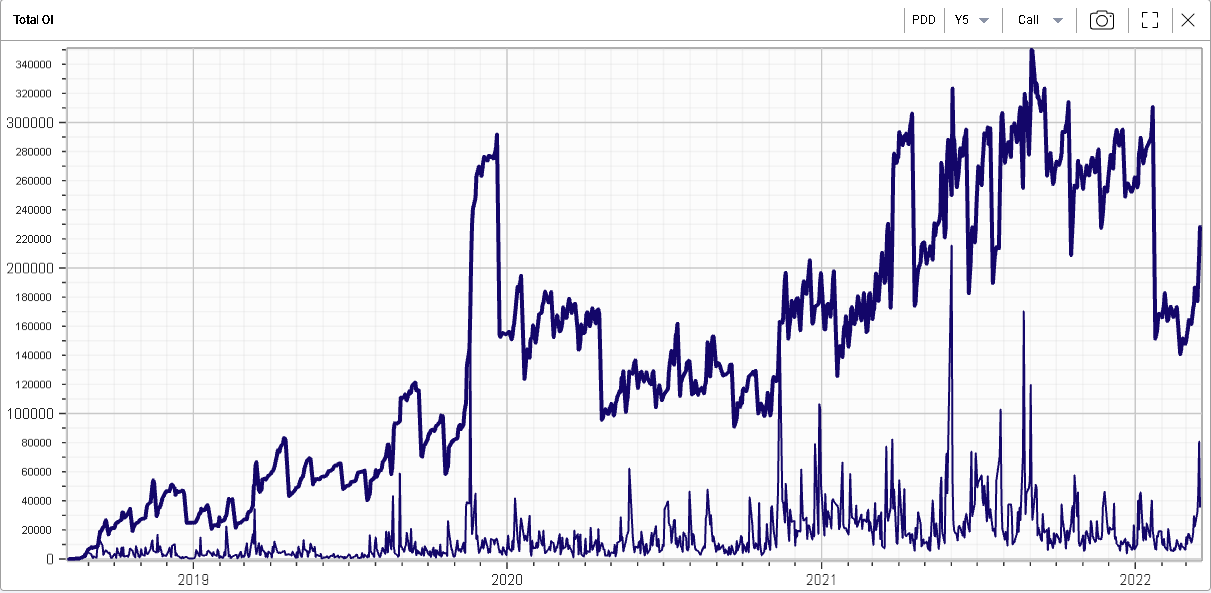
BABA – Call Total Open Interest and Volume – 5–year History |
NIO – Call Total Open Interest and Volume – 5–year History |
YUMC – Call Total Open Interest and Volume – 5–year History |
JD.Com – Call Total Open Interest and Volume – 5–year History |
PDD – Call Total Open Interest and Volume – 5–year History |
This increase in options trading activity and positioning has been accompanied by a general increase in volatility across pretty much all of the names. The first driver of this phenomenon being the very large increase in realized volatility both on the way down and then on the way up. |
As an example, if we look at BABA, we can see that the realized volatility jumped from the 60% mark to 90% over the past few weeks. |
BABA – 60 days realized volatility – Last 12 months |
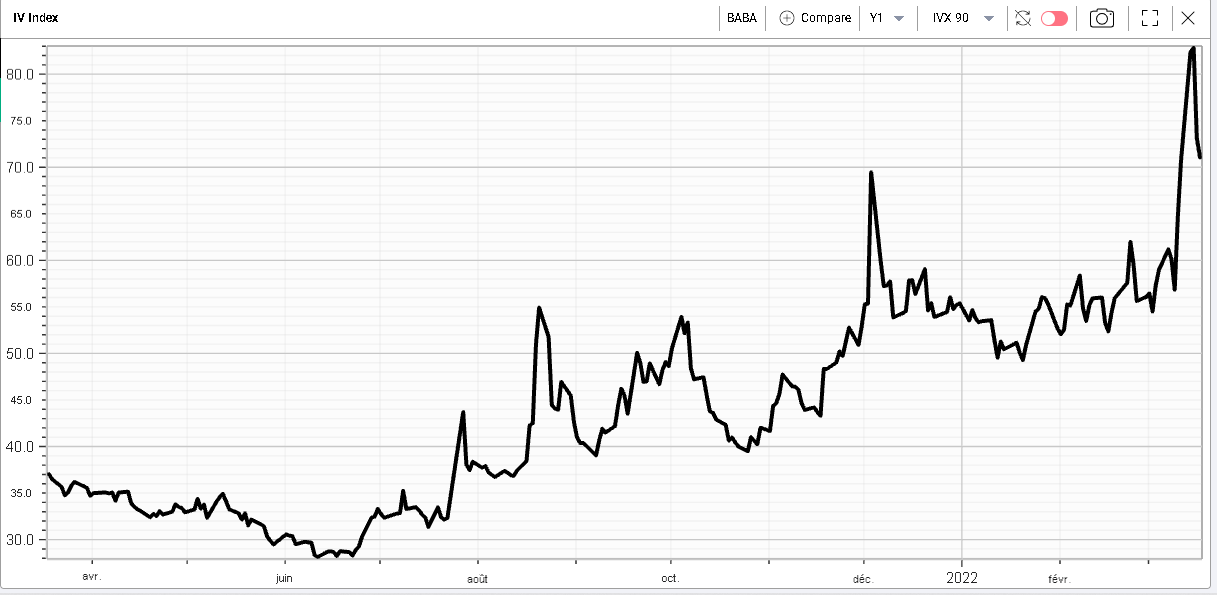
As a result, and despite the general easing of stress in the space in the last 48 hours following the verbal intervention by Chinese authorities, implied volatilities have deflated but only slightly as the IVX Premium already trades at highly discounted historical levels. |
BABA – 90 days IVX – Last 12 months |
BABA – 90 days implied vs 60 days realized – IVX Premium – Last 5 years |
In the BABA example, we can see that the 90/60 IVX premium is already sitting at its lowest level over the last 5 years with an almost 20 points discount for implied volatility vs realized. |
It will thus be very interesting to see how those names react over the next few weeks but almost more importantly to get a clear picture of what traders are doing, keep an eye on the open interest both on the call side (which we address here) and the put side (which we leave for you to analyze) which will be highly informative. |
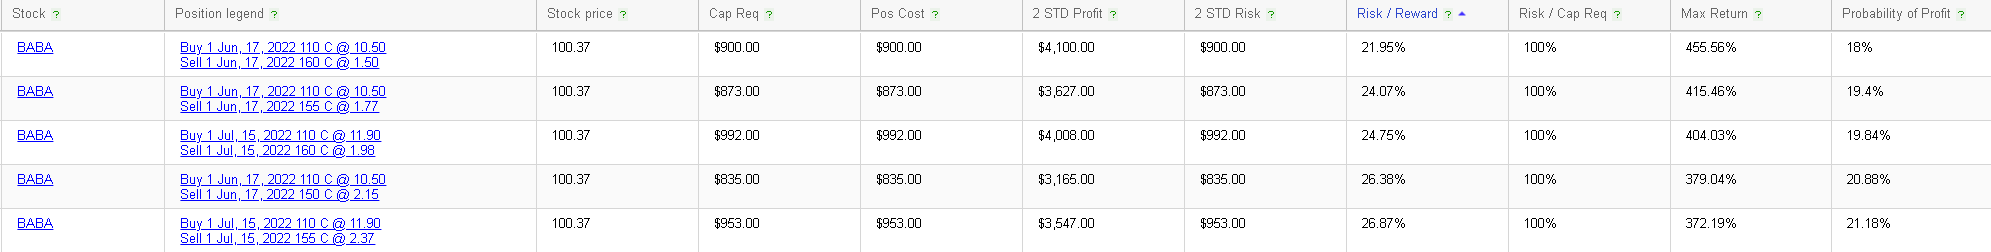
Here again, if you have a strong conviction about those names, we encourage you to try our RT Spread Scanner which will try to find the most attractive opportunities based on the criteria you select in order to optimize your entry point. Let us for instance imagine that a trader is bullish on BABA and thinks that volatility is high but not expensive. As a result, he scans for the bull vertical spread offering the best risk to reward ratio on BABA. |
The system then identifies the 5 following structures which offer the best Risk to Reward ratio on BABA with the parameters we defined. |
|
In the first example, the Jun′22 110/160 bull vertical spread, we can see that our maximum net profit at expiration is $4,100 for a potential risk of $900 which is the net premium of the structure. |
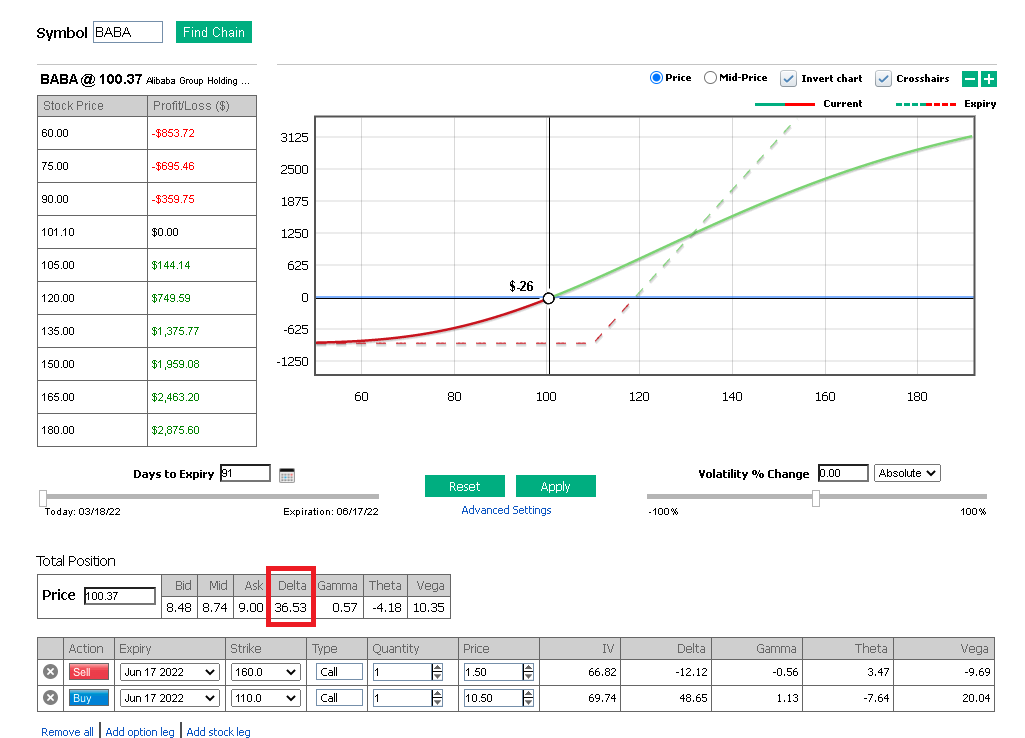
If we want to assess how that Profit and Loss would be realized, I suggest turning to the PNL Calculator, another tool of our suite of services that allows to comprehend the real exposures that traders have. |
|
We can see here that the position delta is equivalent to around 36.53 shares. This is why when we look at the top right chart, we can see that the dotted line representing the payoff at expiration is much steeper than the current payoff. |
This being said, as we can see on the dotted payoff, the profit at maturity will only be realized once we trade past the strike while the current position will start gaining even when the spot is below the strike. |
In fact, by changing some of the parameters we can see that the system estimates a gain of roughly $300 should the spot price get to the strike price in 10 days. |
|
This system makes it possible for traders to refine the positions they want to take depending on the risk and reward they are willing to accept. It also helps them understand how their position will evolve though time for a set of scenarios that they define. |
Disclaimer - This information is provided for general information and marketing purposes only. The content of the presentation does not constitute investment advice or a recommendation. IVolatility.com and its partners do not guarantee that this information is error free. The data shown in this presentation are not necessarily real time data. IVolatility.com and its partners will not be liable for any loss or damage, including without limitation, any loss of profit, which may arise directly or indirectly from the use or reliance on the information. When trading, you should consider whether you can afford to take the high risk of losing your money. You should not make decisions that are only based on the information provided in this video. Please be aware that information and research based on historical data or performance do not guarantee future performance or results. Past performance is not necessarily indicative of future results, and any person acting on this information does so entirely at their own risk. |