We offer multiple professional grade services to help you gain insight on volatility trading. Do not hesitate to try our products FOR FREE by clicking HERE |
The Market Update is a daily newsletter written by the team at iVolatility.com. Leveraging our analytics and data we are able to update you on key developments in the volatility market. To receive the Market Update directly into your inbox, please open a free account or visit our SITE where it is published every day. |
Market Update: 2022-03-19 |
Markets continued to bounce on expiration day led by the NDX which gained more than 2%. The SPX finished about 1% higher. Implied volatilities continue to drop, with 30d IVX down 2 points on NDX and SPX. |
One aspect that is being discussed is the performance of risk assets despite the geopolitical tensions. In fact, US indices are now trading higher than where they were on the 24th Feb’22 and we are getting very close to those levels even for European indices. |
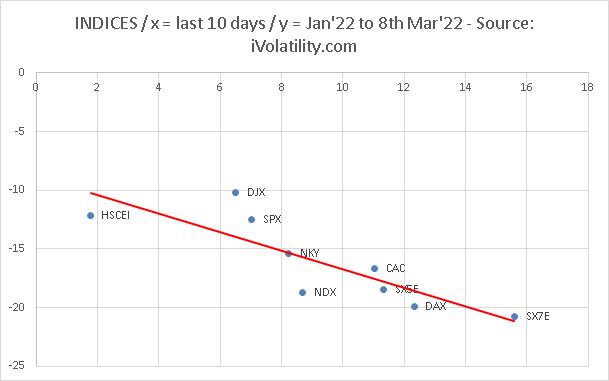
The low point in US markets was reached on the 8th Mar’22 and at the index level, European indices have shown the best overall performance since the 8th Mar’22. The German DAX index is up more than 12% and the Eurozone Banking sector has posted a performance of +16%. |
US Indices have done really well too with the NDX up almost 9% and the SPX up 7%. Finally in Asia, the NKY is up about 8% while the HSCEI is up a mere 2% despite having bounced incredibly aggressively over the past 3 trading sessions. |
It is not entirely surprising to find that European assets have bounced the most as they were the most impacted during the initial selloff. |
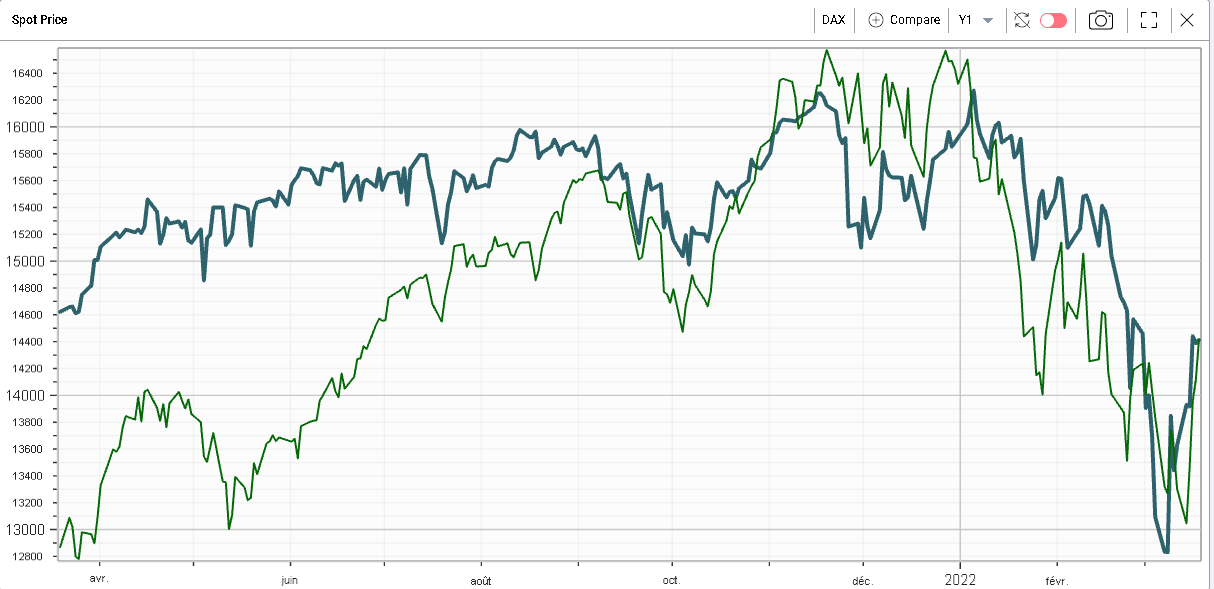
Looking at the below chart that displays the performance of the NDX (in green) against the German DAX (in blue) over the past 12 months, we can see that despite the selloff in tech stocks this year, the NDX has significantly outperformed its German counterpart over the last year. In fact, over the last year it is up 13.5% more than the German DAX. |
|
Looking at the sector performance in the US, the energy space is the only sector to have closed below its 8th Mar’22 level, down about 5%. This is obviously not entirely surprising given that the index is still up around 29% year to date on the back mainly of rising energy prices. |
The best performing sector over the last 10 days is the consumer discretionary. Interestingly it is one of the worst performing spaces for the year down about 13.5%. The Financials have also done well since the 8th Mar’22, up almost 10% and pretty much unchanged on the year. Finally, the tech sector is up around 7.5% over the past 10 days and settles about 14% lower year to date. |
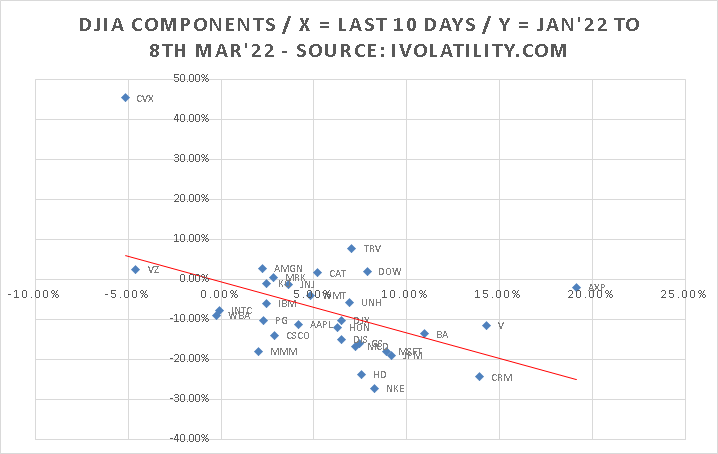
Looking at single stocks, some names do stand out. It comes to no surprise that CVX would be slightly lower in line with the wider sector (-5% over the last 10 days). VZ is the only other stock in the DJIA that traded lower since the 8th Mar’22. While CVX is still up more than 35% on the year, VZ is down slightly, about 3%. |
On the upside, AXP is the best performing stock of the DJIA, up almost 20%. V and CRM are both up around 15%. On the year, AXP is up about 14% so far, V is unchanged and CRM is down around 15% so some nice overall dispersion for the best stocks of the last 10 days. |
Looking more broadly it seems that a very large portion of the performance we have seen over the last 10 days at the index, sector and even stock level can be explained by the performance until the low point in the selloff. In other words, the more an underlier was affected by the selloff, the more it rebounded. |
The below chart shows all 30 DJIA components with in x-axis their performance over the last 10 days and in y-axis their performance between the 1st Jan’22 and the 8th Mar’22. |
|
This effect is even more pronounced at the index level as can be seen on the below chart where it really looks like that phenomenon alone explains the vast majority of the moves. |
|
This observation raises the following question. If the price action of the last 10 days was inversely correlated with the performance observed for the first 3 months of the year, should we consider that the most recent price action is a correction of an excess within a medium-term trend or do we see signs that the trend that prevailed at the start of the year is exhausted and has now started to reverse? |
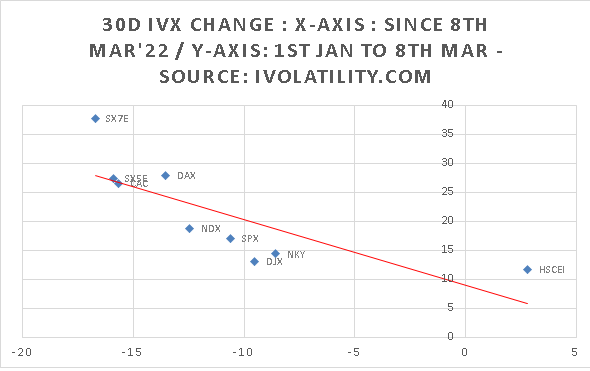
Looking at volatility we find a pretty similar picture with implied volatilities that have dropped the most over the past 10 days being those that increased the most during the initial vol expansion phase. The chart below shows that phenomenon for major indices. |
|
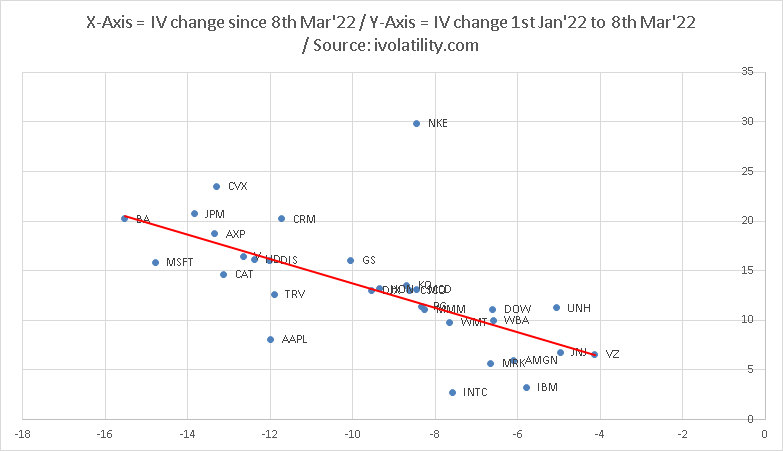
The same can be observed at the single stock level, below we show that relationship for the components of the DJIA. |
|
Interestingly this leaves us with some notable outliers such as NKE, AAPL or INTC. |
In order to have a reference point to compare our single stocks to, we can use a major, well diversified index such as the SPX. This will allow us to quickly compare the position of our individual stocks with some asset that we will use as a benchmark. |
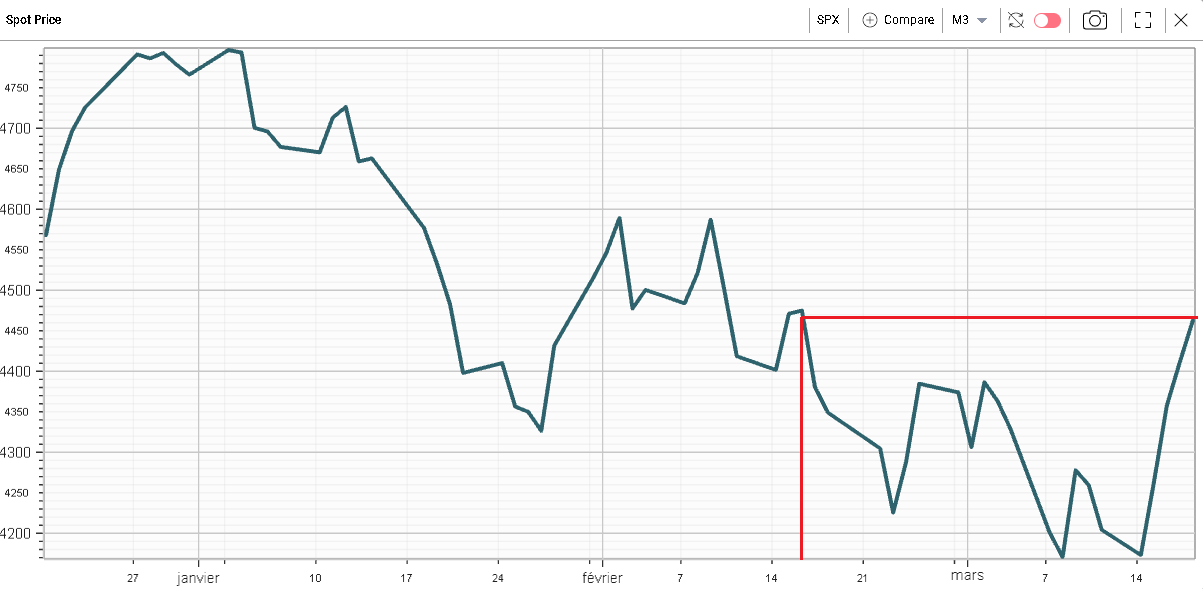
Below are the spot price and 30d IVX 3 months charts for the SPX. We can see that the index has bounced significantly and is now trading around the level it reached around the 16th Feb’22. |
|
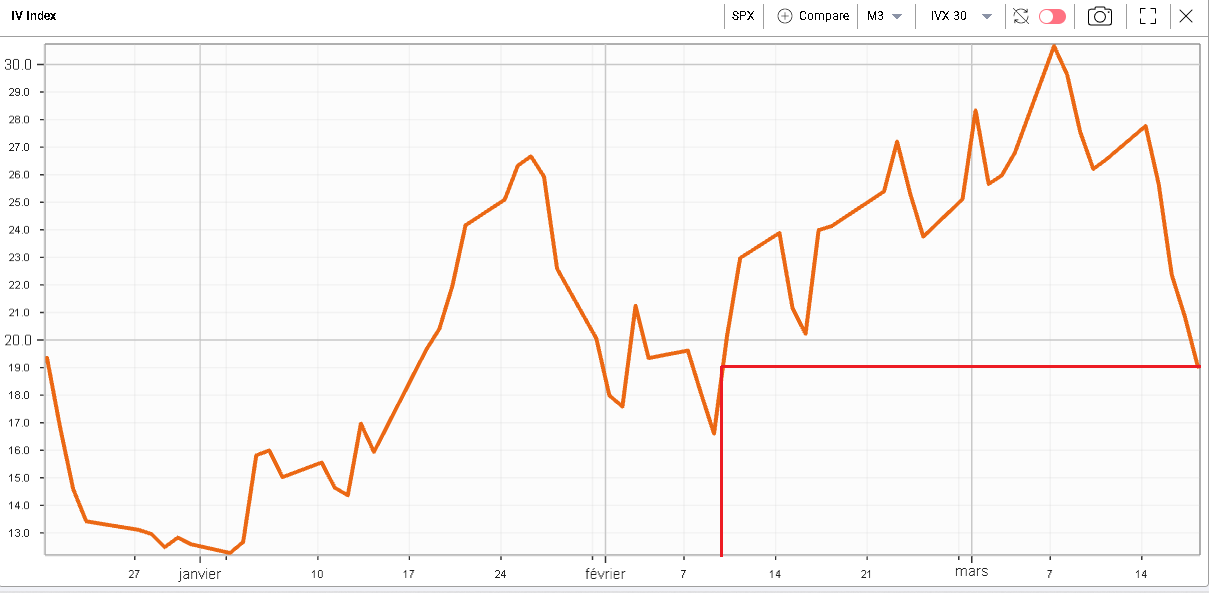
With the below chart, we can see that the 30d IVX for the SPX has underperformed its spot and is now trading at a level last since around the 10th Feb’22. |
|
This suggests that at the index level, options traders have not only priced out the risks related to the Ukraine/Russia conflict but possibly some other risks as well. One such worry could have been to know how the FED would handle the spike in inflation and proceed with hiking interest rates. Now that this first rate increase is out of the way and that the FED seems to have managed to walk that line pretty well, options traders may have been pricing out some of that risk too. |
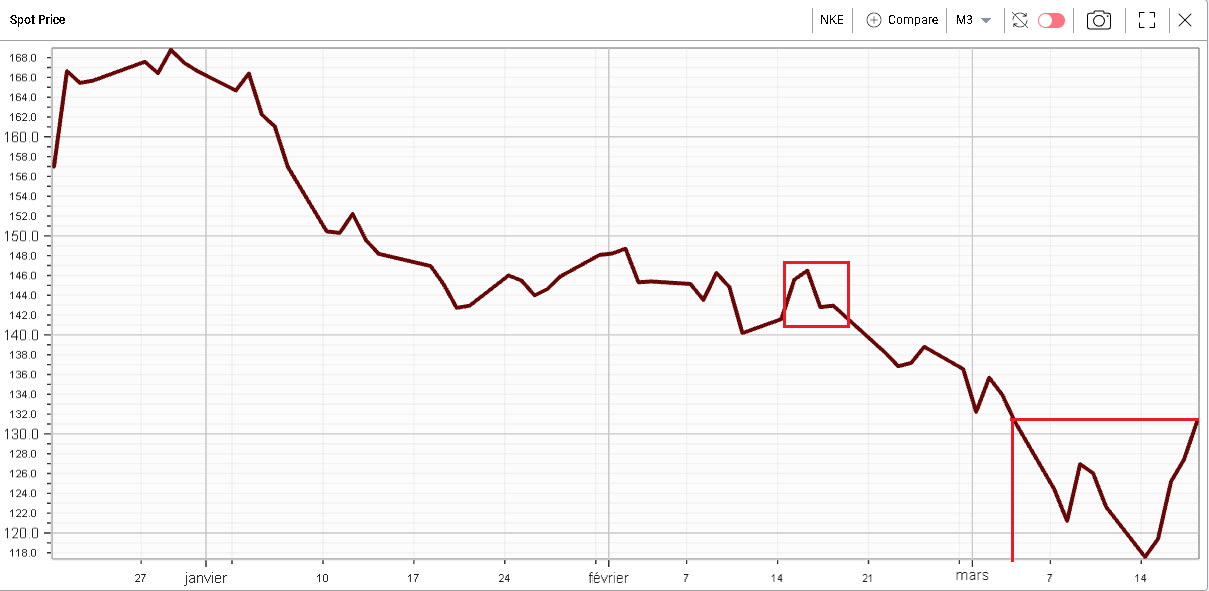
Looking at NKE, we can see on the below 3 months chart that the stock is currently trading at the level where it was on the 4th Mar’22 or a much smaller bounce that what was seen for the SPX. If NKE had bounced in line with the SPX, it would now be trading at roughly $145 vs its $131.24 level of last Friday. |
|
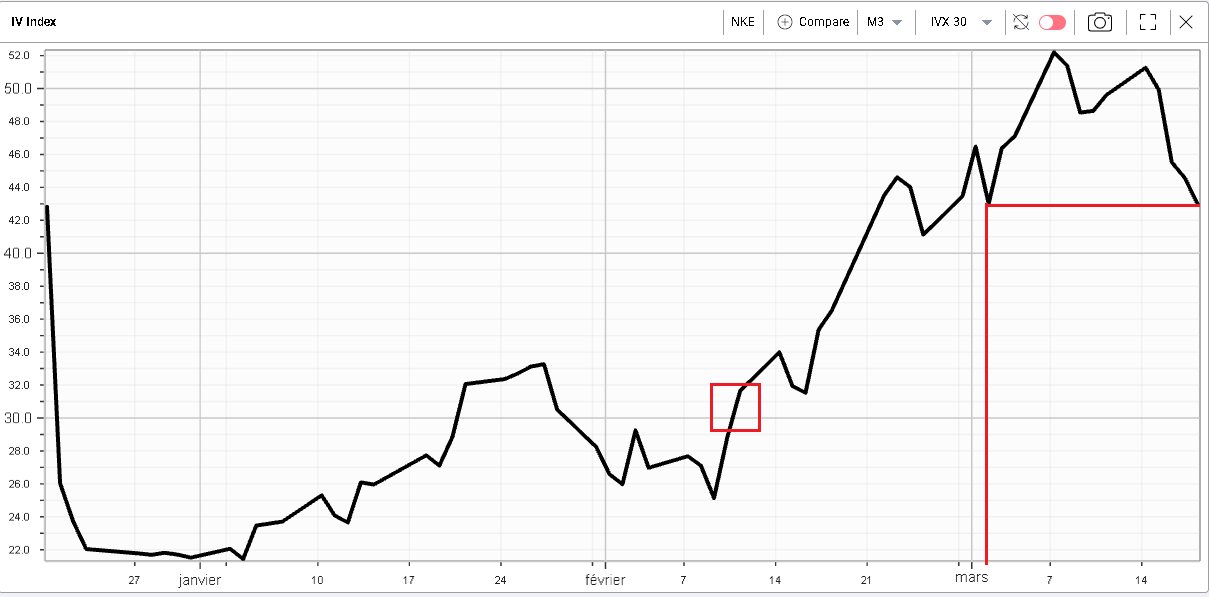
Looking at the 30d IVX, a very similar picture emerges with the implied volatility index trading around its early Mar’22 level for NKE. We find that, should the implied volatility in NKE have dropped by as much as that of the SPX, it would be trading around 30 points instead of the 43% level it reached on Friday. |
|
By using a reference index, we are able to see that NKE spot price has underperformed and that its implied volatility has outperformed the benchmark we decided to use. There could be plenty of reasons to explain why this situation is happening. First there could be something specific to our reference index which could explain that it performed differently from the stock we looked at. Second, there could be reasons that are only applicable to the stock we are considering that could explain this situation. |
So, this approach gives no certainty of finding trades but as with all things it is a starting point. More importantly it helps traders compare assets that may exhibit very different properties over short period of time to assess if opportunities could exist. |
Disclaimer - This information is provided for general information and marketing purposes only. The content of the presentation does not constitute investment advice or a recommendation. IVolatility.com and its partners do not guarantee that this information is error free. The data shown in this presentation are not necessarily real time data. IVolatility.com and its partners will not be liable for any loss or damage, including without limitation, any loss of profit, which may arise directly or indirectly from the use or reliance on the information. When trading, you should consider whether you can afford to take the high risk of losing your money. You should not make decisions that are only based on the information provided in this video. Please be aware that information and research based on historical data or performance do not guarantee future performance or results. Past performance is not necessarily indicative of future results, and any person acting on this information does so entirely at their own risk. |