The Market Update is a daily newsletter written by the team at iVolatility.com. Leveraging our analytics and data we are able to update you on key developments in the volatility market. To receive the Market Update directly into your inbox, please open a free account or visit our SITE where it is published every day. |
An approach to collect Theta while limiting overall risks |
Considering that the activity in the market has considerably slowed down over the past few weeks, we wanted to discuss how to use IVolLive services for a strategy that consists in collecting Theta while limiting risks of adverse scenarios. |
As with all things, this post is not investment advice and its sole goal is to help you understand how you can use the different tools provided by IVolatility.com in the context of a well identified trading strategy. Please read the disclaimer at the bottom of this post and on our website for more information. |
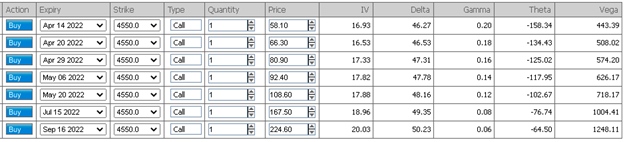
It is a well-known fact that options will lose more value as they approach expiration. In the below table produced using the PnL Calculator service, we can see how for the same option with different expirations, the Theta increases as we get close to the expiration. |
For instance, the 4550 calls expiring on the 14th Apr’22 have a daily Theta of $158. In other word, if nothing happens and the SPX does not move at all, the trader who is short the option will collect $158 over the day. Looking further out, we can see that this amount of Theta collected each day shrinks rapidly. The same option with an expiration date on the 15th Jul’22 has a Theta of $77 per day. |
|
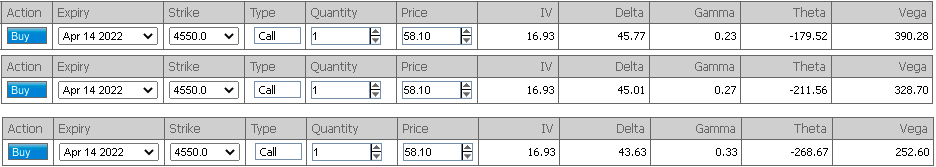
It is also worth noting that the Theta will increase at an even faster rate as the expiration draws near. Using the scenario functionality from the PnL calculator, we are able to estimate how the Theta of our 14th Apr’22 4550 Calls would evolve in 5, 10 and 15 days, should everything else remain the same. We can see below that if today’s Theta is $158, this value will jump to $180 a day in 5 days, $212 in 10 days and $269 in 15 days (assuming all the other parameters, most importantly spot remain the same). |
|
This observation is at the core of many option selling strategies that have become very popular over the past few years. It goes without saying that selling options, especially short dates ones is not a risk-free activity. There is a reason why another trader is willing to spend money in order to acquire those options from you. |
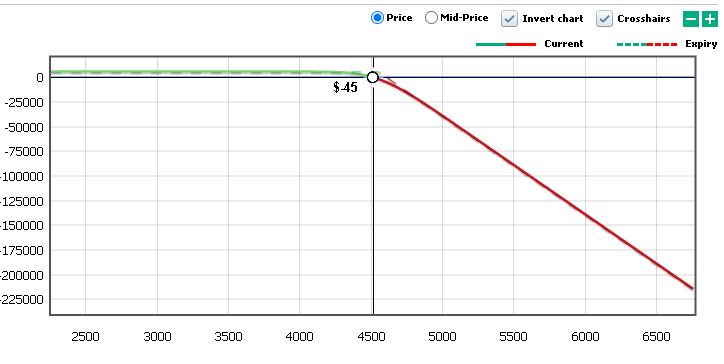
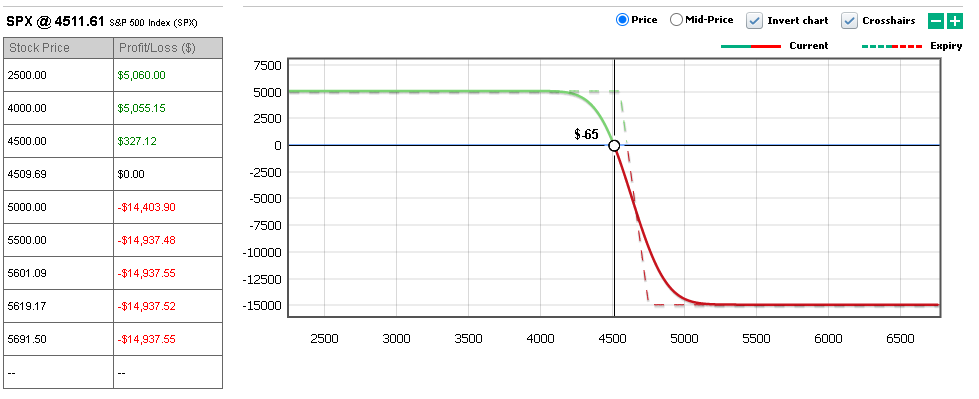
Using the PnL Calculator, we can simulate the risks embedded in selling this option for various changes in spot price. At Ivolatility.com, we represent those risks both in the form of an interactive chart but also with a table recapitulating the performance for various spot scenarios. |
Looking at the chart below from PnL Calculator, we can see the substantial amount of risk we carry by selling those naked calls. We can easily see that, should the SPX have a significant move higher, we stand to lose a multiple of the daily Theta we can collect. |
|
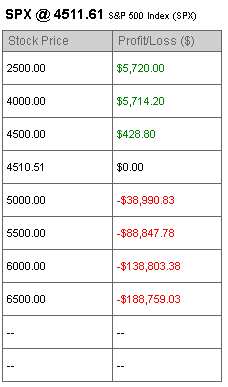
For instance, looking at the below table, we can see that for the 14th Apr’22 4550 Calls sold on the 23rd Mar’22 for a daily Theta of $158, should the SPX move to 5,000, we would lose around $39,000. Obviously, it is not every day that the SPX would move more than 10% in a day but this example serves to illustrate some of the risks embedded in options selling. |
|
This asymmetry in the payoff of options is what makes it very difficult for traders to actually collect the Theta in options. The risk/reward never looks great because the drawdown in case of a loss is generally a multiple of what traders stand to lose. Furthermore, even if the final outcome is only known at expiration, the path that the market takes will have a significant impact on the trader’s capacity to hold his position when facing a potentially significant loss. |
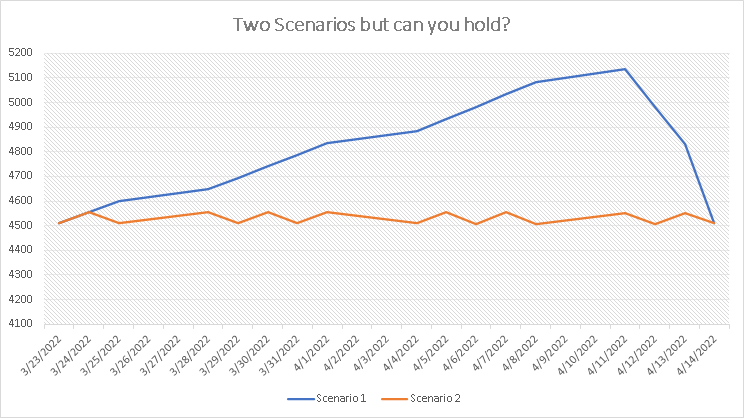
For instance, imagine that you are short the 4550 Calls with expiration 14th Apr’22. Let us also assume that the spot price will finish exactly at 4511 at expiration allowing you to gain 100% of the overall premium of the option. Let us consider the following scenarios, first a market that goes up for the first few weeks and collapses back to the strike just before the expiration and a market that hovers around the strike without really moving away from it. Those scenarios are shown on the below price chart. |
|
If it is relatively easy for a trader to hold the short call position in scenario 2, this becomes far more complicated in scenario 1 as losses build up and pressure the trader each day until the final collapse happens. |
This observation has been at the root of the spread approach. By selling an option and buying another one further out of the money, the trader is able to control the maximum loss of the entire position he takes. As the trader buys an option further out of money, he reduces the overall premium he is able to collect and with it reduces the Theta that he can collect each day. |
This approach is thus a compromise to convert a strategy with a potentially unlimited risk into a strategy with a predefined maximum loss in exchange for a smaller gain. |
Looking back at the PnL Calculator and considering the short 14th Apr’22 4550 / 4750 Bull Vertical Spread, we can see how our maximum loss is now capped at $15,000. |
|
Looking at the Theta of the strategy, we can see that buying back those 4750 calls contributes to around a third of the Theta we collect from the 4550 Calls. This allows us to precisely understand how much we are giving away in Theta for the benefit of capping our maximum loss. |
|
I will stop here for today, and will happily pick this discussion up in future newsletters. If you find this series interesting, please let us know on SUPPORT@IVOLATILITY.COM. If there are some other themes you would like us to discuss, do not hesitate to write to us. |
Disclaimer - This information is provided for general information and marketing purposes only. The content of the presentation does not constitute investment advice or a recommendation. IVolatility.com and its partners do not guarantee that this information is error free. The data shown in this presentation are not necessarily real time data. IVolatility.com and its partners will not be liable for any loss or damage, including without limitation, any loss of profit, which may arise directly or indirectly from the use or reliance on the information. When trading, you should consider whether you can afford to take the high risk of losing your money. You should not make decisions that are only based on the information provided in this video. Please be aware that information and research based on historical data or performance do not guarantee future performance or results. Past performance is not necessarily indicative of future results, and any person acting on this information does so entirely at their own risk. |